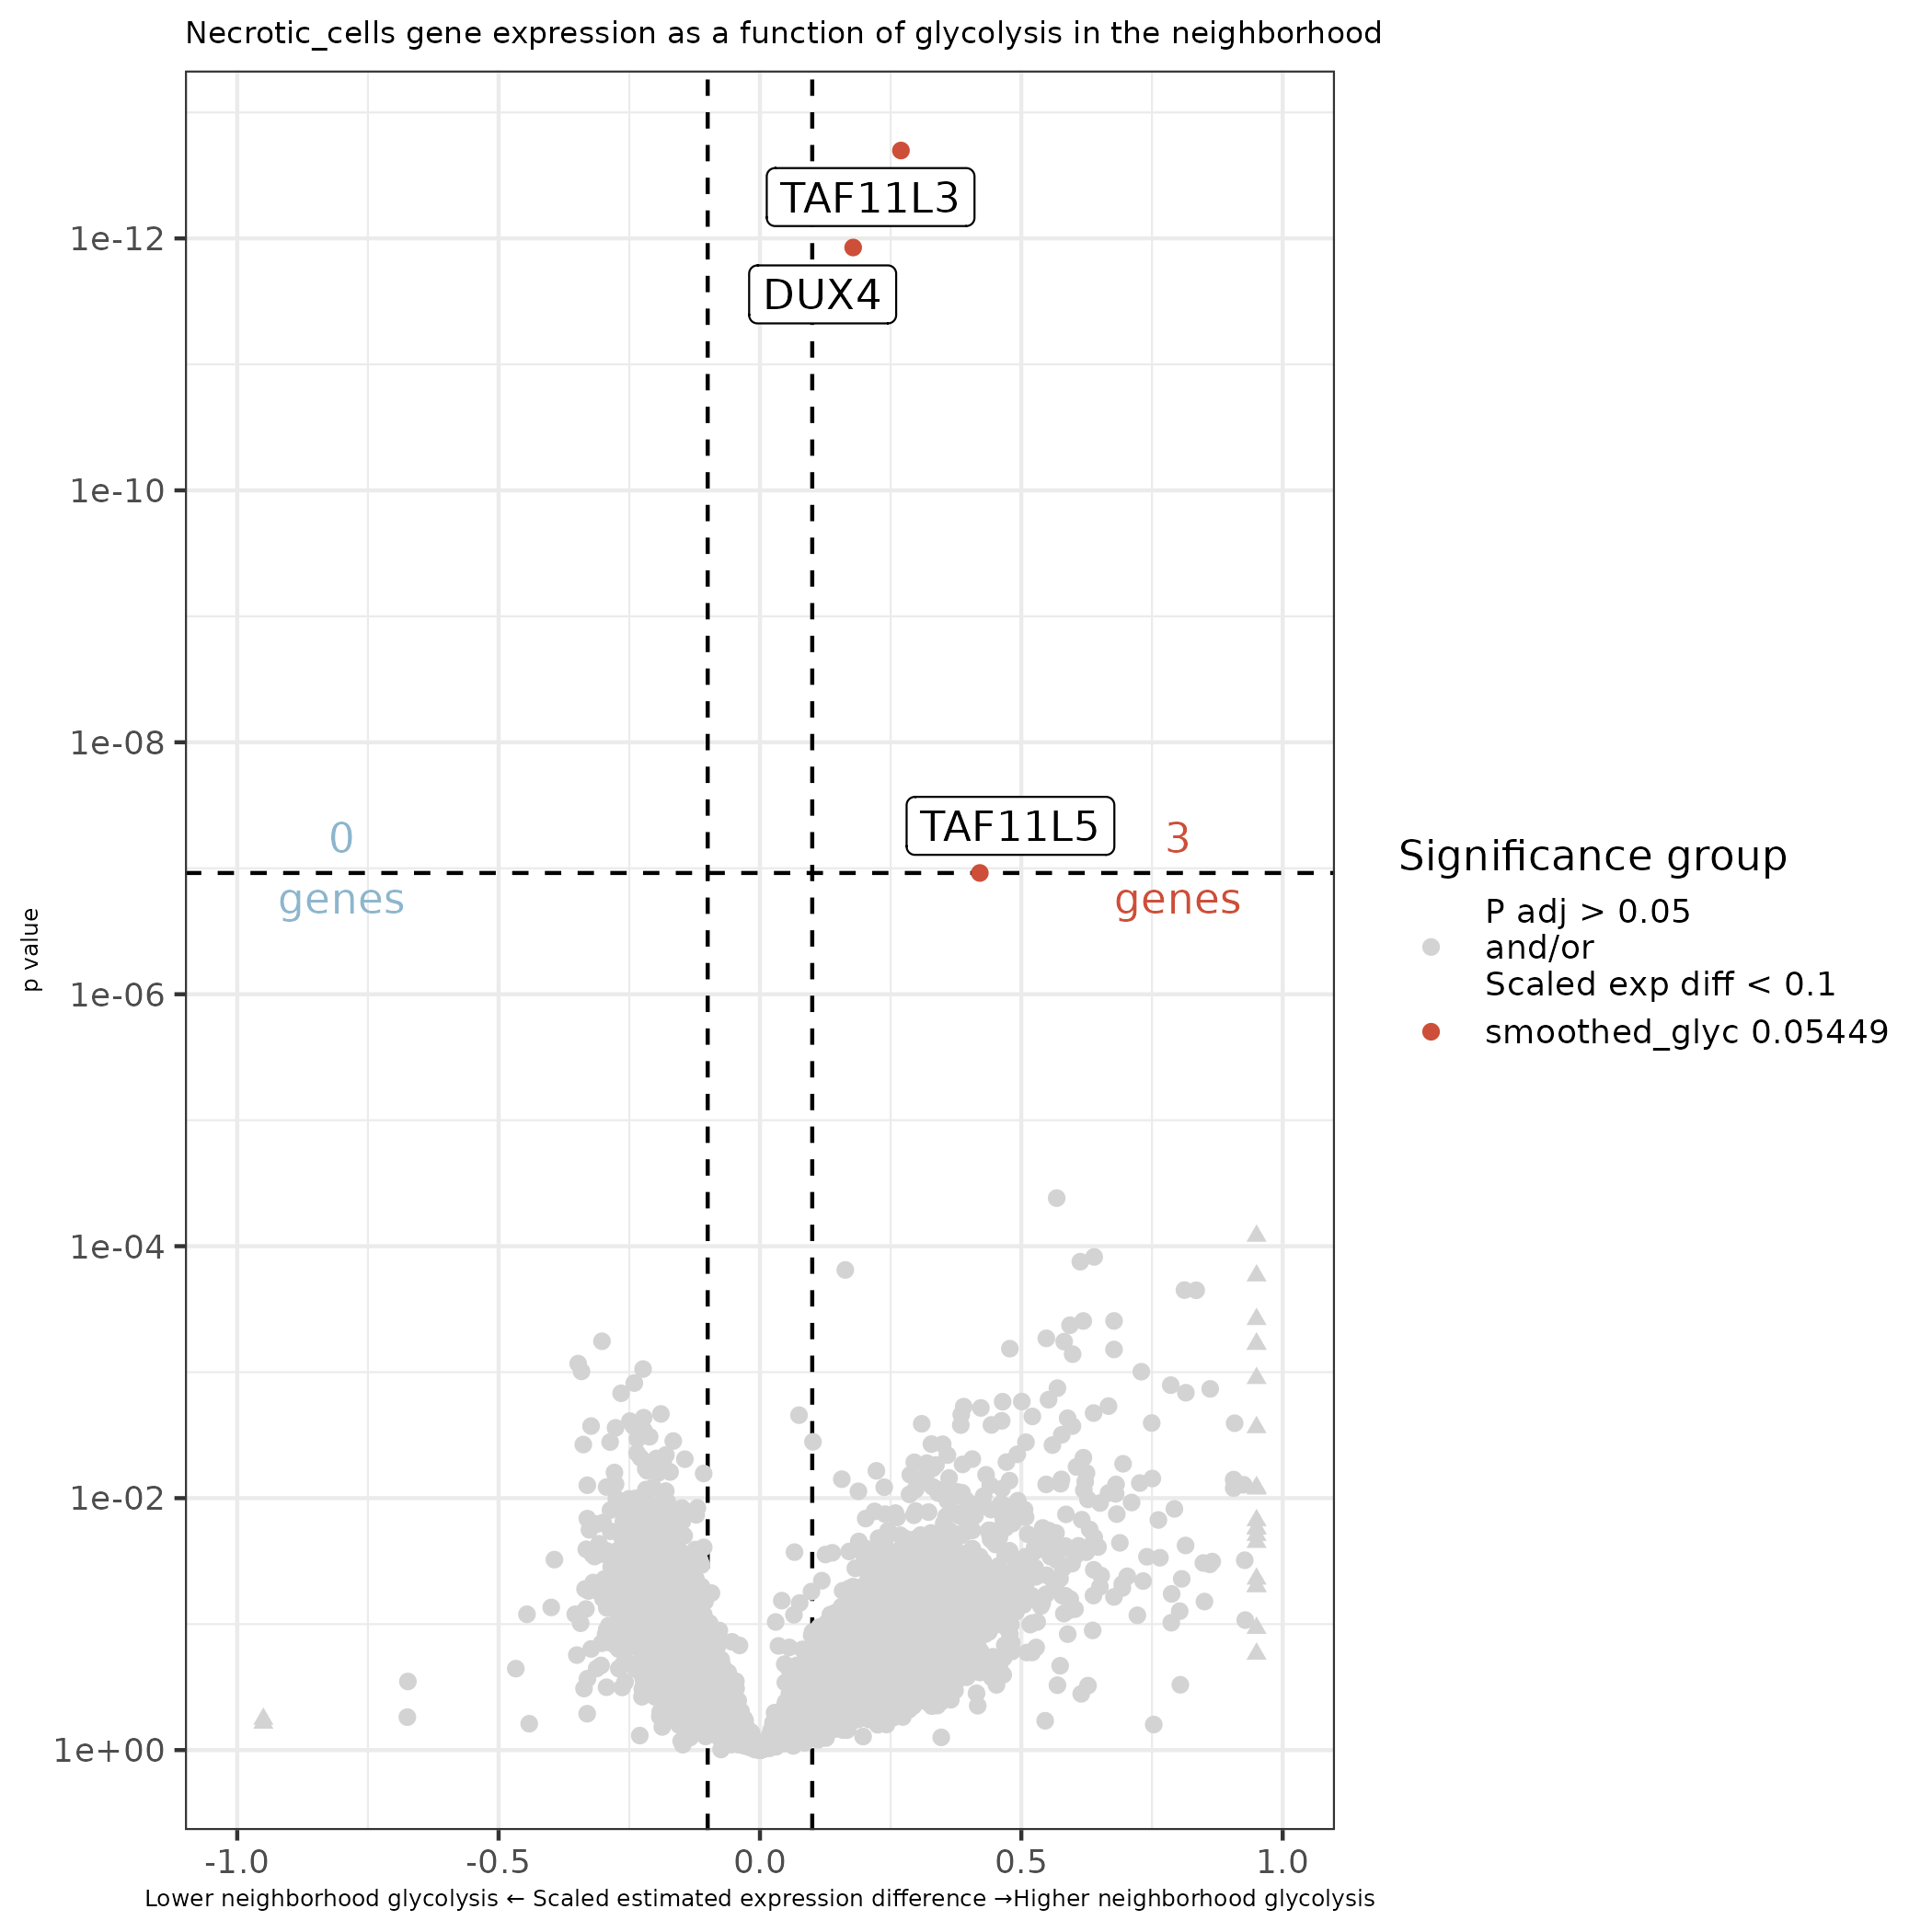
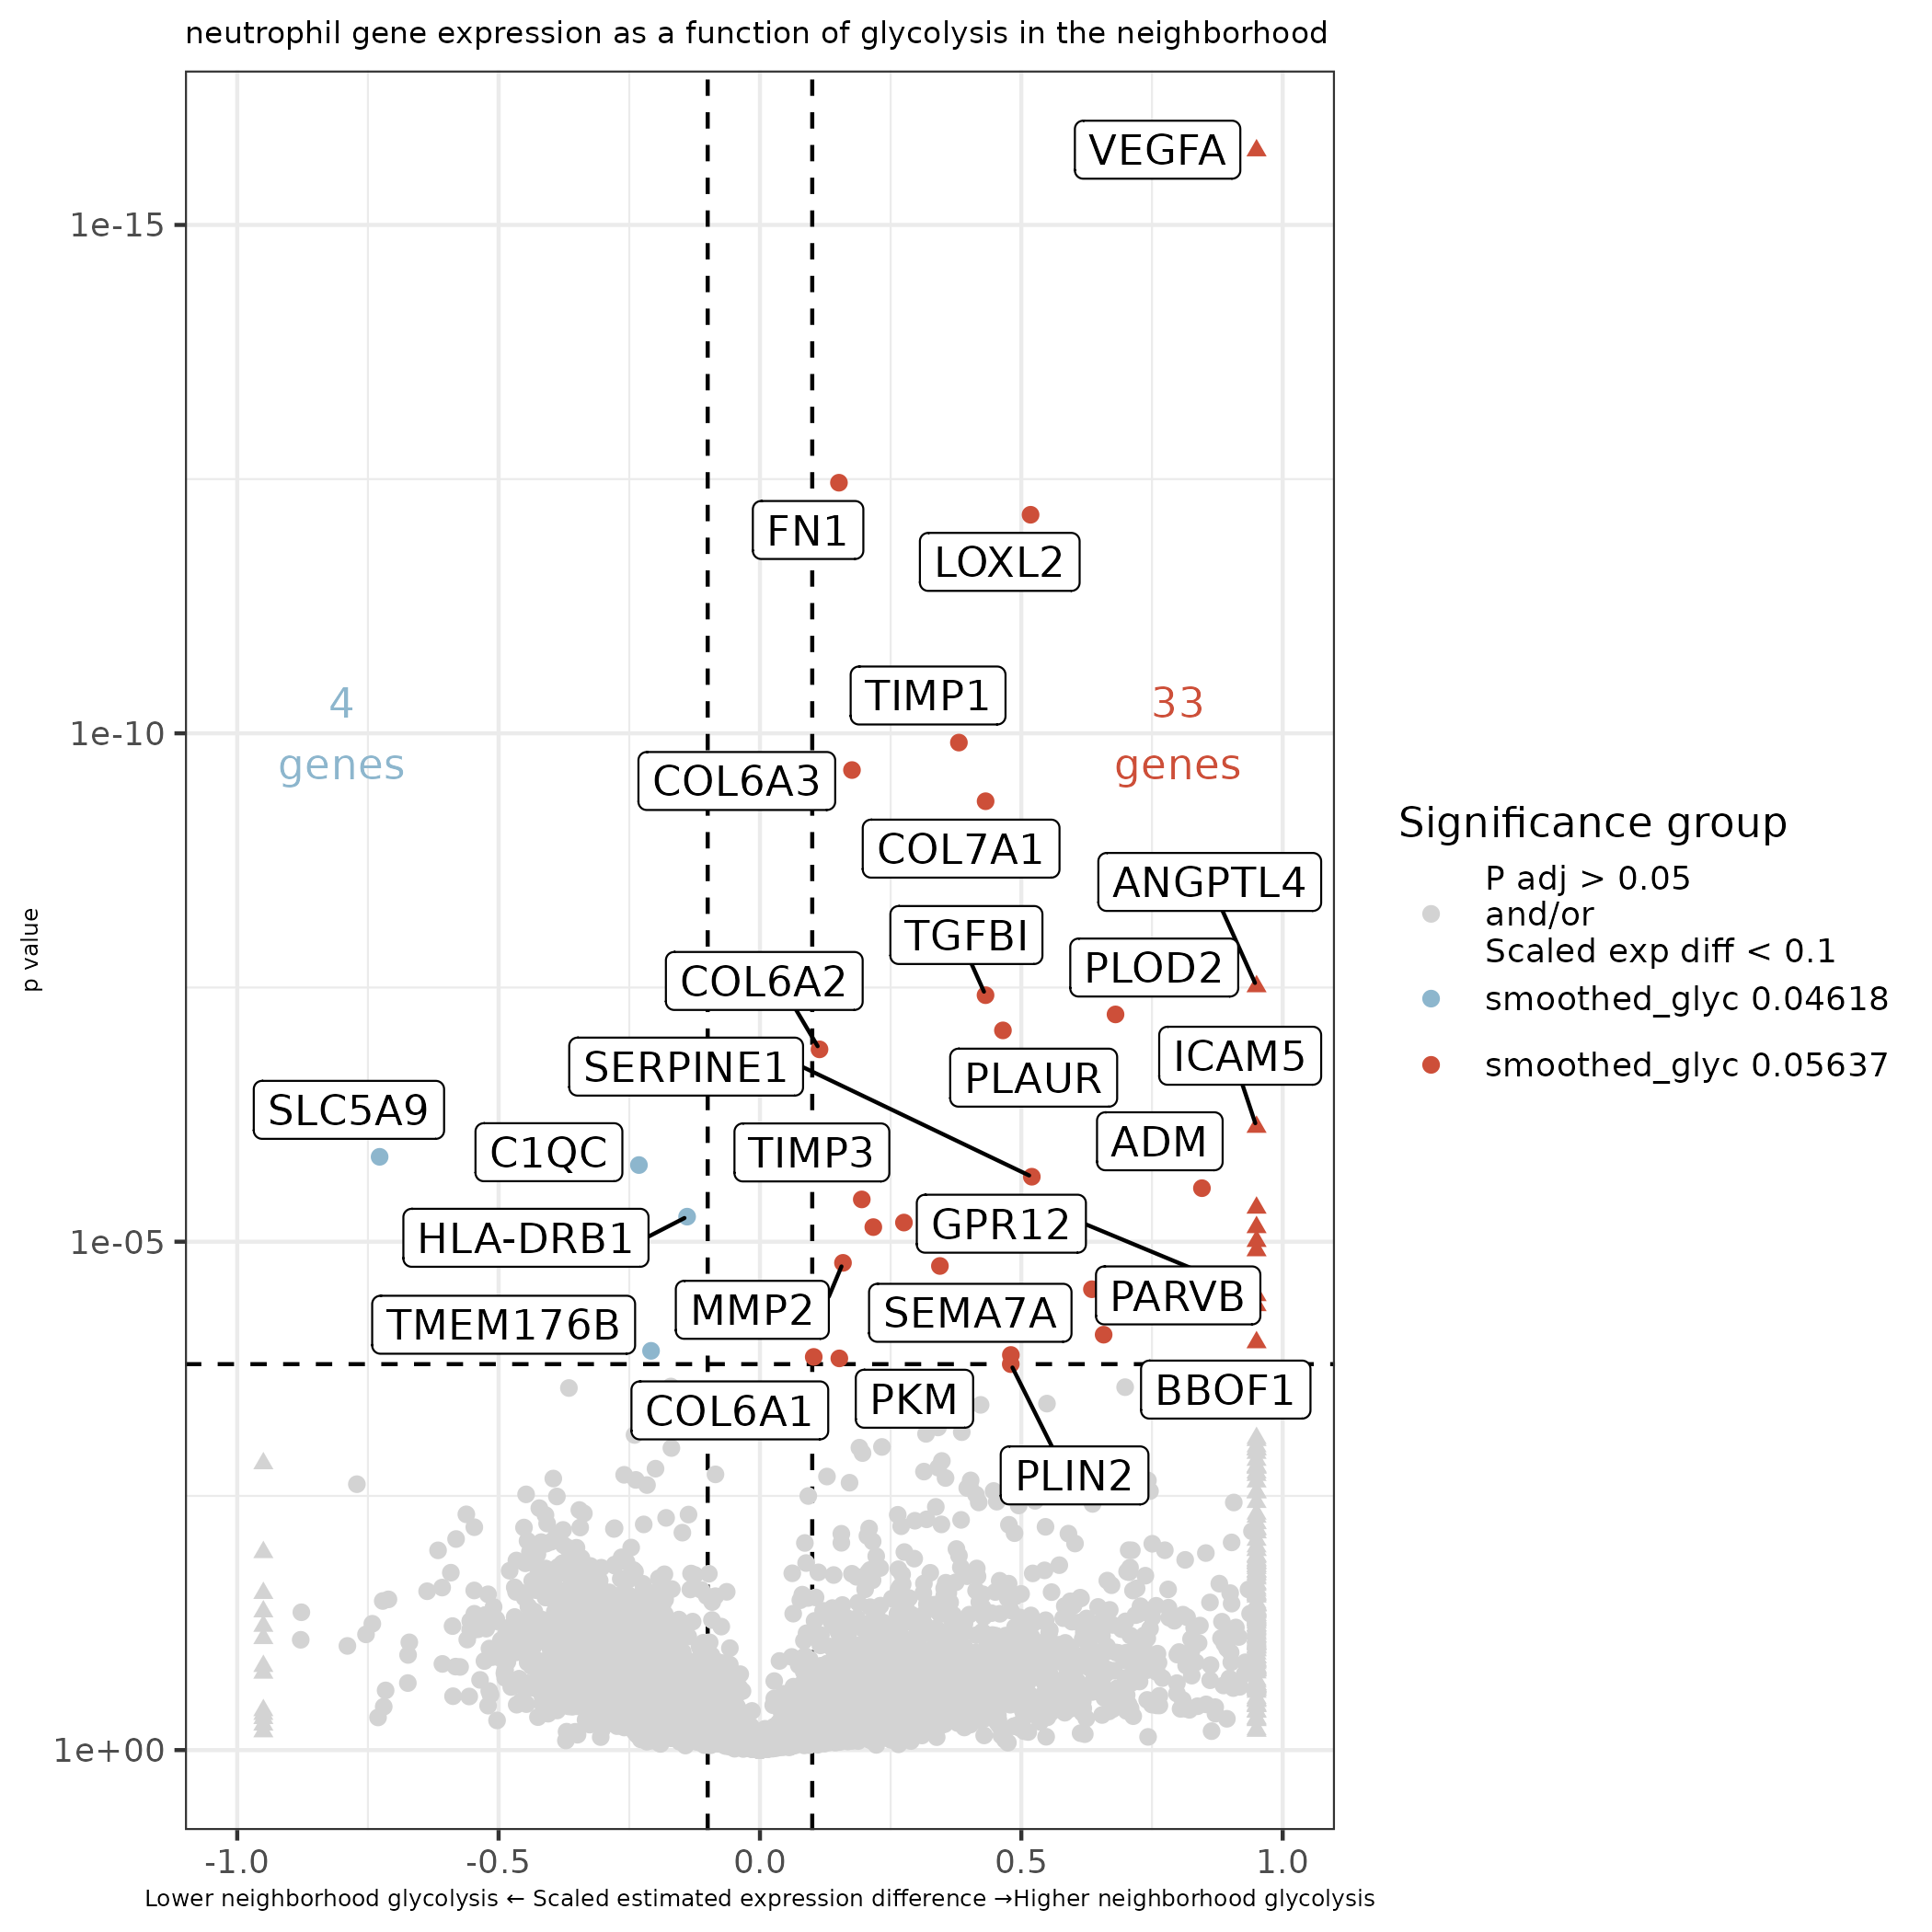
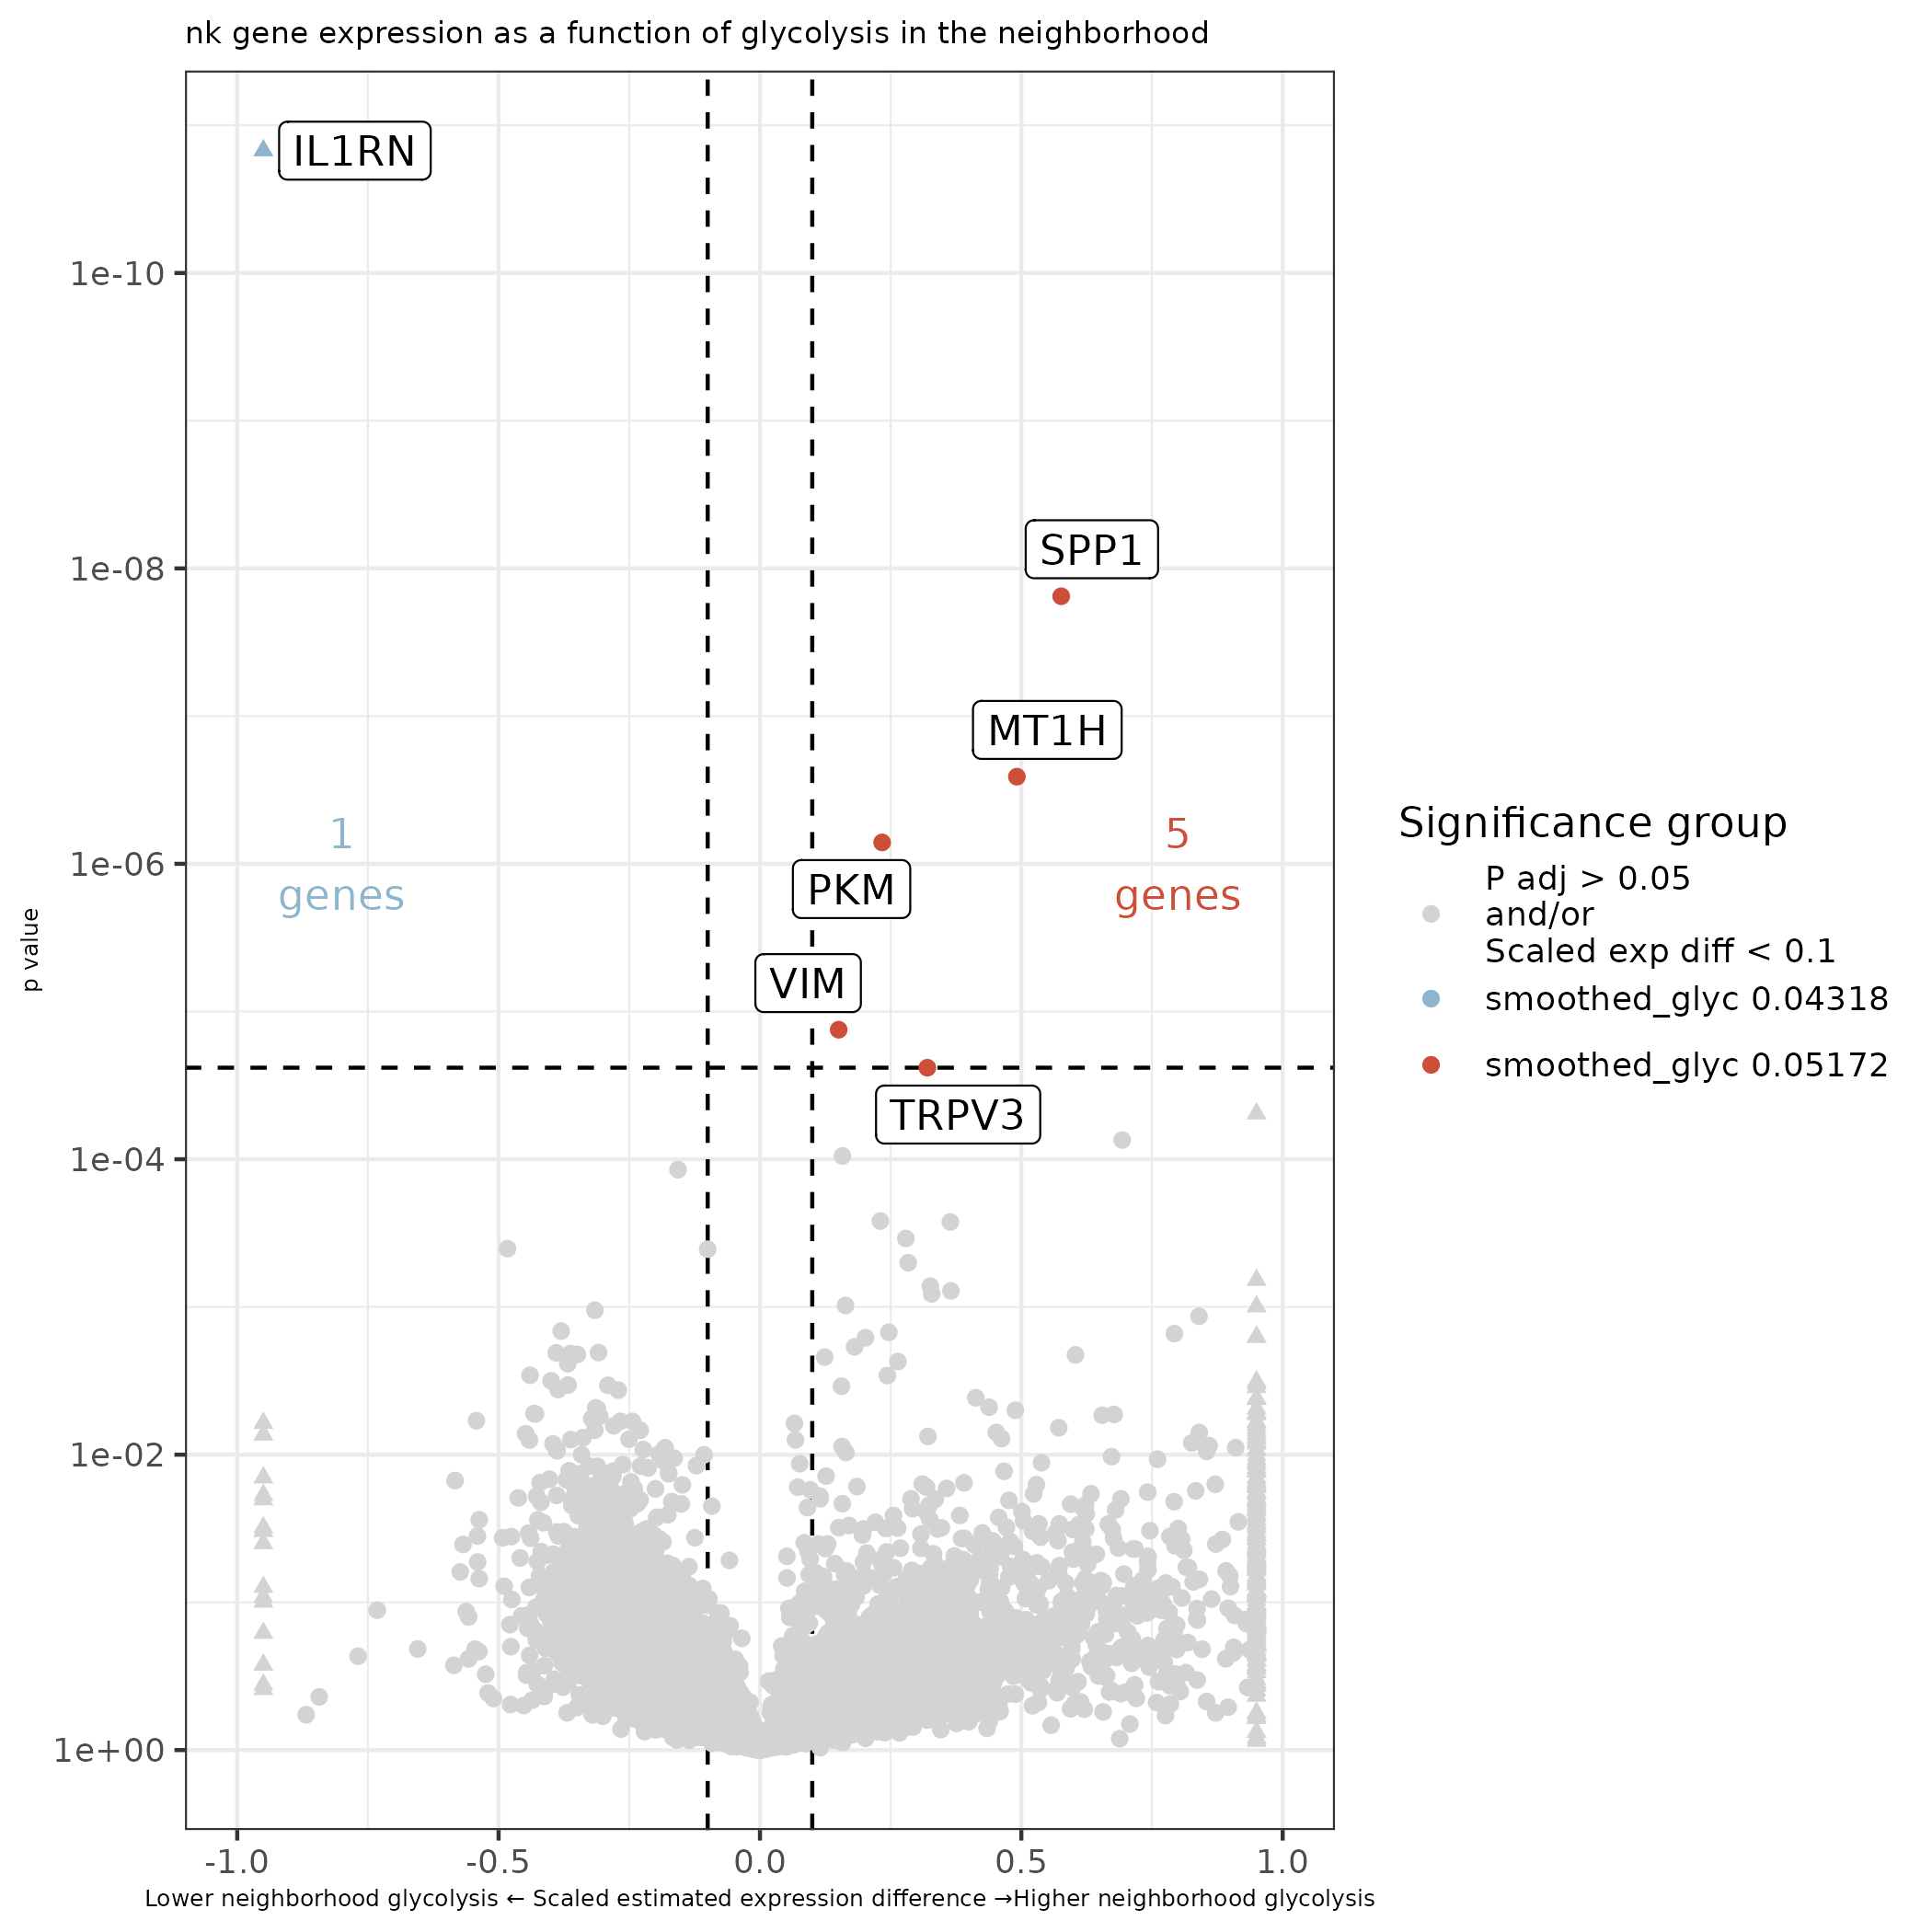
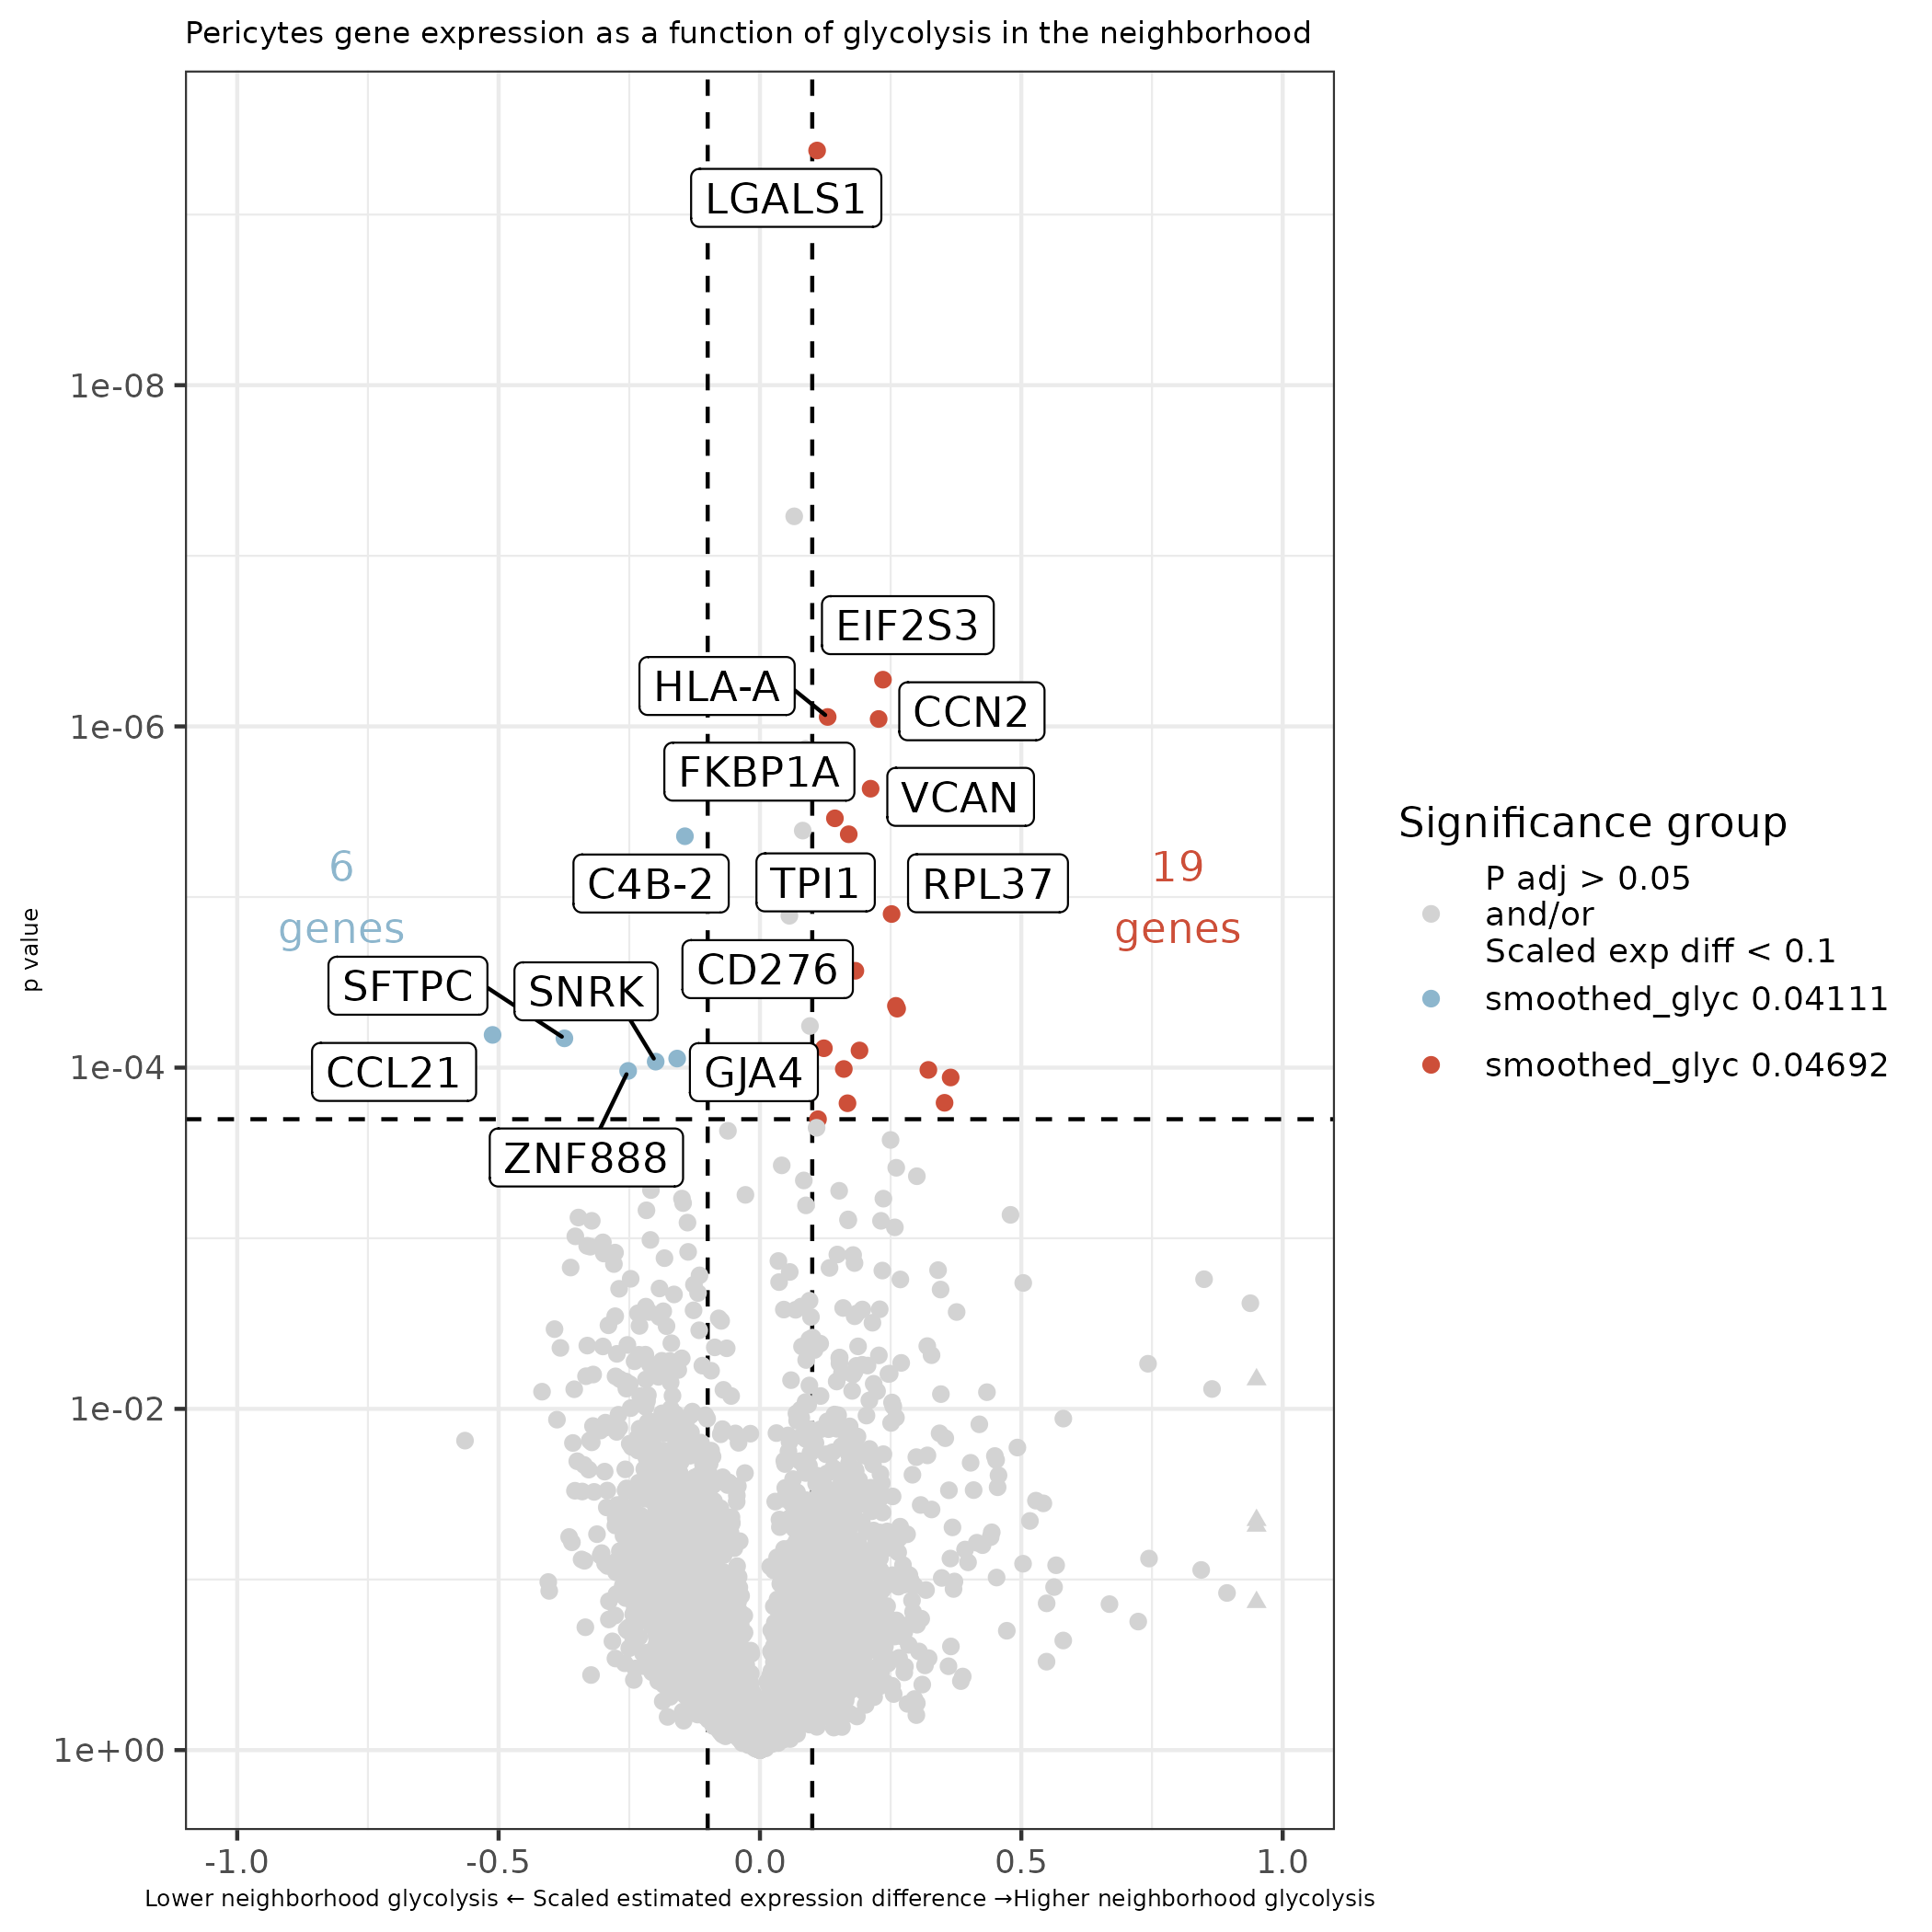
In this section we focus on glycolysis and the impact of the surrounding glycolytic environment on gene expression.
7.1 Smoothed glycolysis pathway scores
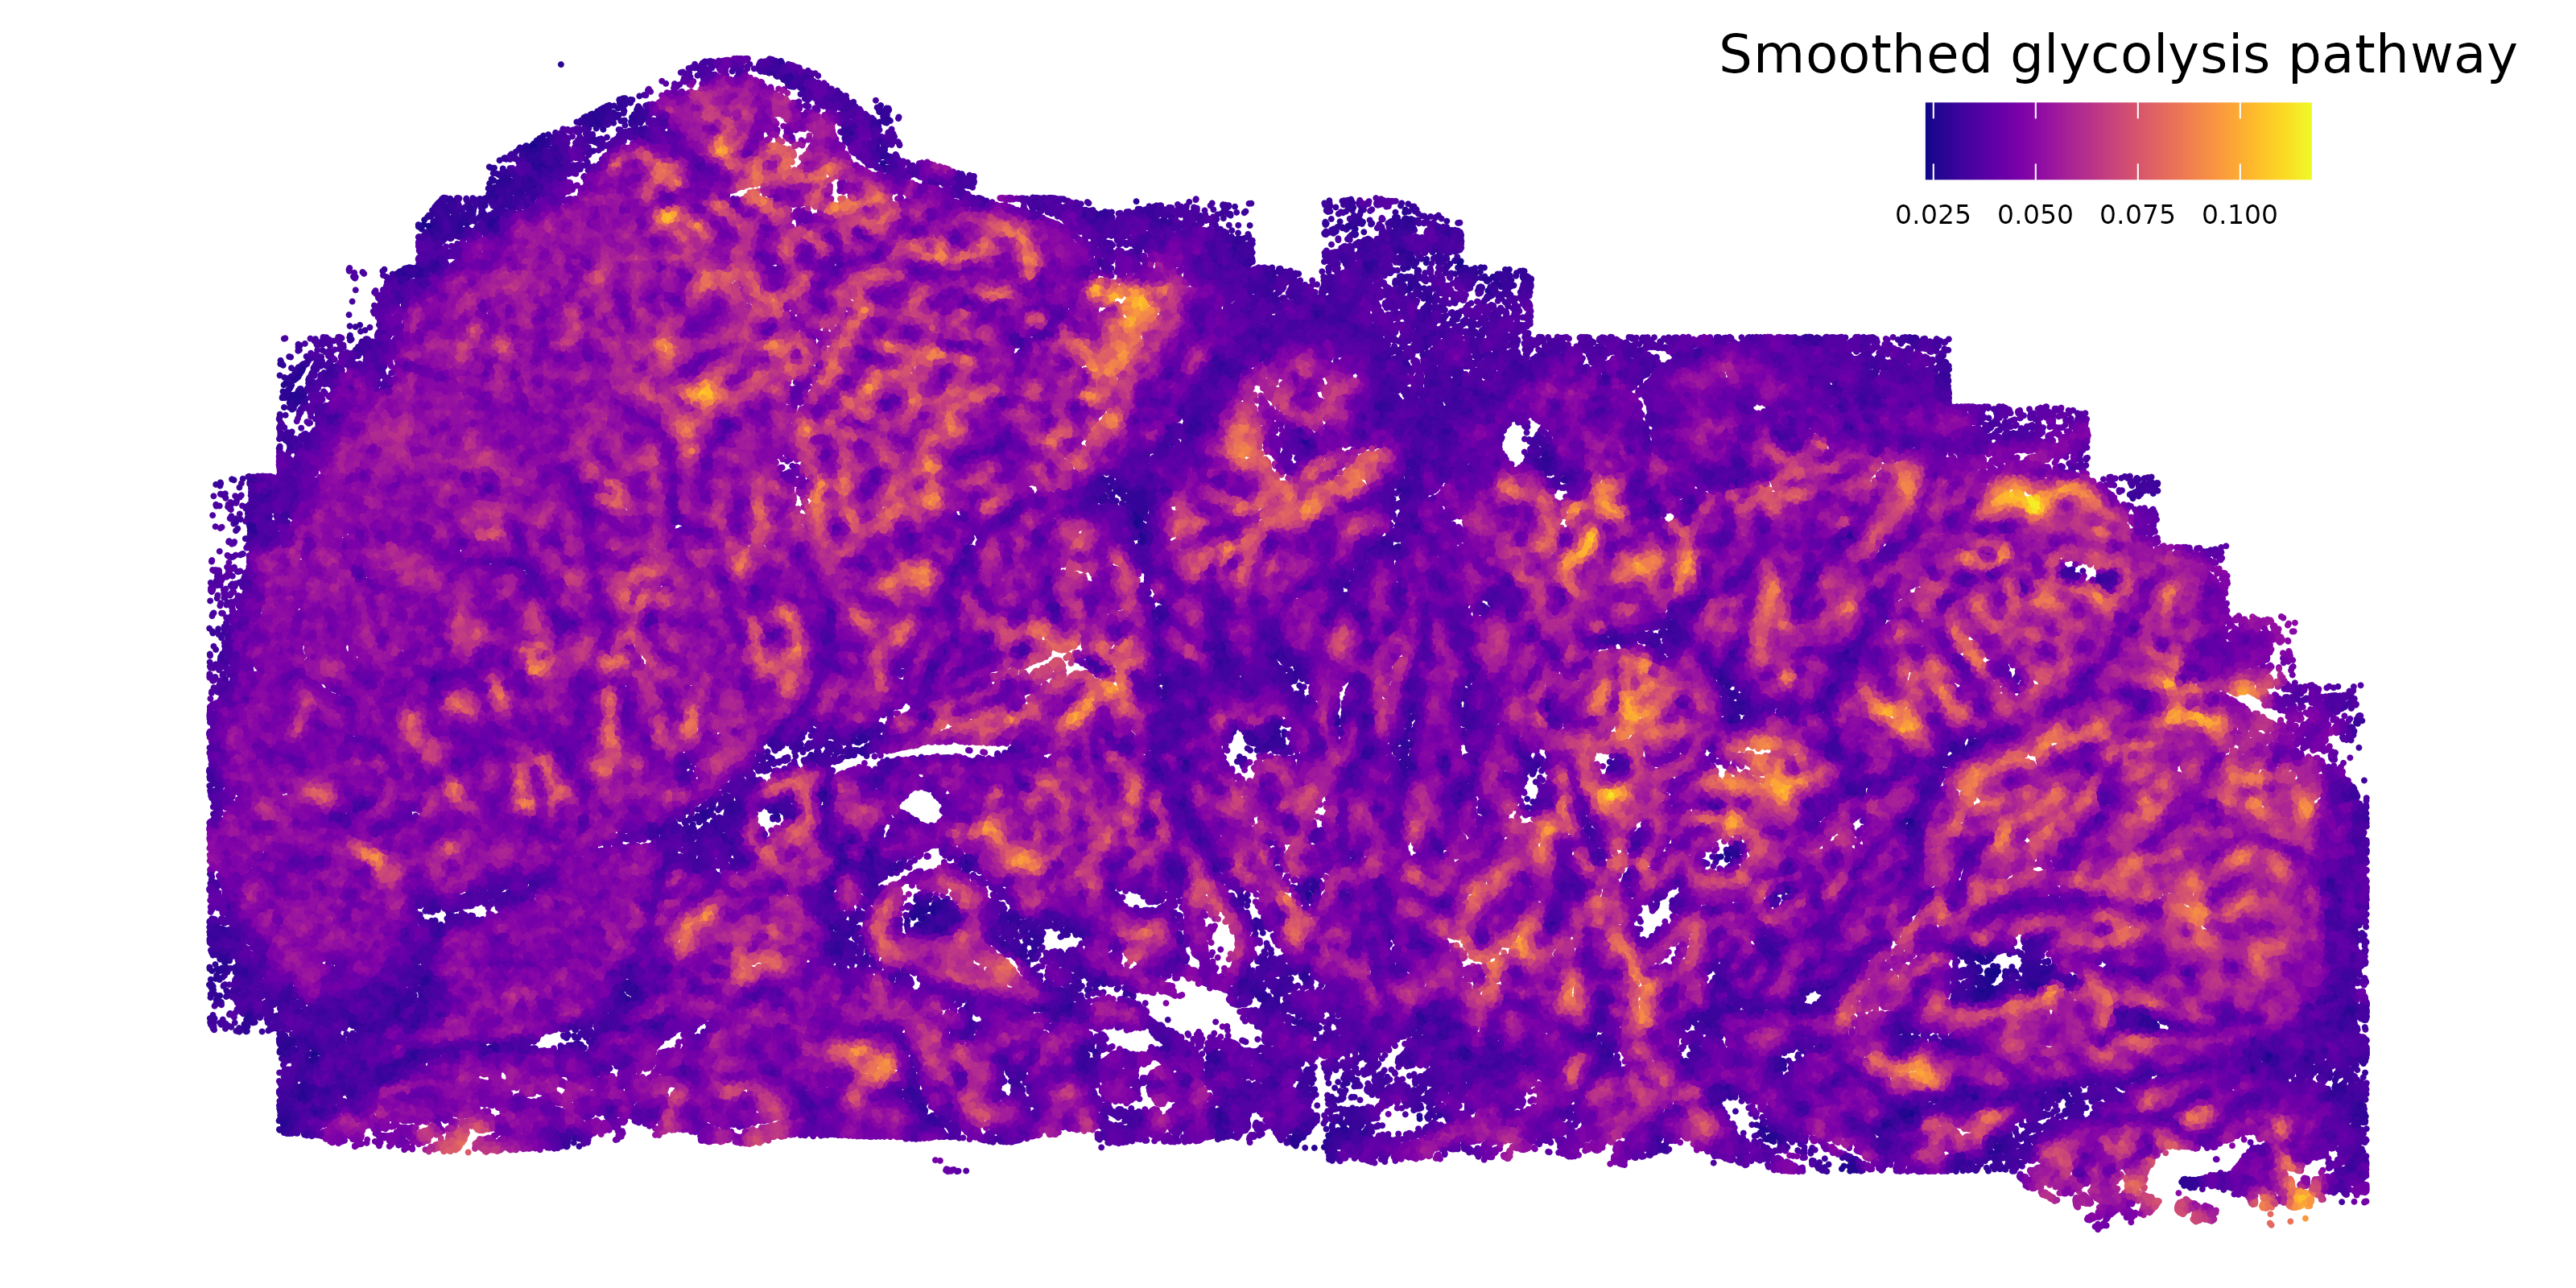
We start by looking at glycolysis in space. We use pathway calculations from AUCell to generate glycolysis pathway scores for every cellular neighborhood.
Show the code
# if there's no seurat object, read it inif (!("seu.obj"%in%ls())){ seu.obj <-readRDS(results_list$seurat_file_postCellTyping)}# Read in AUCell resultscells_auc_full <-readRDS(paste0(pathway_dir, "/Data/cellsAUC_full.rds"))# Extract glycolysis pathway scoresglyc <- cells_auc_full["REACTOME_GLYCOLYSIS",]meta <- seu.obj@meta.datameta$glyc <- glyc[meta$cell_ID]# total expression by cell type:sumglyc <-by(meta$glyc, meta$major_cell_type, sum)sumglyc["Tumor"] /sum(sumglyc)# Calculate smoothed neighborhood expressionxy <- seu.obj@meta.data[,c("x_slide_mm", "y_slide_mm")]xy$cell_ID <-rownames(xy)# Use a smoothing function modified from https://nanostring-biostats.github.io/CosMx-Analysis-Scratch-Space/posts/marker-gene-smoothing/xy_nn <-function(xy, n_neighbors=50){ xy <-as.data.table(xy)## identify nearest n_neighbors (+1 includes the cell as a neighbor to itself) nn_xy <- RANN::nn2(xy[,.(x_slide_mm, y_slide_mm)],k = n_neighbors +1)$nn.idx nn_xy <- data.table::melt(cbind(xy[,.(cell_ID)], data.table(nn_xy)) , id.vars=c("cell_ID", "V1"))colnames(nn_xy) <-c("cell_ID1", "cell_ID1_idx", "neighbor", "cell_ID2_idx") nn_xy <-merge(nn_xy , nn_xy[,.(cell_ID2=cell_ID1, cell_ID2_idx=cell_ID1_idx)][ ,unique(.SD)],by="cell_ID2_idx")## Cell x cell neighbor indicator matrix wxy <- Matrix::sparseMatrix(i =c(unique(nn_xy$cell_ID1_idx), nn_xy$cell_ID2_idx) ,j=c(unique(nn_xy$cell_ID1_idx), nn_xy$cell_ID1_idx) ,x=1)rownames(wxy) <-colnames(wxy) <- nn_xy[order(nn_xy$cell_ID1_idx),unique(cell_ID1)]## Column standardize, so that columns (cells) sum to 1, and each neighbor given equal weight. mxy <- Matrix::sparseMatrix(i=1:ncol(wxy) ,j=1:ncol(wxy) ,x=1/Matrix::colSums(wxy) )dimnames(mxy) <-dimnames(wxy) smoother <- mxy %*% wxy smoother <- smoother[,xy$cell_ID]return(smoother)}# Smoothed glycolysis pathwaysmoother <-xy_nn(xy)smoothed_glyc <- meta[,"glyc"] %*% smoother# Save this smoothed glycolysis pathway scoresaveRDS(smoothed_glyc, file =paste0(metabolism_dir, "/Data/xy_smoothed_glycolysis.rds"))# Plot smoothed glycolysis in spacemeta$smoothed_glyc <- smoothed_glyc[1,]ggplot(meta, aes(x = y_slide_mm, y =-x_slide_mm, # Plotting on its sidecolor = smoothed_glyc)) +geom_point(size =0.01) +scale_color_viridis(option ="plasma", name ="Smoothed glycolysis pathway") +coord_fixed() +theme_void() +theme(legend.position =c(0.85, 0.9), legend.direction ="horizontal", legend.title.position ="top",legend.text =element_text(size =6),legend.title =element_text(hjust =0.5, size =12))ggsave(filename =paste0(metabolism_dir, "/Plots/XY_smoothed_glycolysis.png"),width =8, height =4, units ="in", dpi =400)
Here is the smoothed glycolysis pathway in space. Enrichment is prominent throughout the tumor.
7.2 Differential expression as a function of neighborhood glycolysis
Here we run DE on every cell type to try to understand how every cell type changes as a function of glycolysis levels in the neighborhood it finds itself in. The prediction is that we might find some genes that are consistently up or down regulated across all or many cell types. This might also point us towards cell types that are more or less responsive / susceptible to the surrounding glycolysis environment. As additional factors in our model, we also include niche and the number of each tumor cell type in the 50 nearest neighbors. For speed in making this many comparisons, we work with normalized counts and a gaussian model.
Show the code
if (!("seu.obj"%in%ls())){ seu.obj <-readRDS(results_list$seurat_file_postCellTyping)}## Isolate meta data and add neighborhood glycolysis activitymeta <- seu.obj@meta.datasmoothed_glyc <-readRDS(file =paste0(metabolism_dir, "/Data/xy_smoothed_glycolysis.rds"))meta$smoothed_glyc <- smoothed_glyc[1,meta$cell_id]# Add number of each type of tumor cell in 50 nearest neighborscoords <-as.matrix(meta[, c("x_slide_mm", "y_slide_mm")])K <-50idx <- FNN::get.knn(coords, k = K)$nn.index # (N x K), self is not included here# Count cells in neighborhoodtypes <-as.character(meta$minor_cell_type)targets <-c("LUM+ tumor","HPD+ tumor","PGC+ tumor","KRT16+ tumor","Proliferating tumor")neighbor_counts <-lapply(targets, function(lbl) { is_target <- (types == lbl) mat <-matrix(is_target[idx], nrow =nrow(idx), ncol =ncol(idx))rowSums(mat)})names(neighbor_counts) <- targetsmeta$neighboring_lum <- neighbor_counts[["LUM+ tumor"]]meta$neighboring_hpd <- neighbor_counts[["HPD+ tumor"]]meta$neighboring_pgc <- neighbor_counts[["PGC+ tumor"]]meta$neighboring_krt <- neighbor_counts[["KRT16+ tumor"]]meta$neighboring_prol <- neighbor_counts[["Proliferating tumor"]]# Add novae domainnovae_9 <-readRDS(paste0(niche_dir, "/Data/novae_domains_9_assignments.rds"))meta$novae <- novae_9[rownames(meta)]## Prep pre-de files that are conserved across cell types# Pre-de find neighborspre_de_obj <-pre_de(metadata = meta,cell_type_metadata_colname ="minor_cell_type",mm_radius =0.05,sdimx_colname ="x_slide_mm",sdimy_colname ="y_slide_mm",verbose =TRUE)# Save pre-de resultssaveRDS(pre_de_obj, file =paste0(metabolism_dir, "/Data/pre_de_obj.rds"))# Run overlap filteroverlap_metrics <-overlap_ratio_metric(assay_matrix = seu.obj@assays$RNA$data,metadata = meta,cluster_col ="minor_cell_type",radius =0.05,sdimx_col ="x_slide_mm",sdimy_col ="y_slide_mm" )# Save overlap metricssaveRDS(overlap_metrics, file =paste0(metabolism_dir, "/Data/overlap_metrics.rds"))# Add total counts to metadata as DE expectsmeta$totalcounts = meta$nCount_RNA# Work with total count normalized datacounts <- seu.obj@assays$RNA$countsscaling_factor <-mean(seu.obj@meta.data$nCount_RNA)norm <- counts %*% Matrix::Diagonal(x = scaling_factor/seu.obj@meta.data$nCount_RNA,names=colnames(counts)) # Iterate through each cell typefor(ct inunique(meta$minor_cell_type)){print(paste0("Starting cell type ", ct, " at ", Sys.time()))# Only analyze genes with overlap ratio less than or equal to 1 analysis_genes <- overlap_metrics[minor_cell_type == ct & ratio <=1]$target# Extract counts for analysis genes only sub_counts <- norm[analysis_genes,]# DE test dependence on neighborhood glycolysis de_obj <- smiDE::smi_de(assay_matrix = sub_counts,metadata = meta[which(meta[,"minor_cell_type"]== ct),],formula =~RankNorm(otherct_expr) + smoothed_glyc + novae + neighboring_lum + neighboring_hpd + neighboring_pgc + neighboring_krt + neighboring_prol,pre_de_obj = pre_de_obj,groupVar ="smoothed_glyc",neighbor_expr_cell_type_metadata_colname ="minor_cell_type",neighbor_expr_totalcount_normalize =FALSE,neighbor_expr_totalcount_scalefactor =NULL,family ="gaussian",targets = analysis_genes,nCores =24 )# Save objectssaveRDS(de_obj, file =paste0(metabolism_dir, "/Data/ct_", gsub("\\+", "", gsub(" ", "_", ct)), "_smoothedGlycolysis_de_obj_plusNicheNeighborTumor.rds"))}
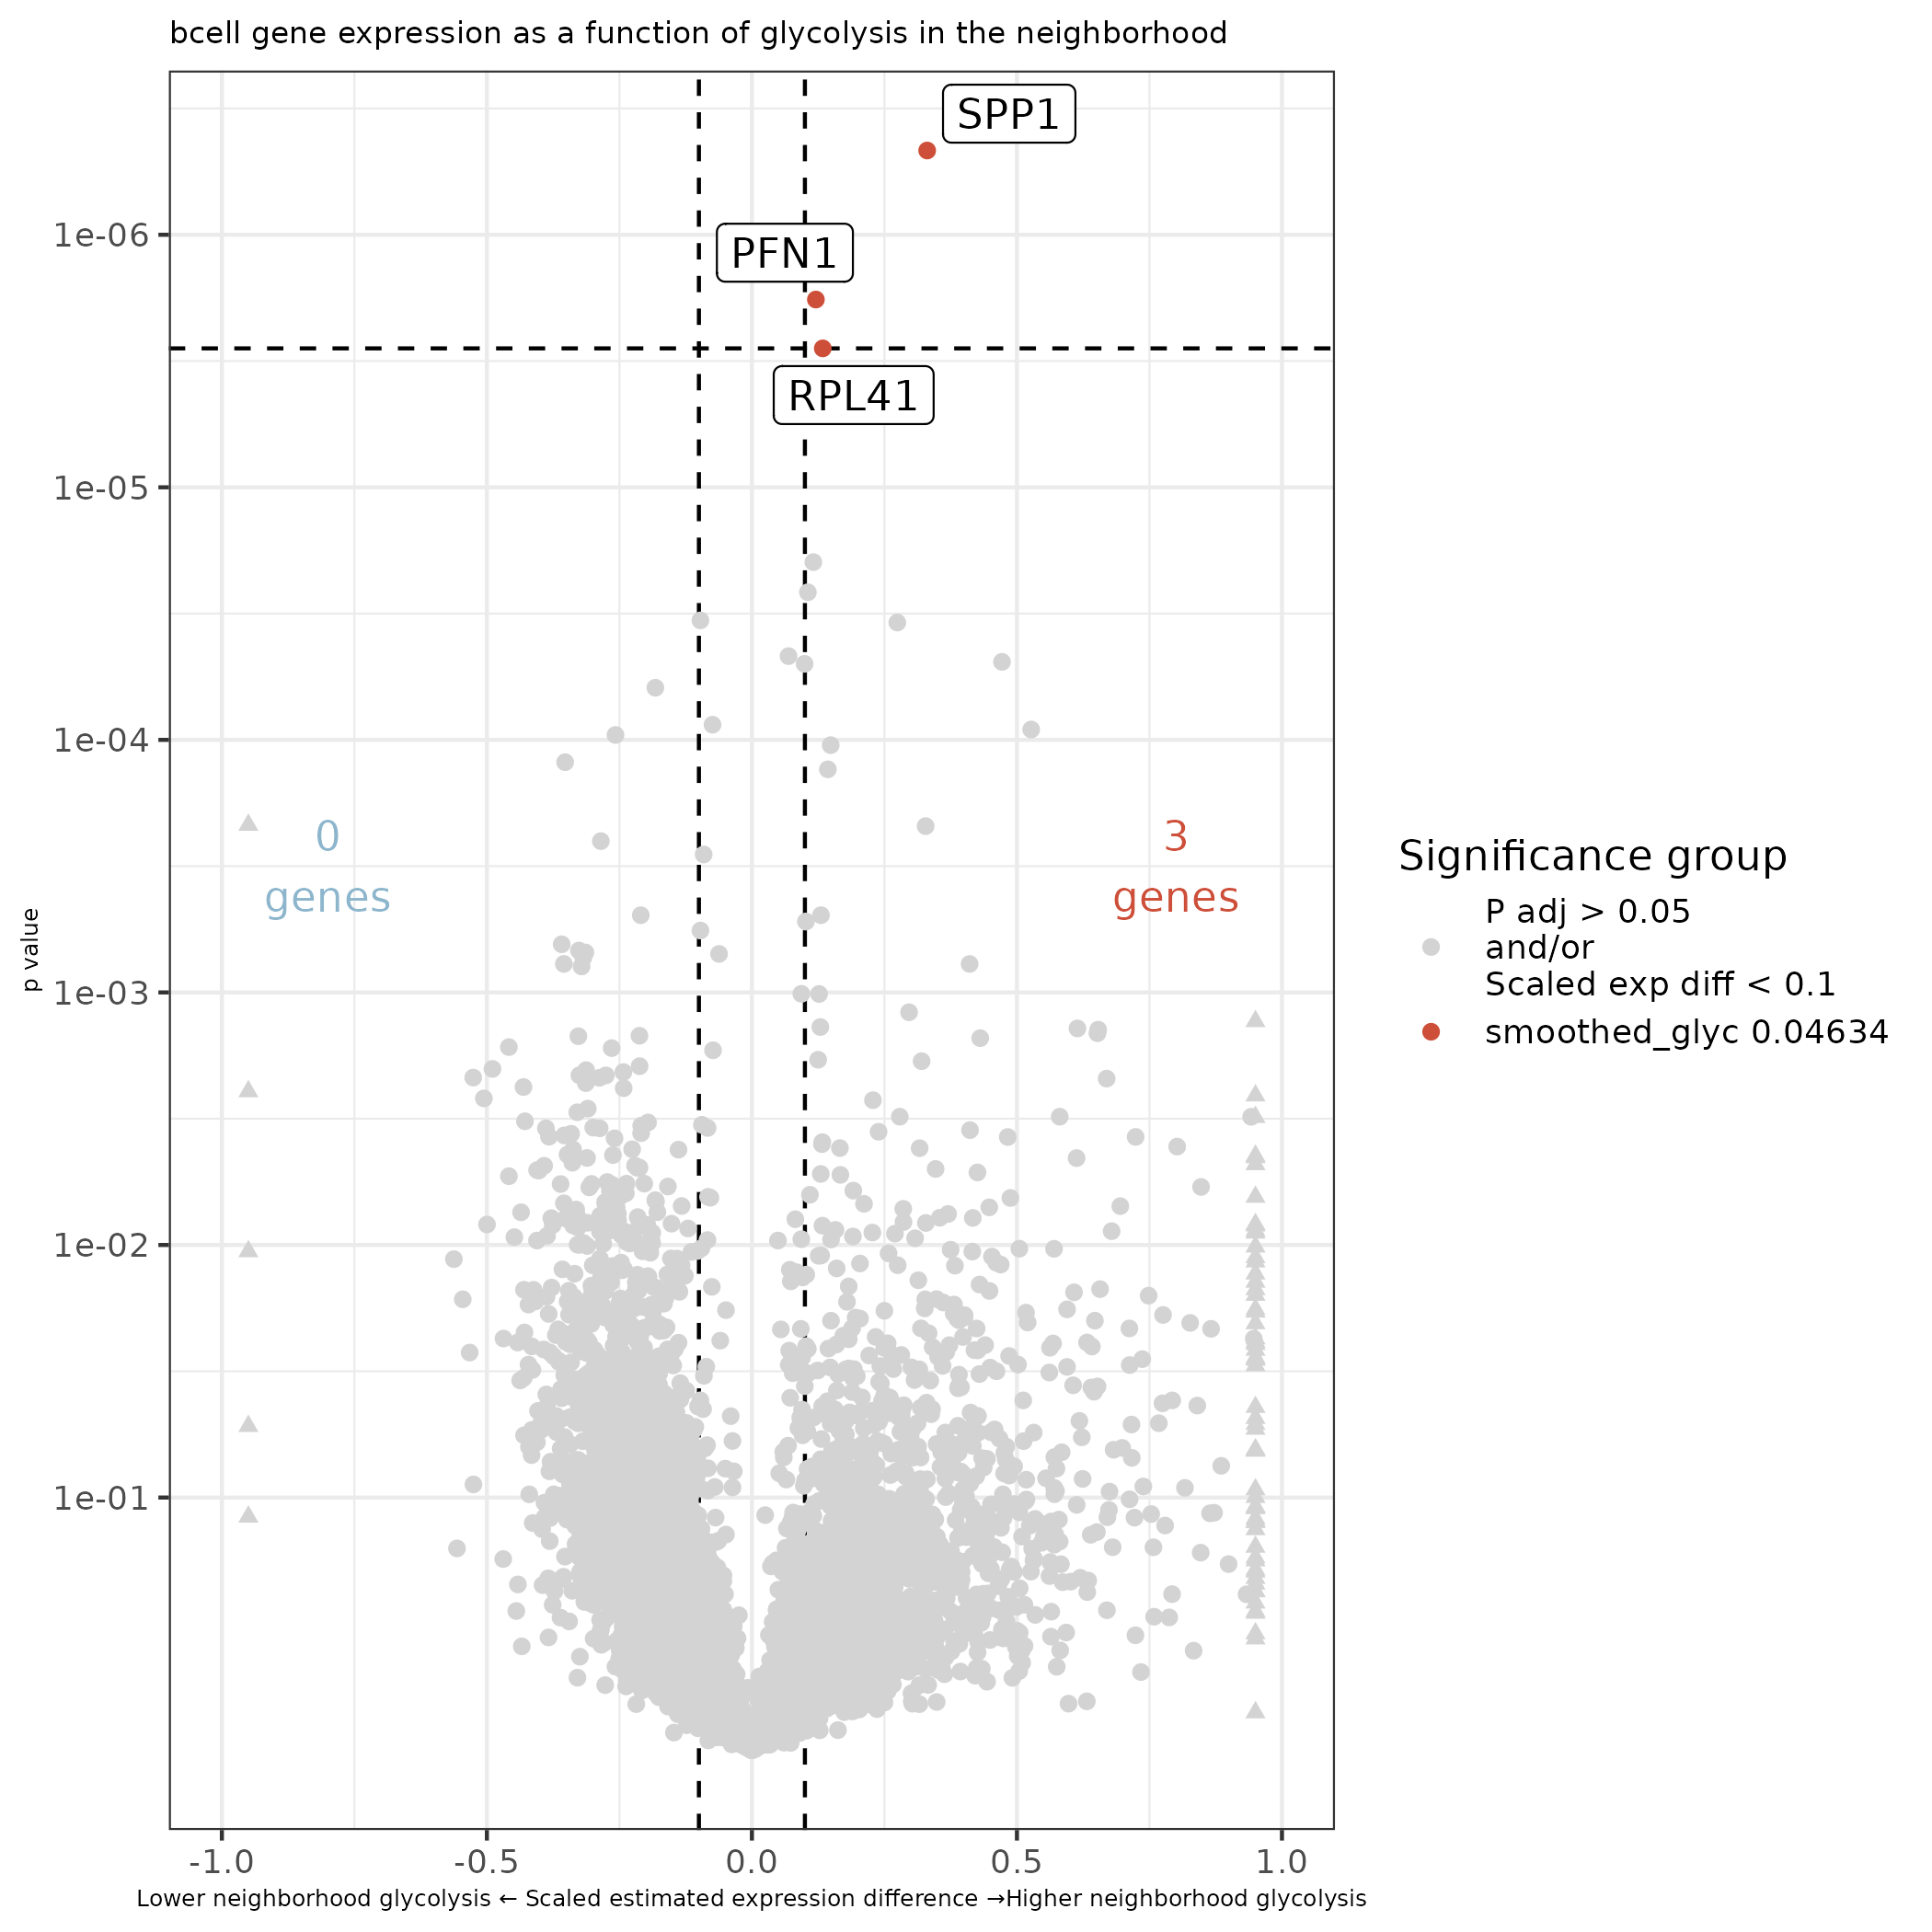
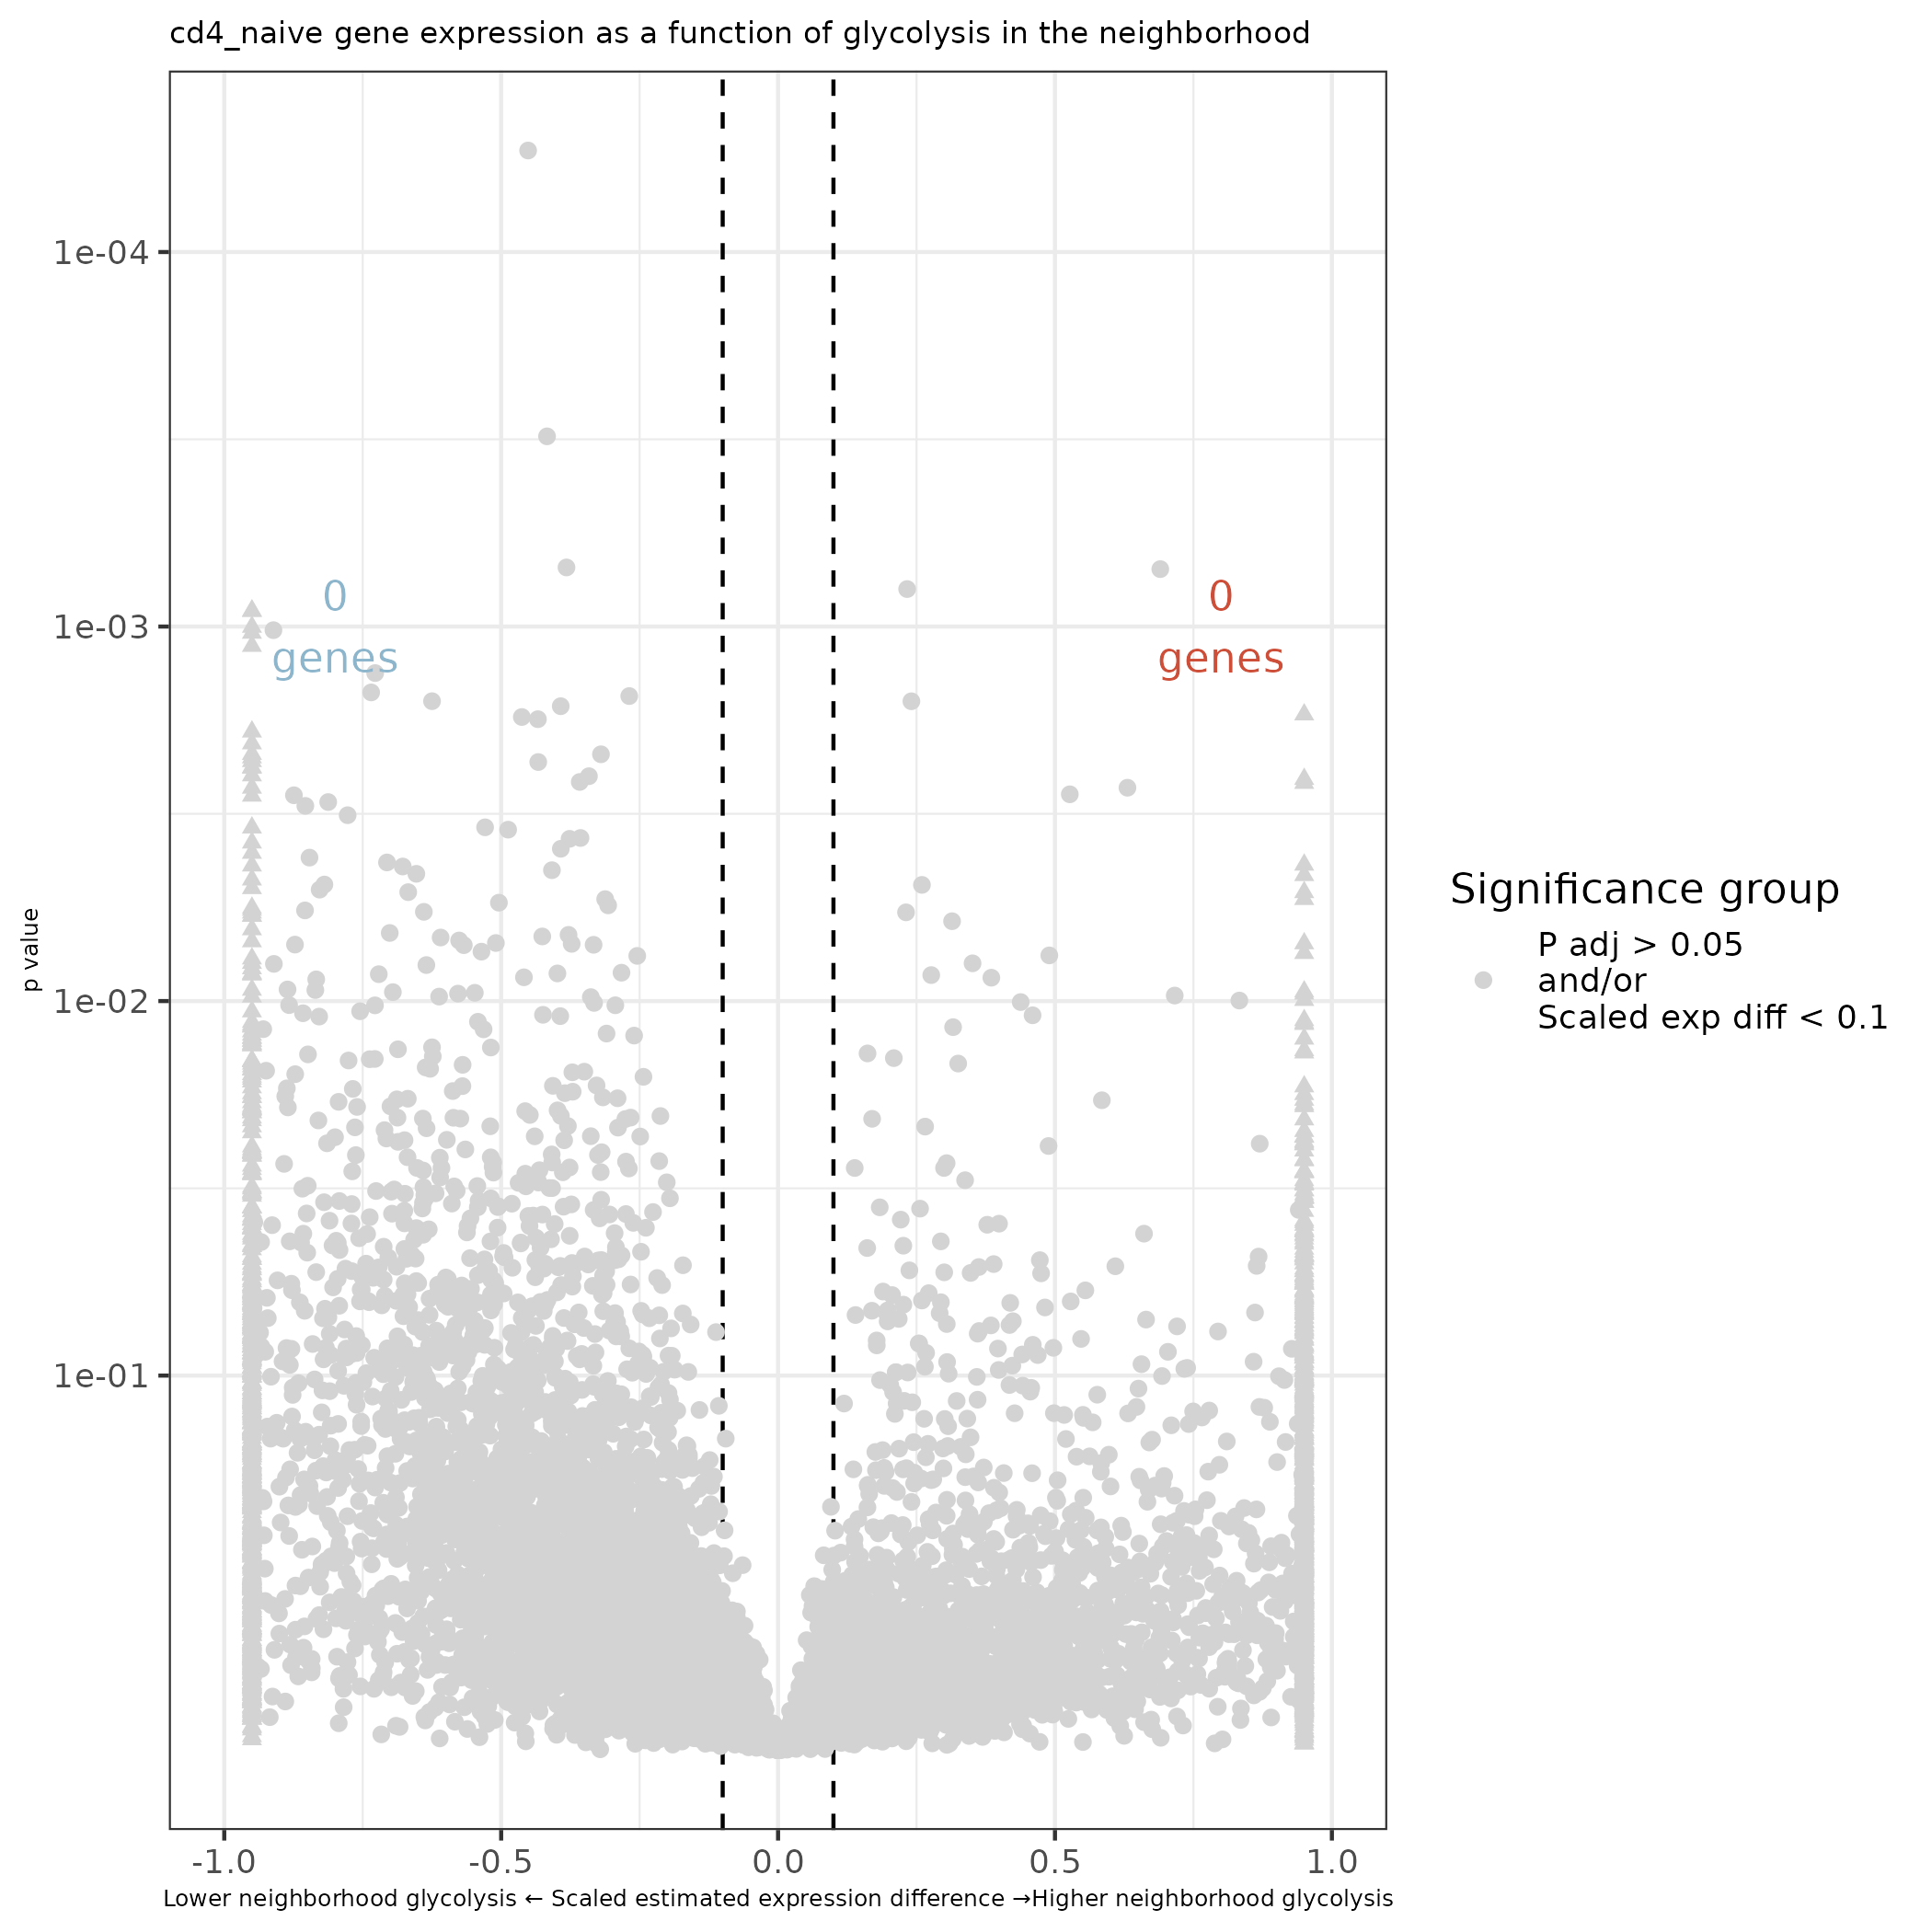
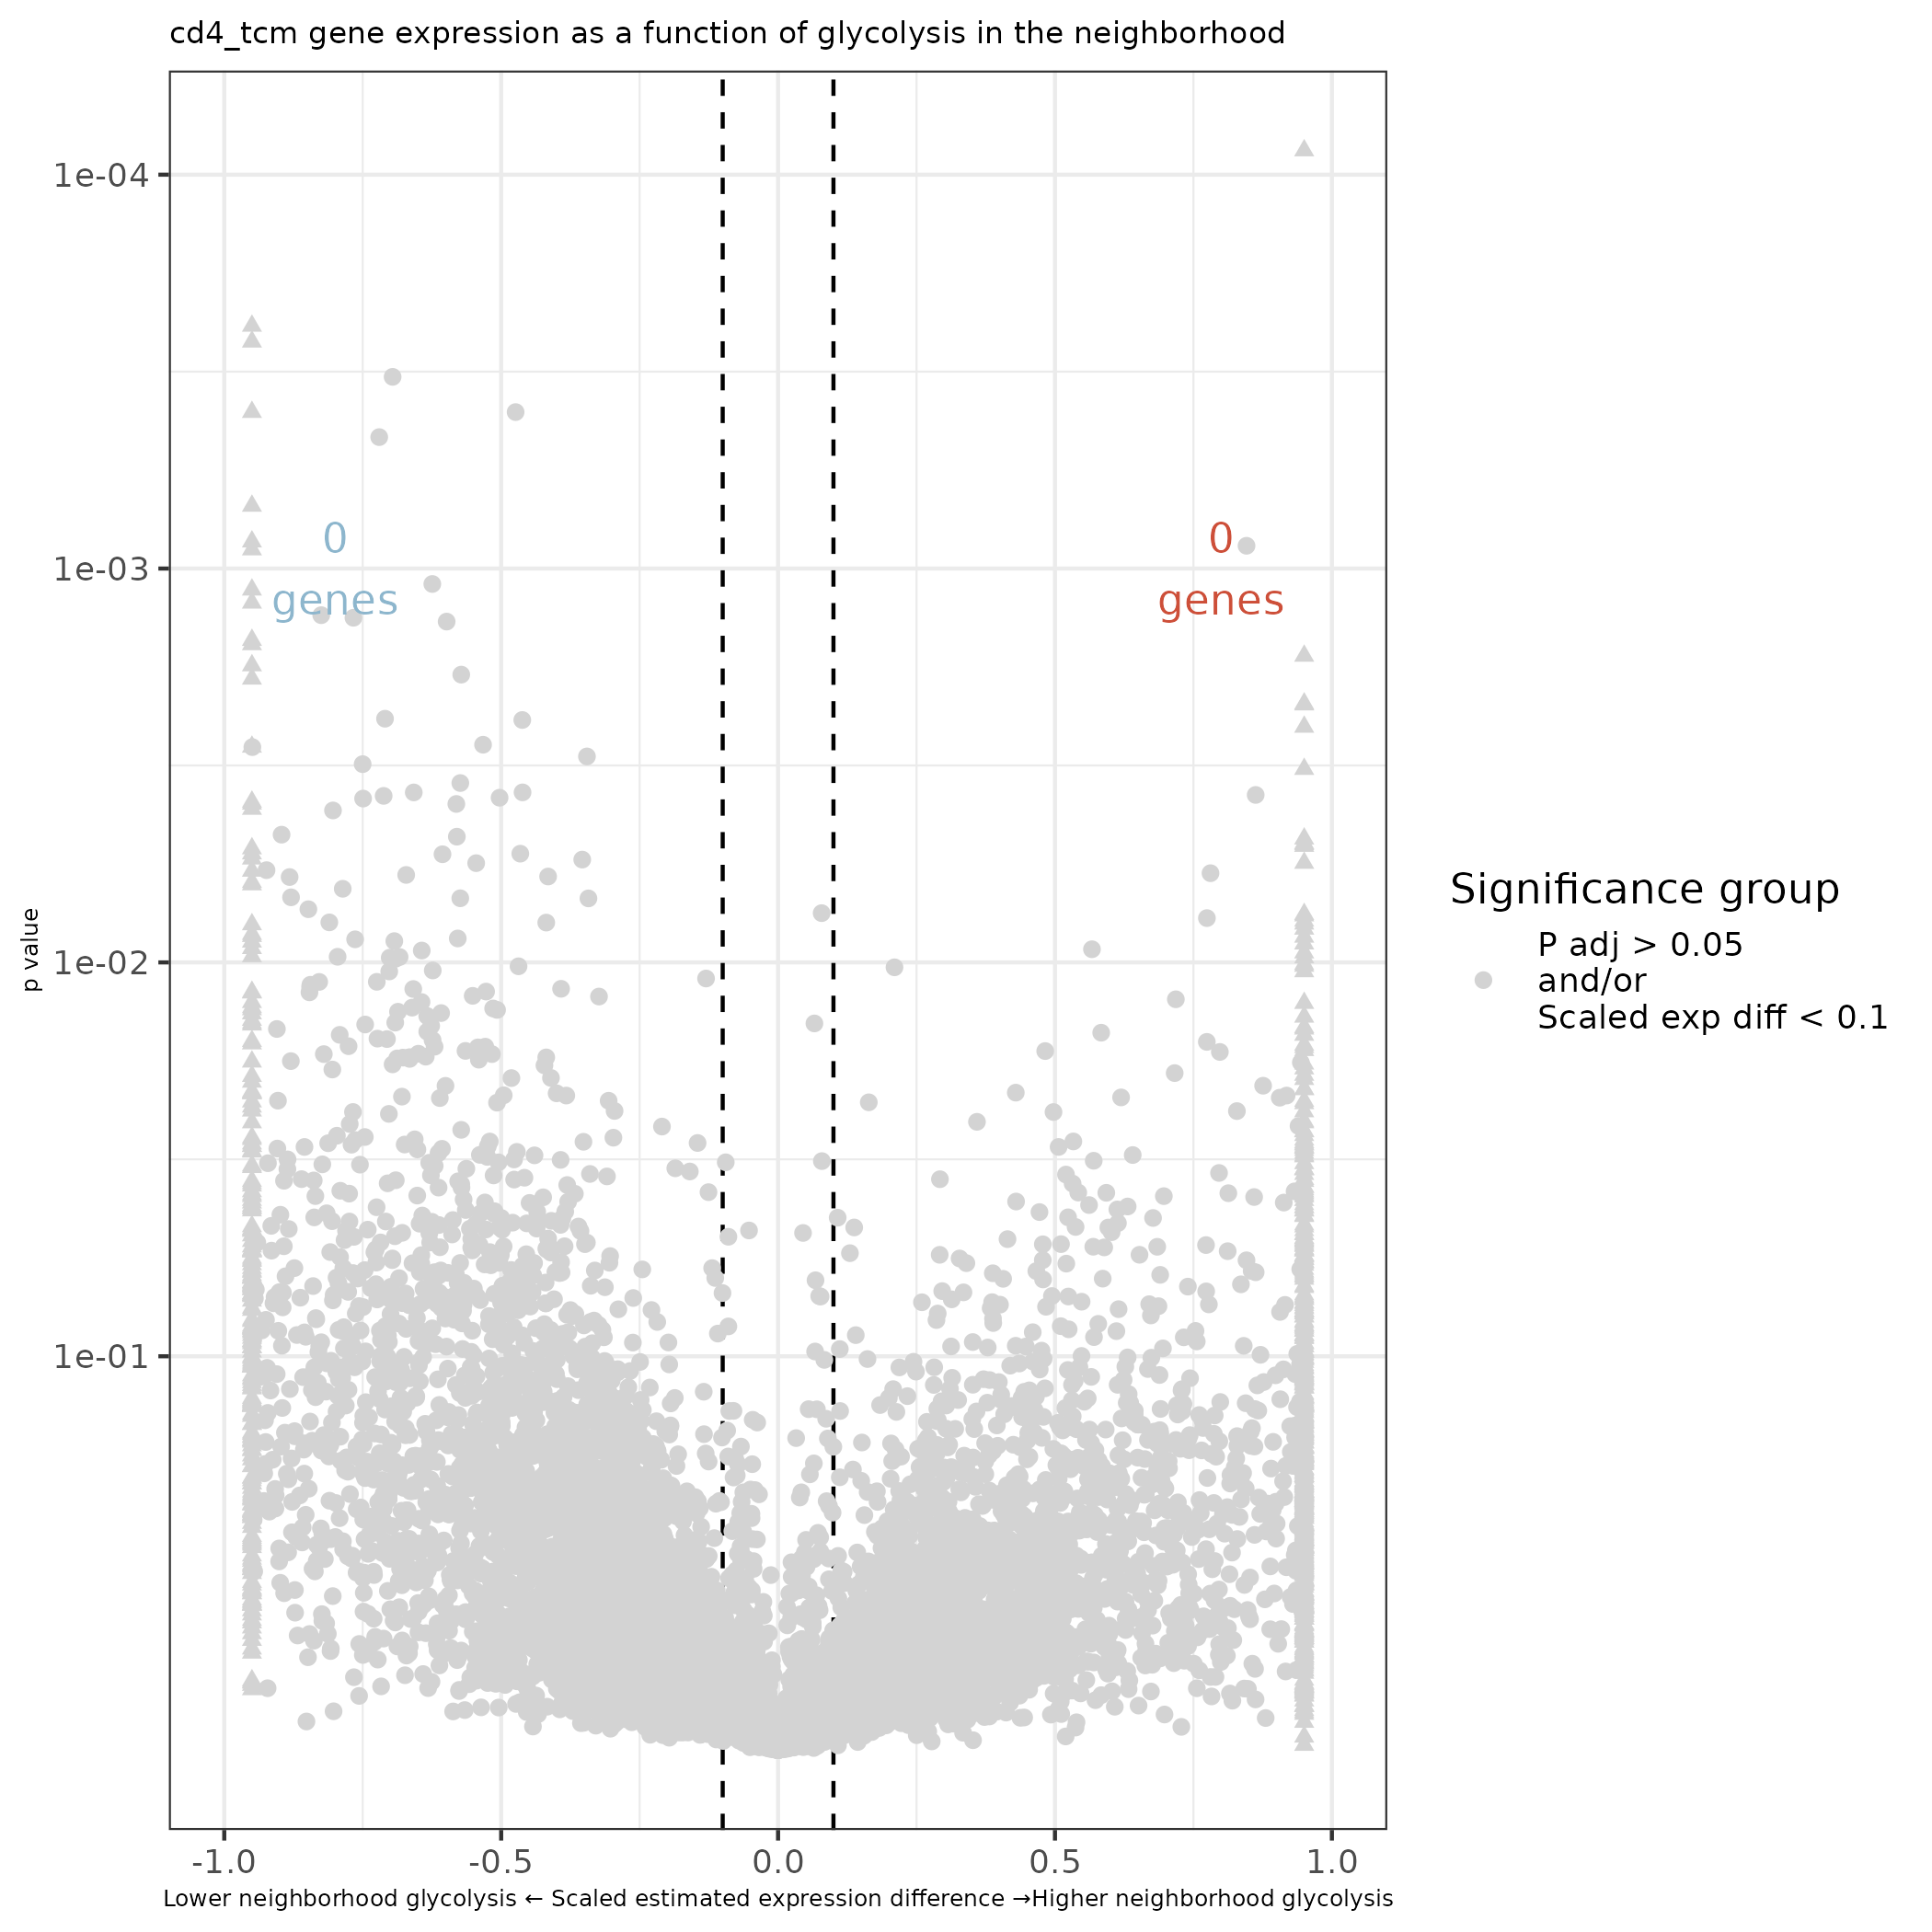
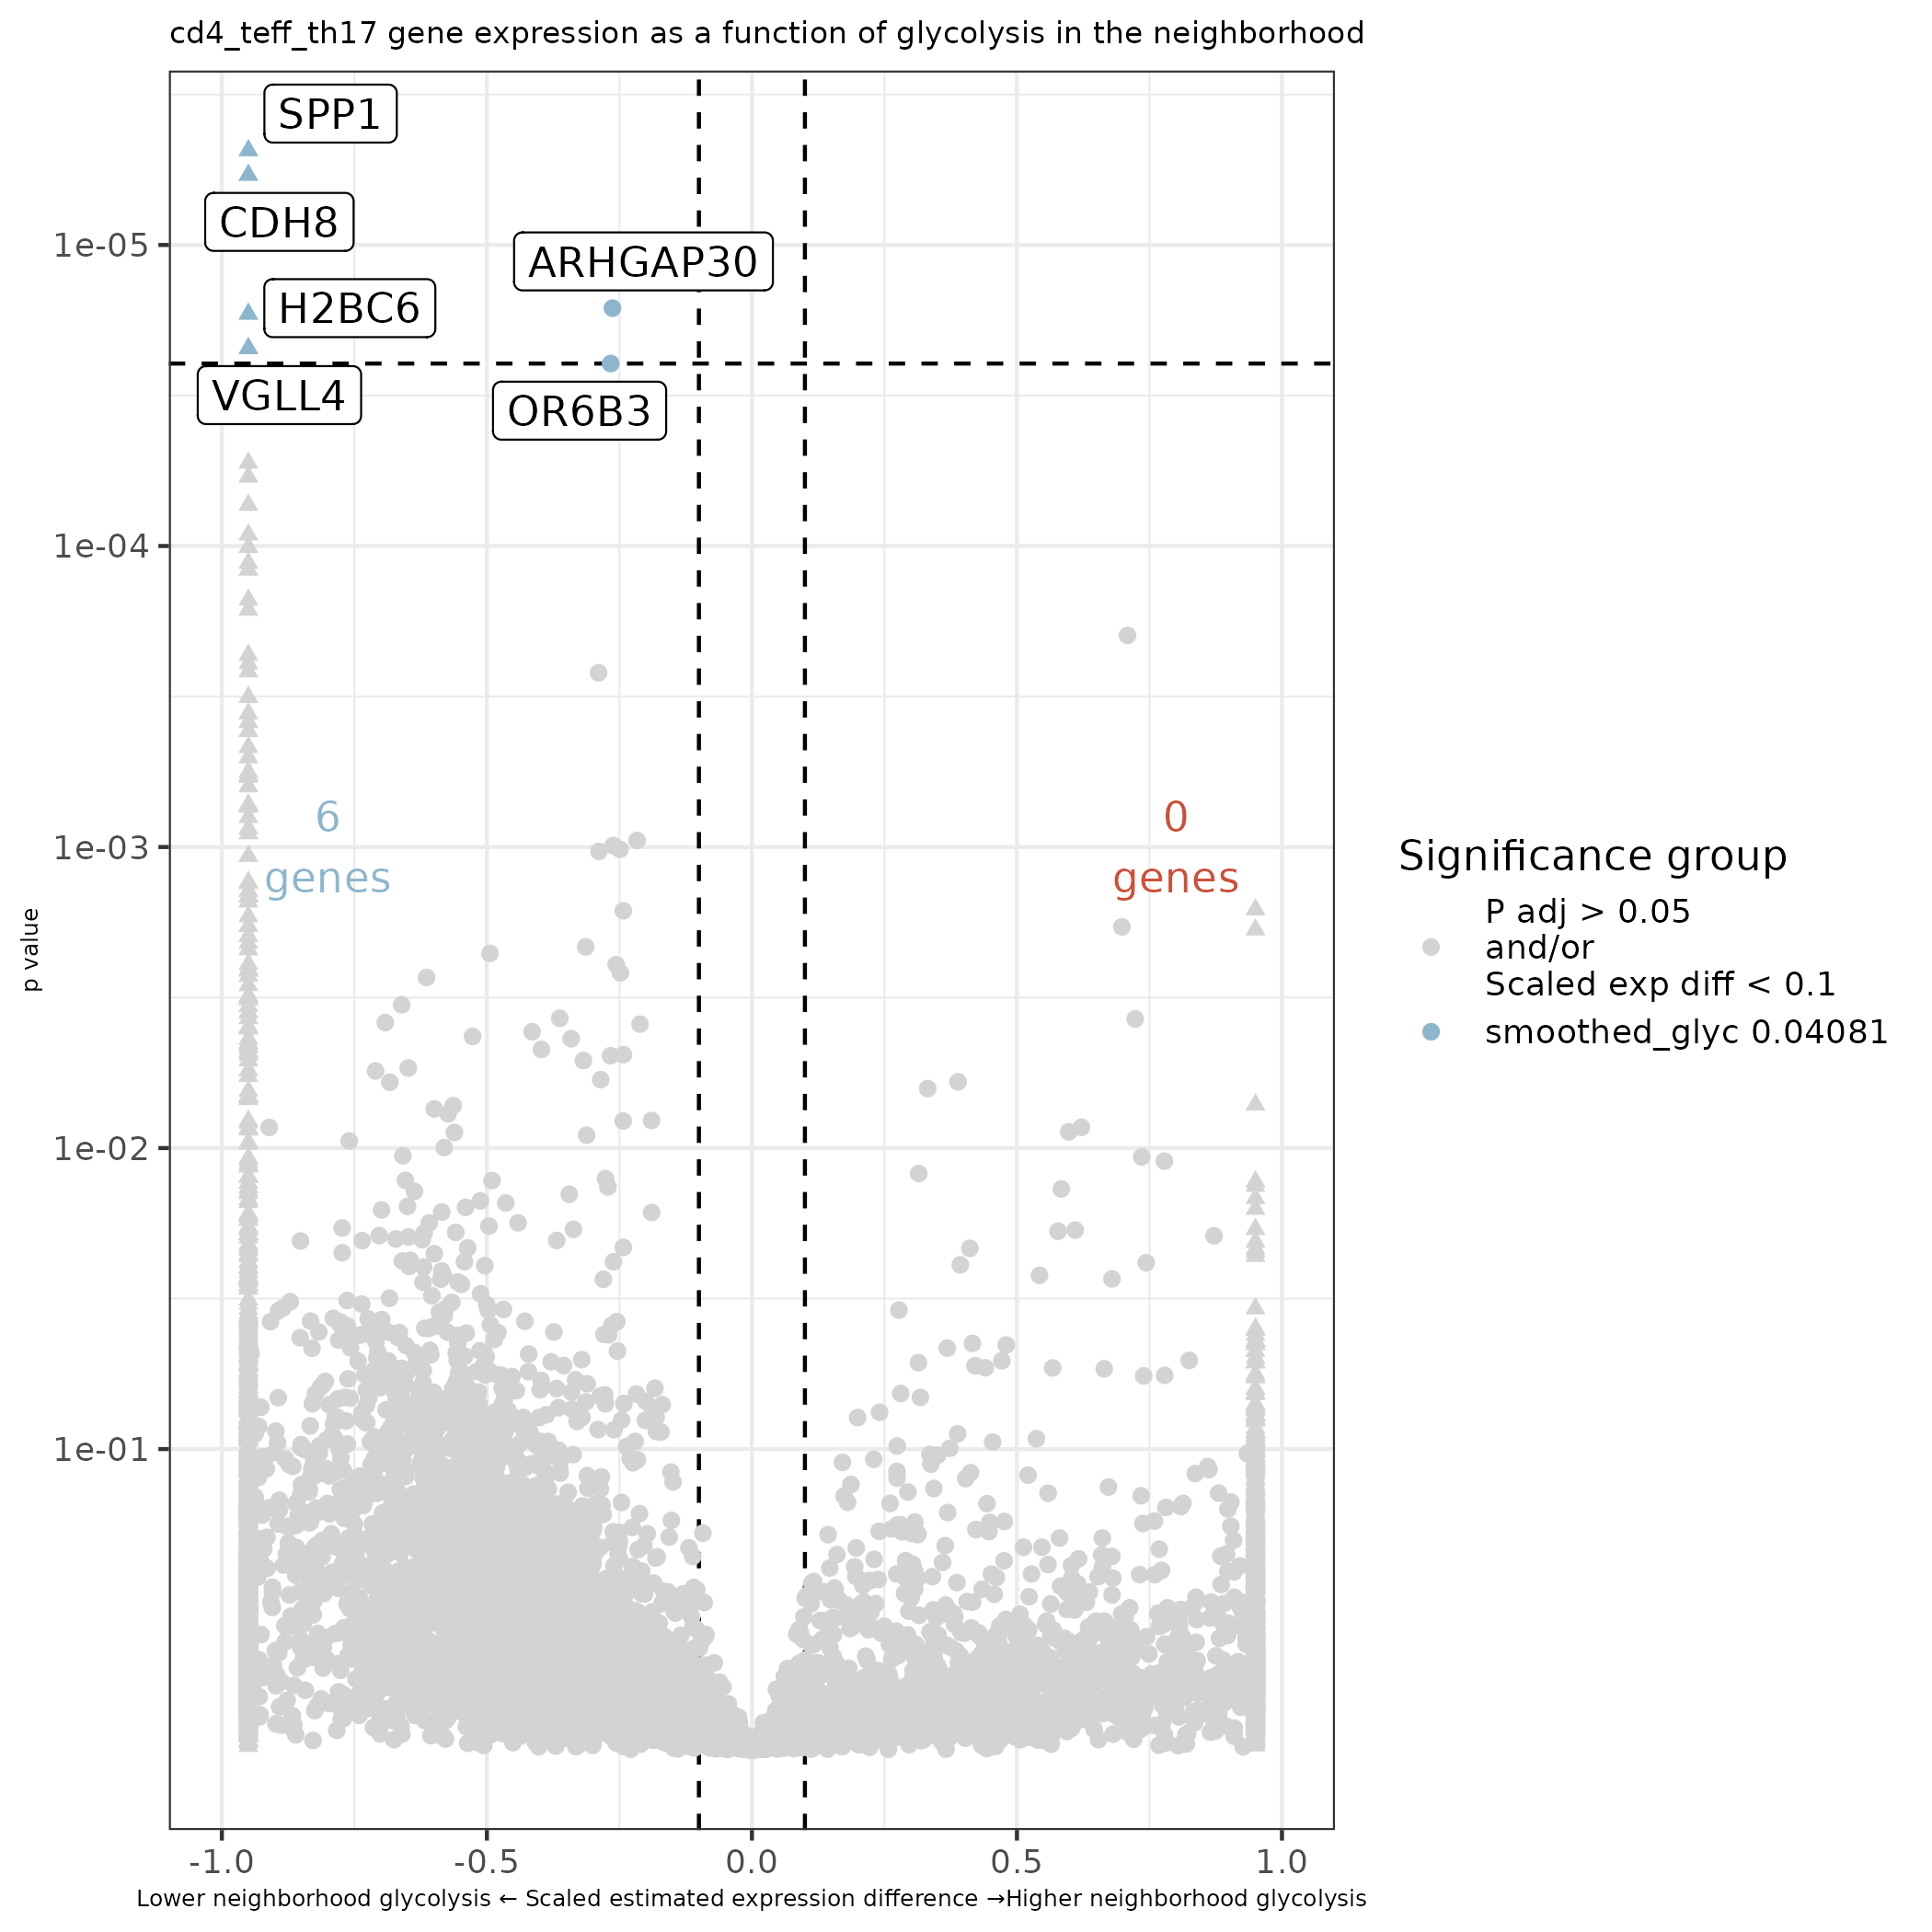
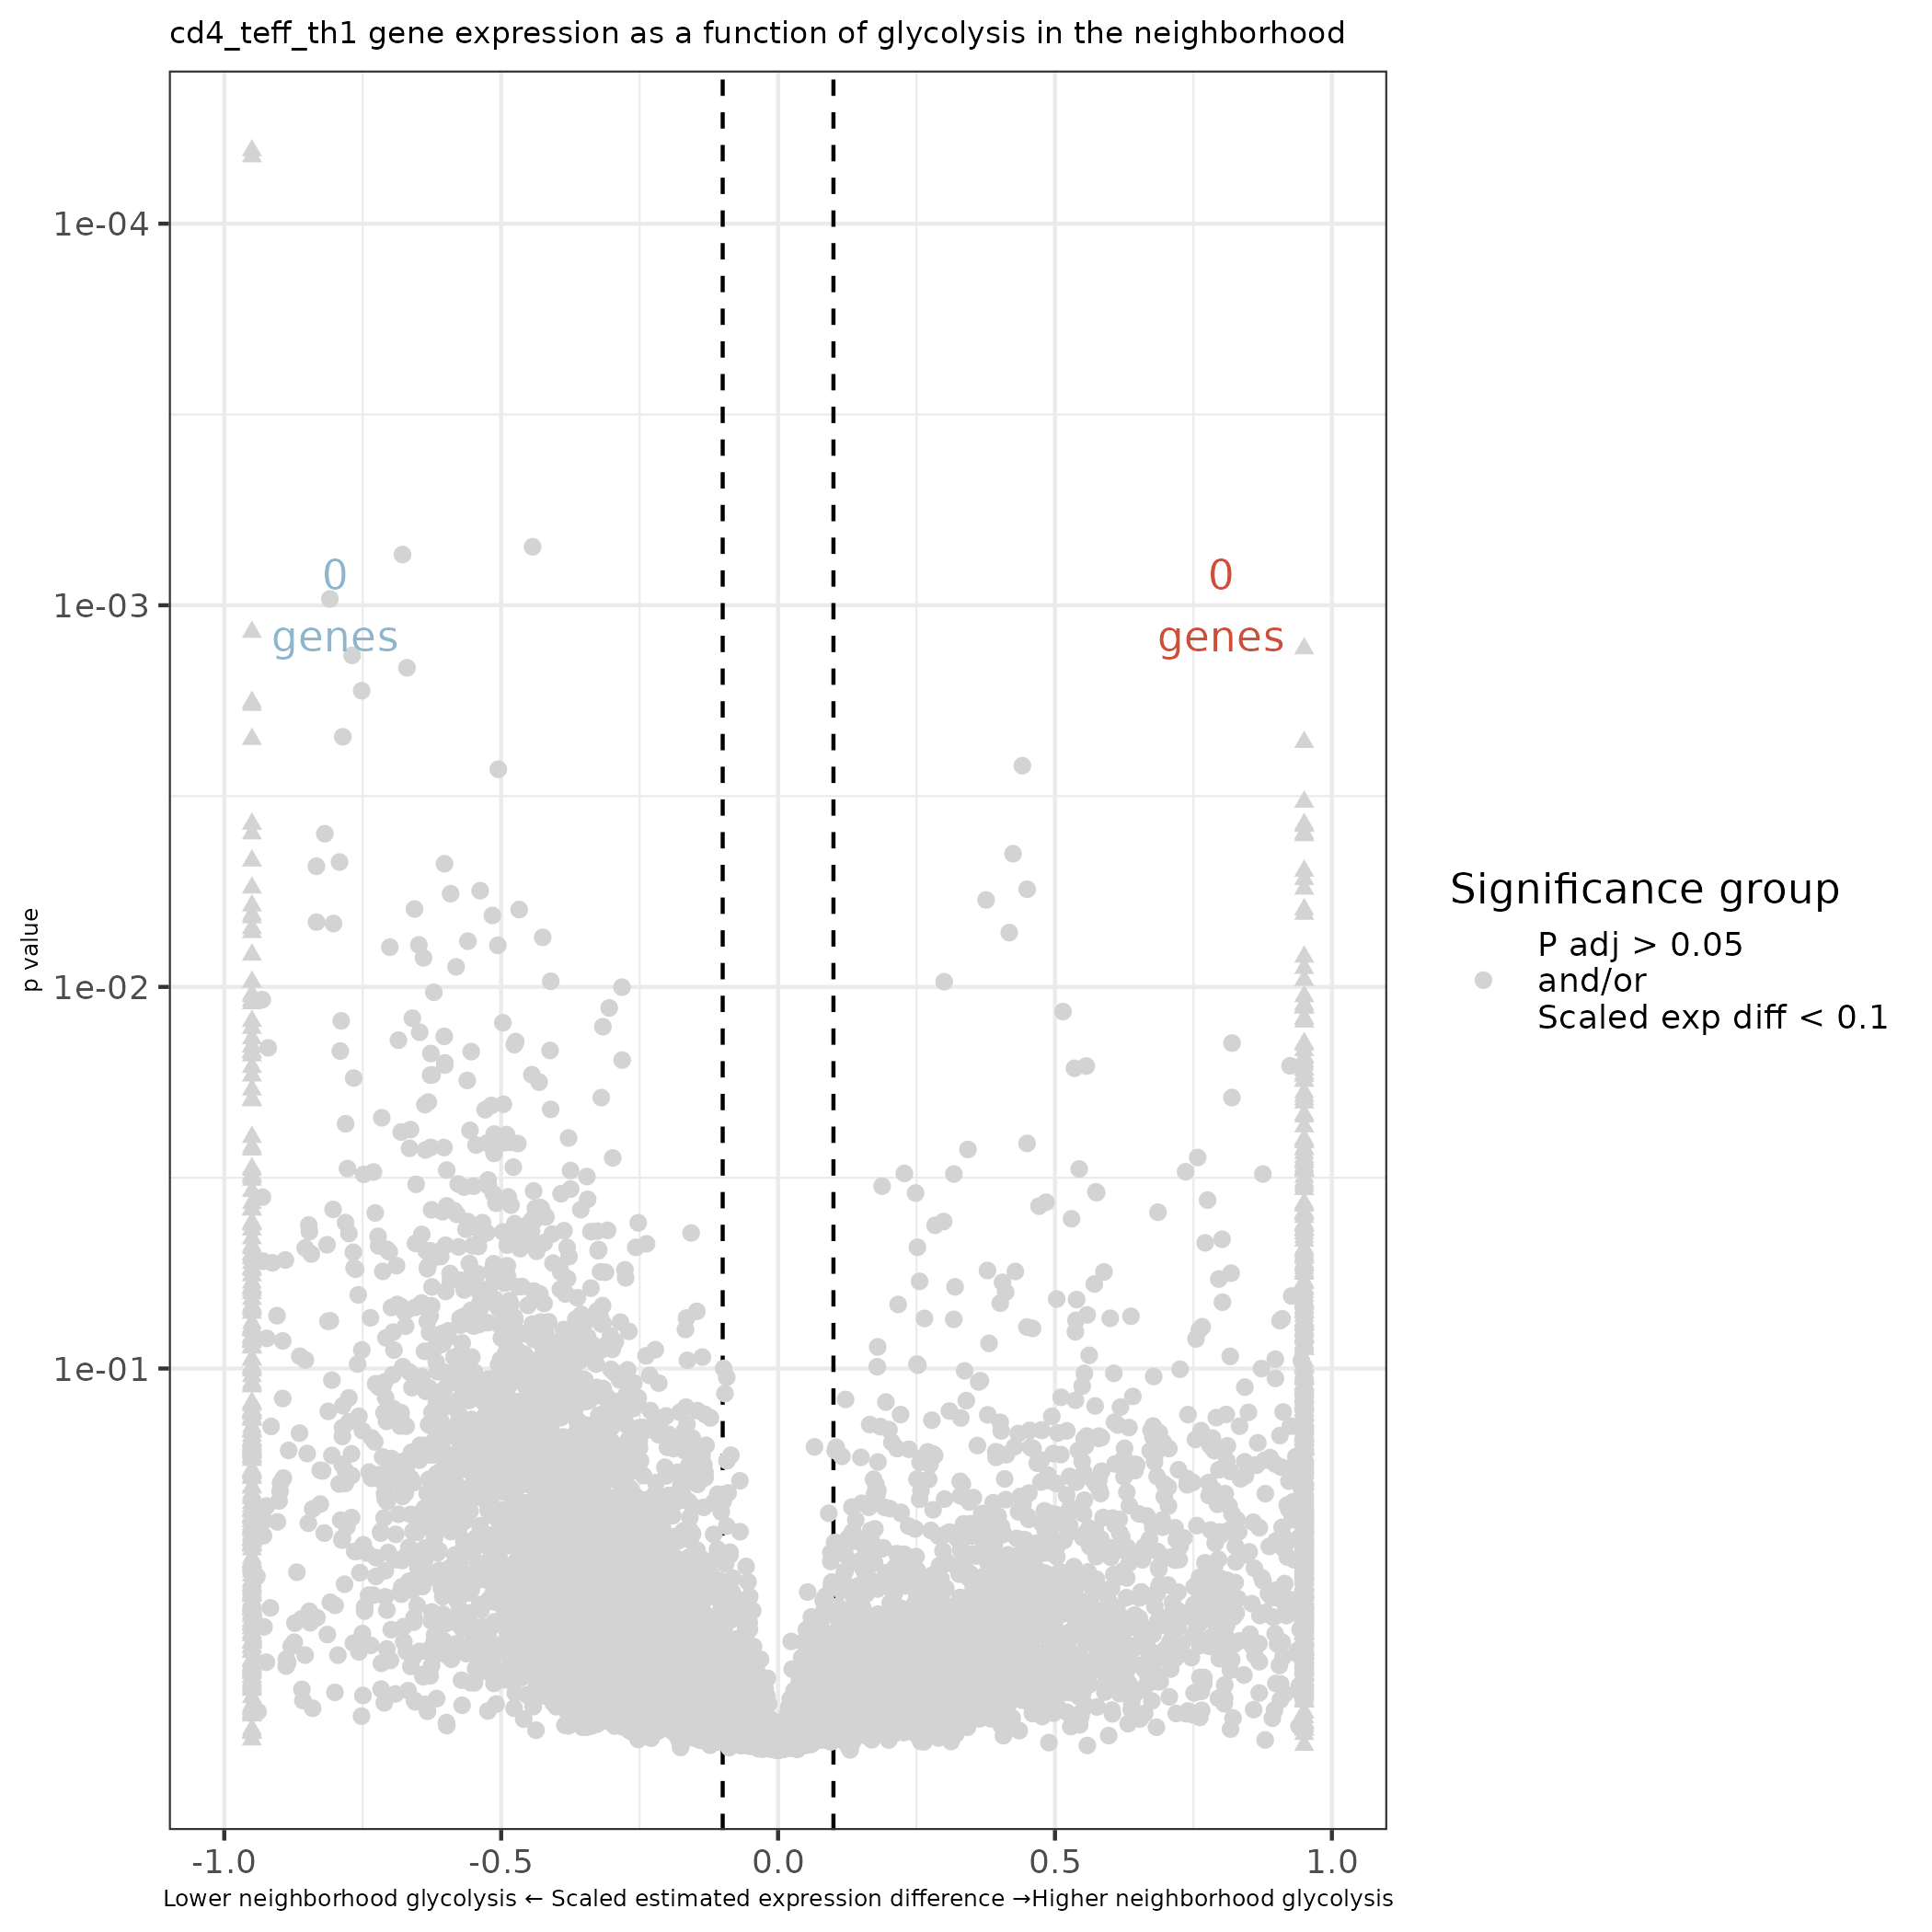
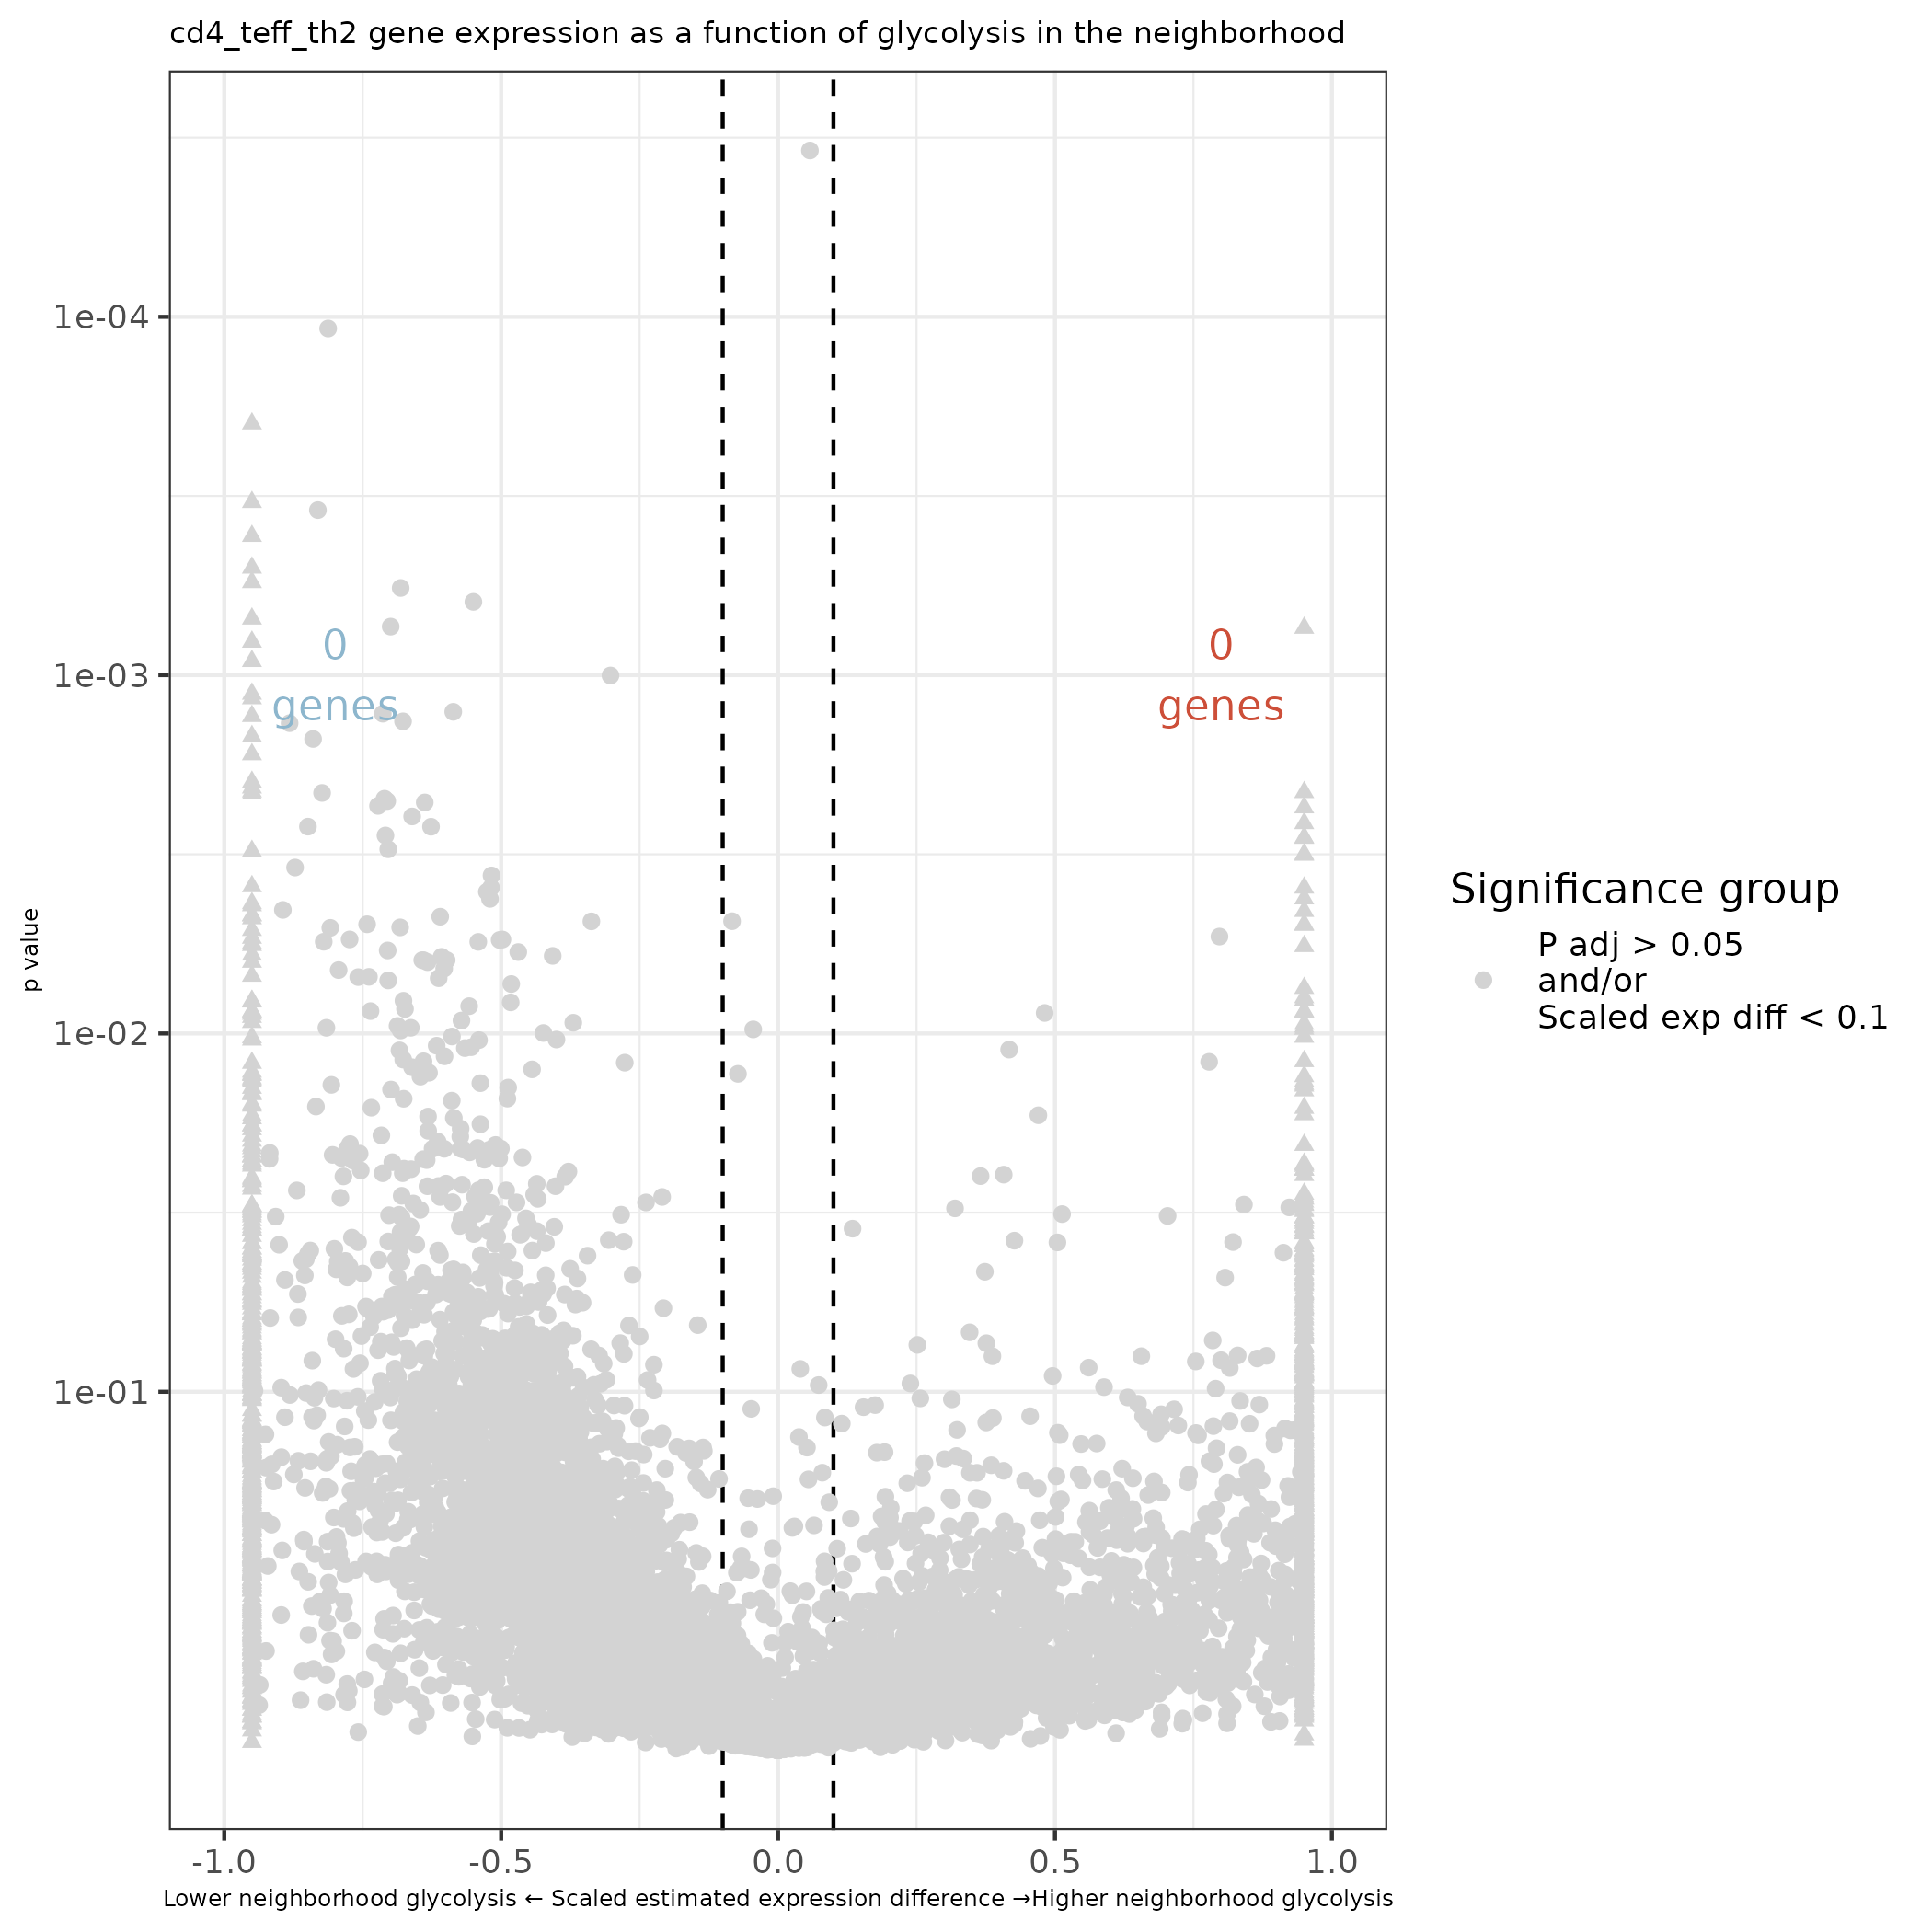
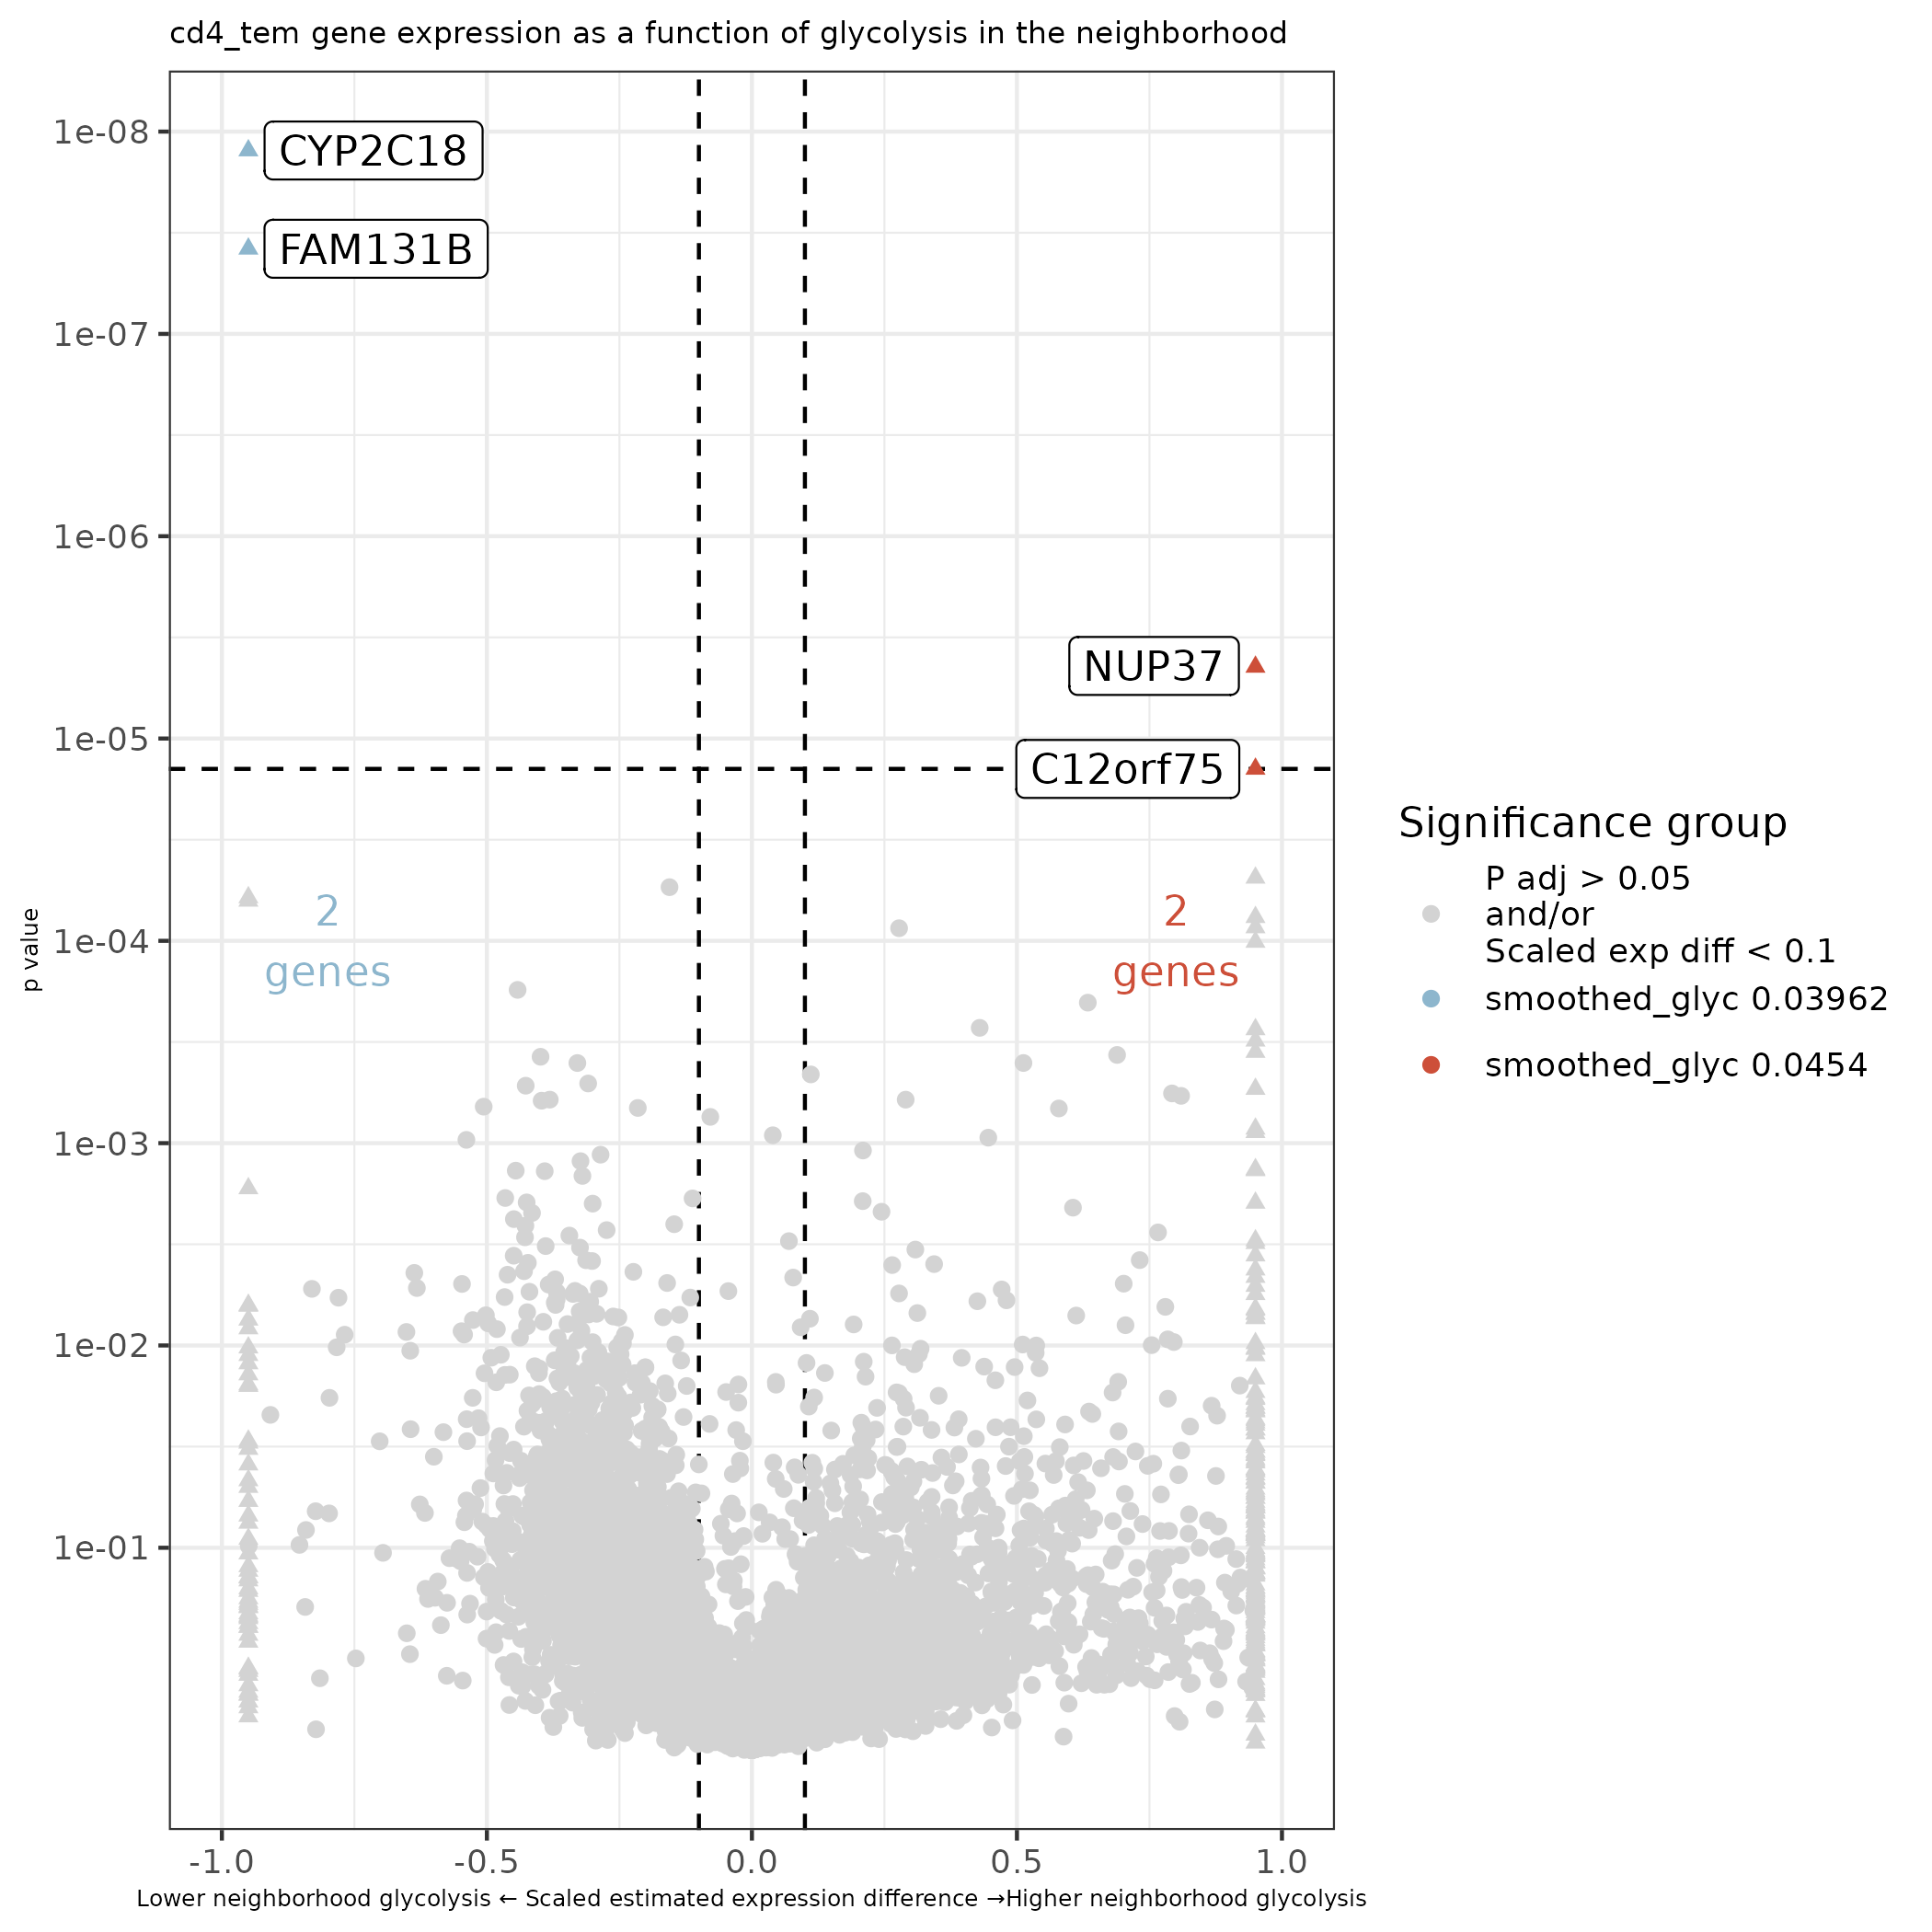
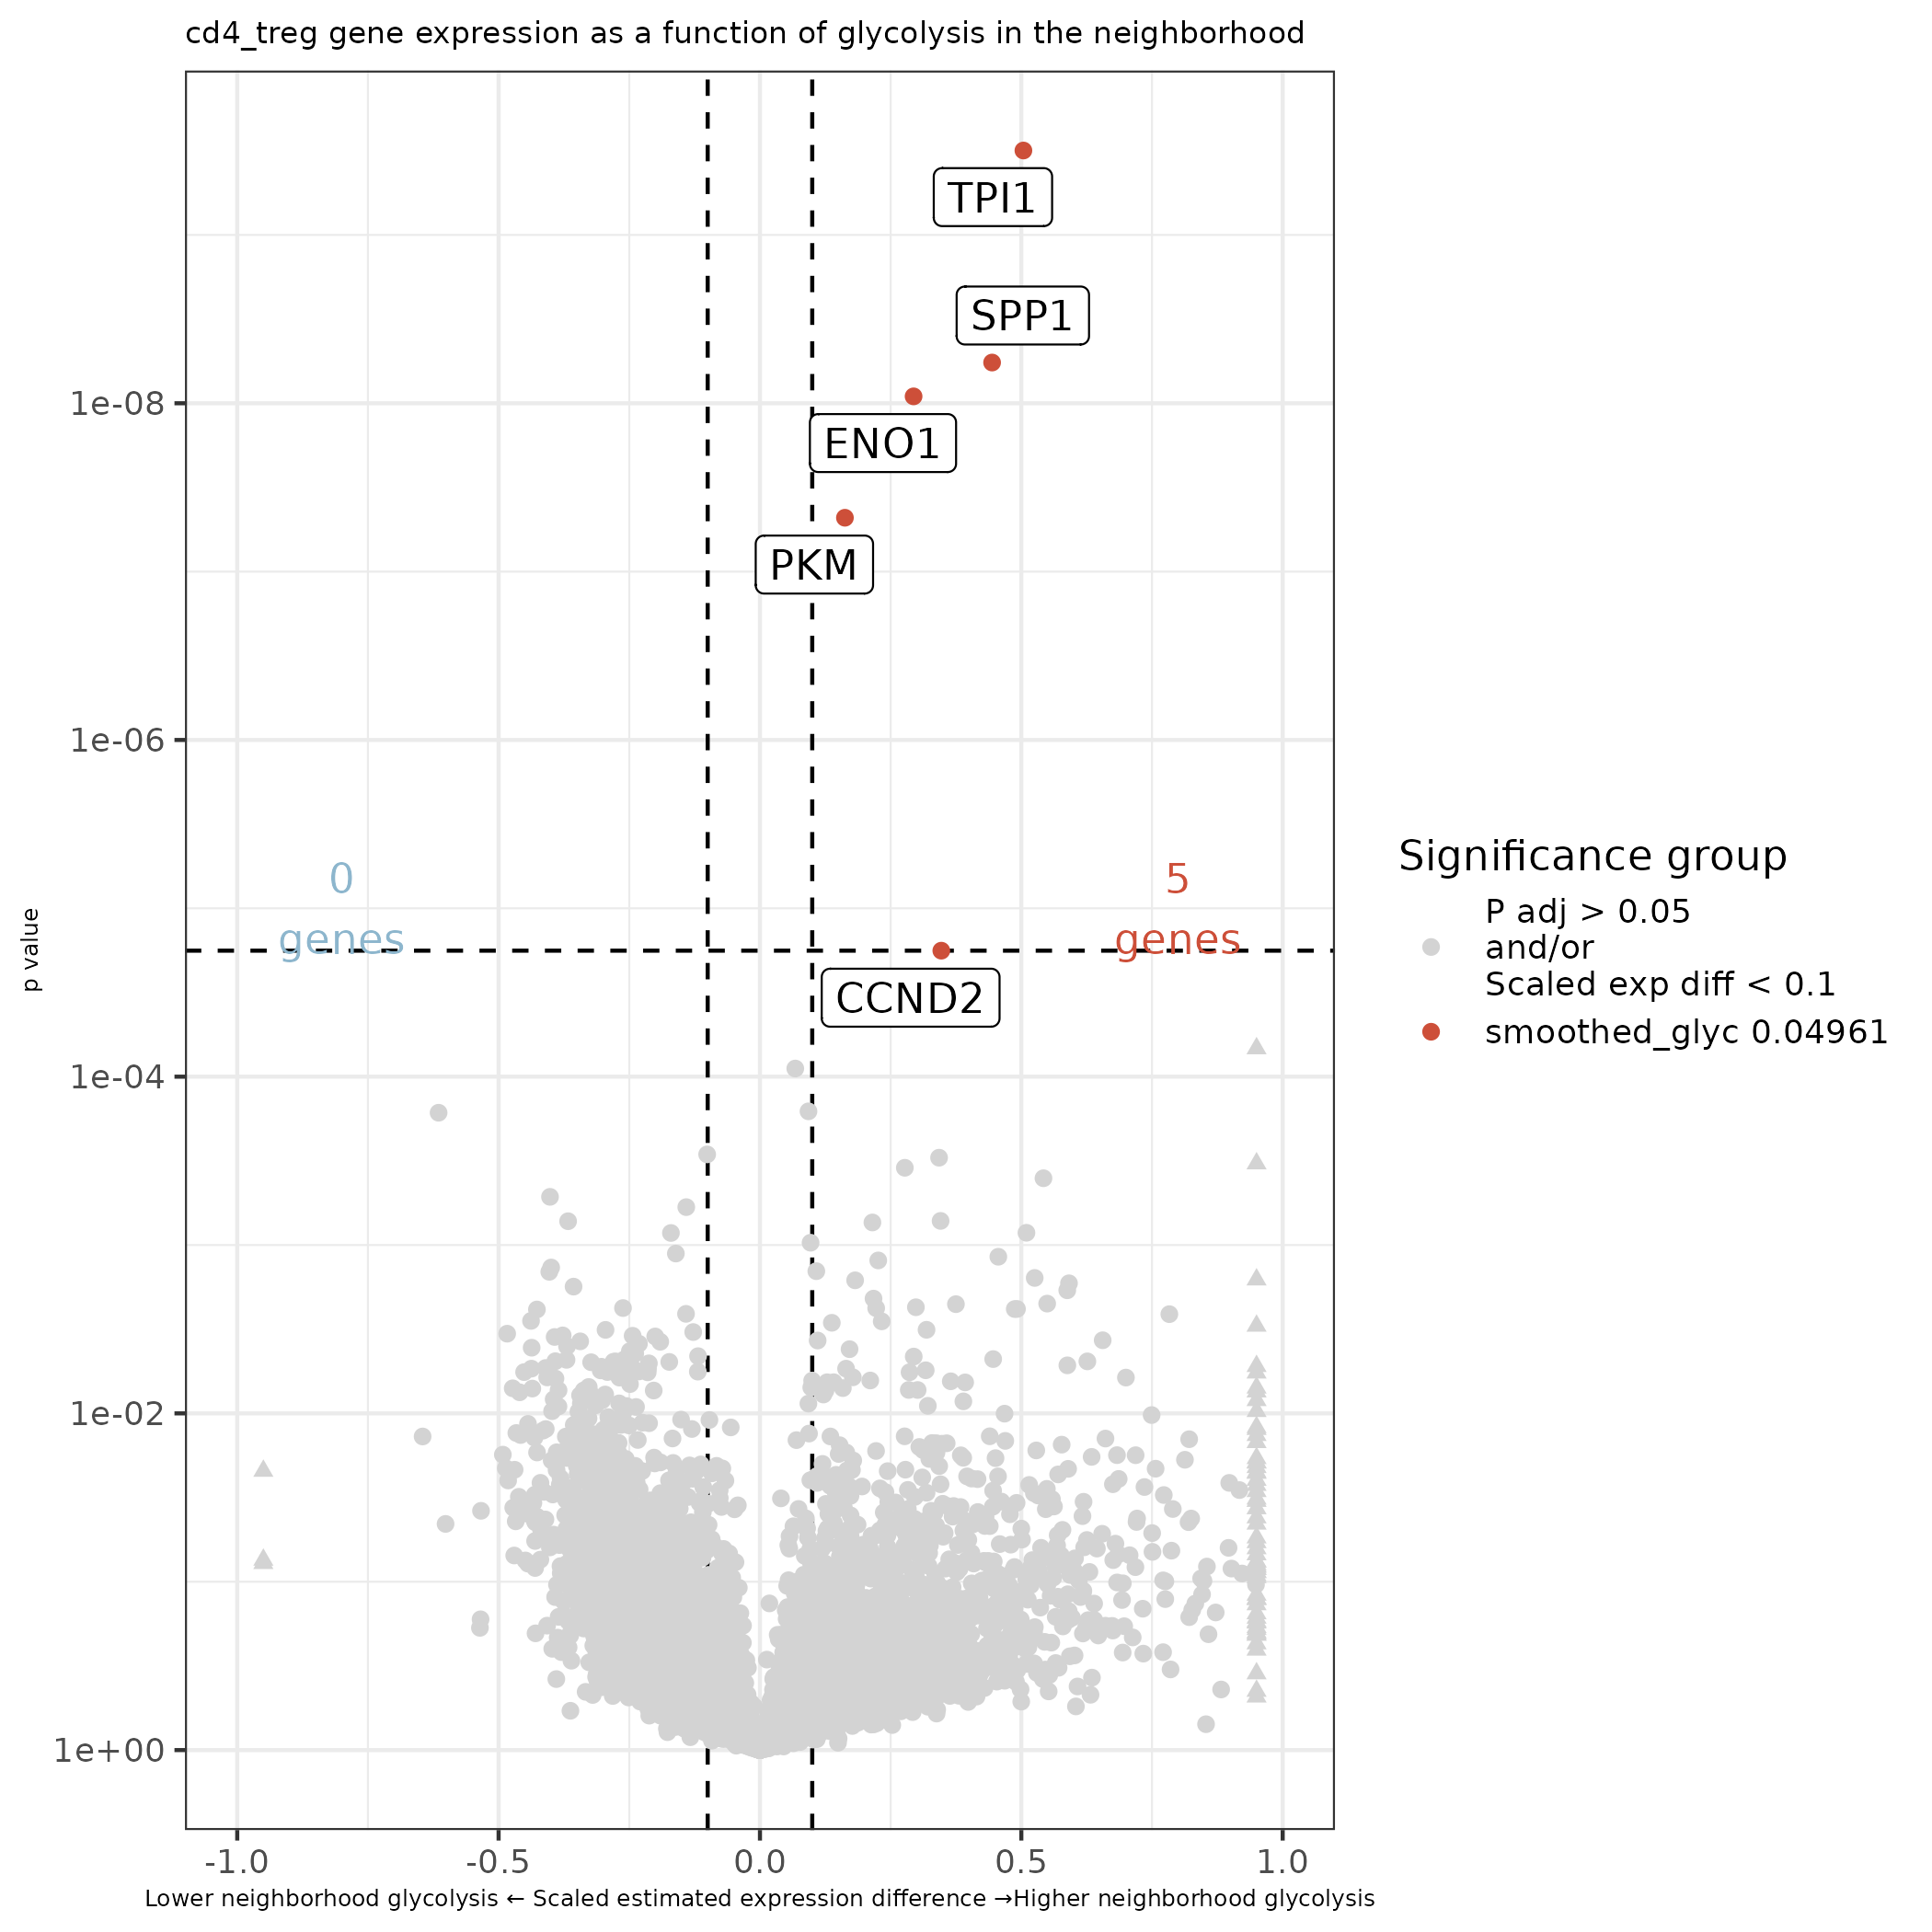
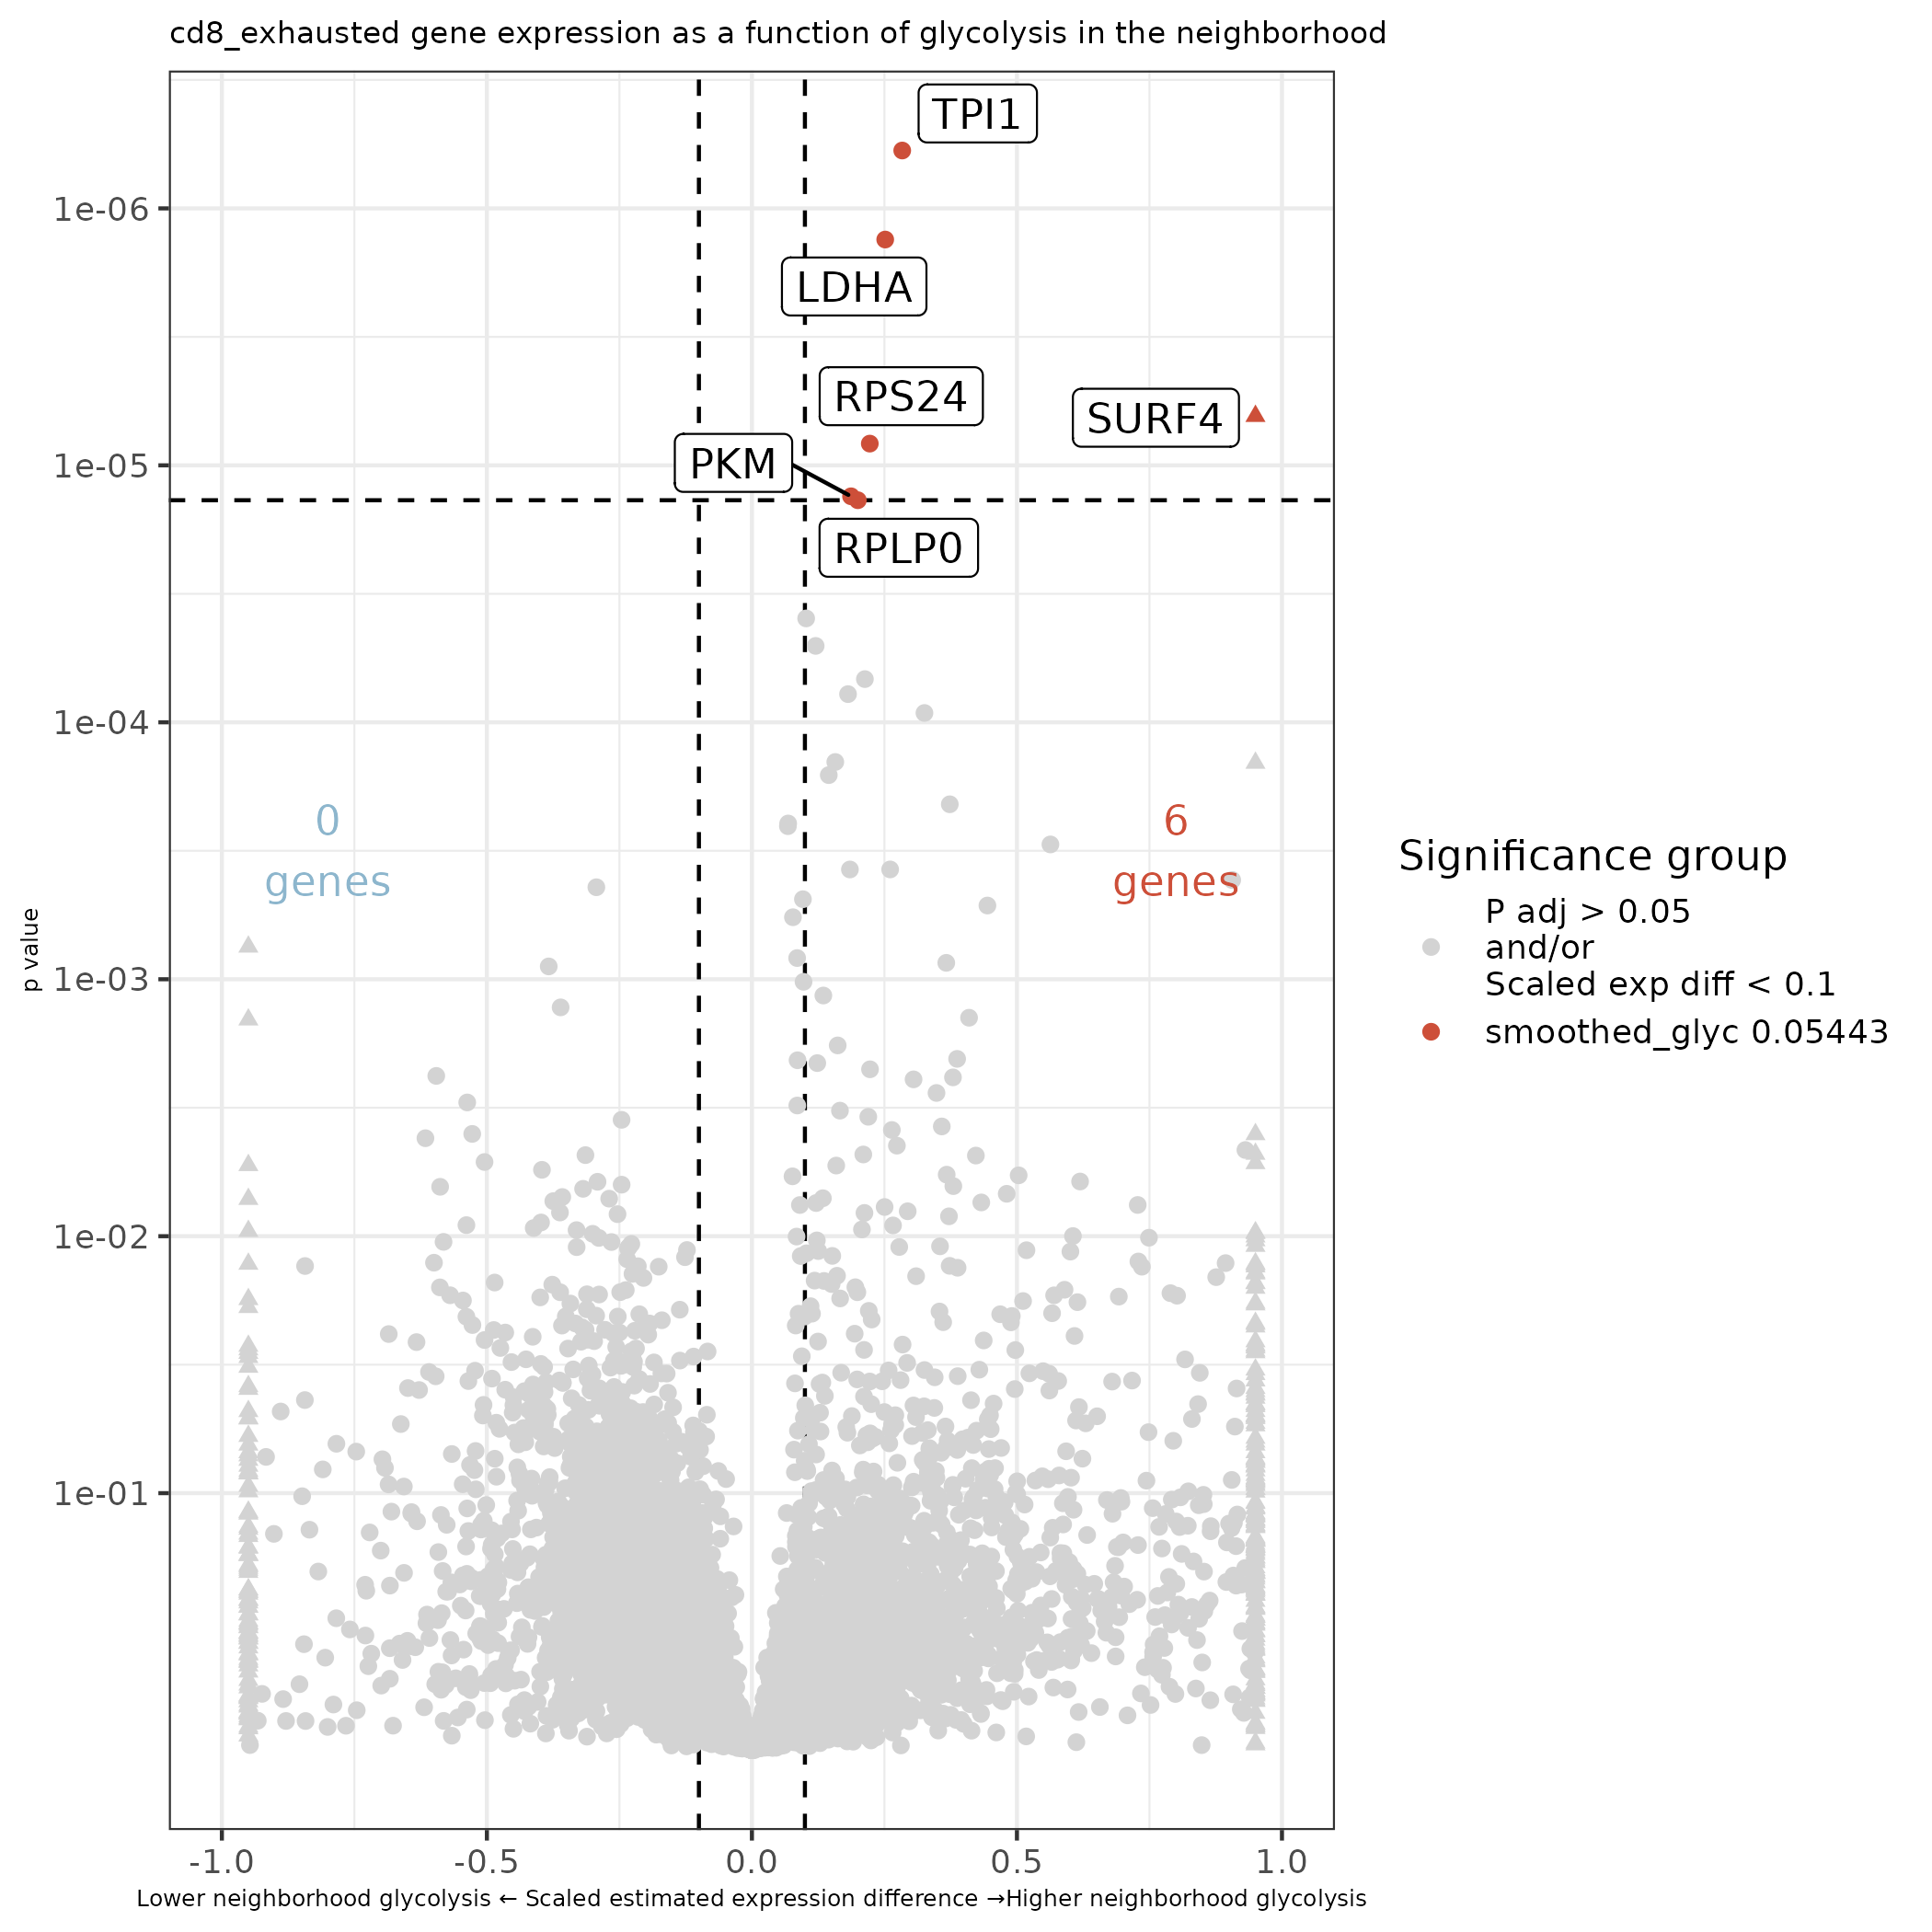
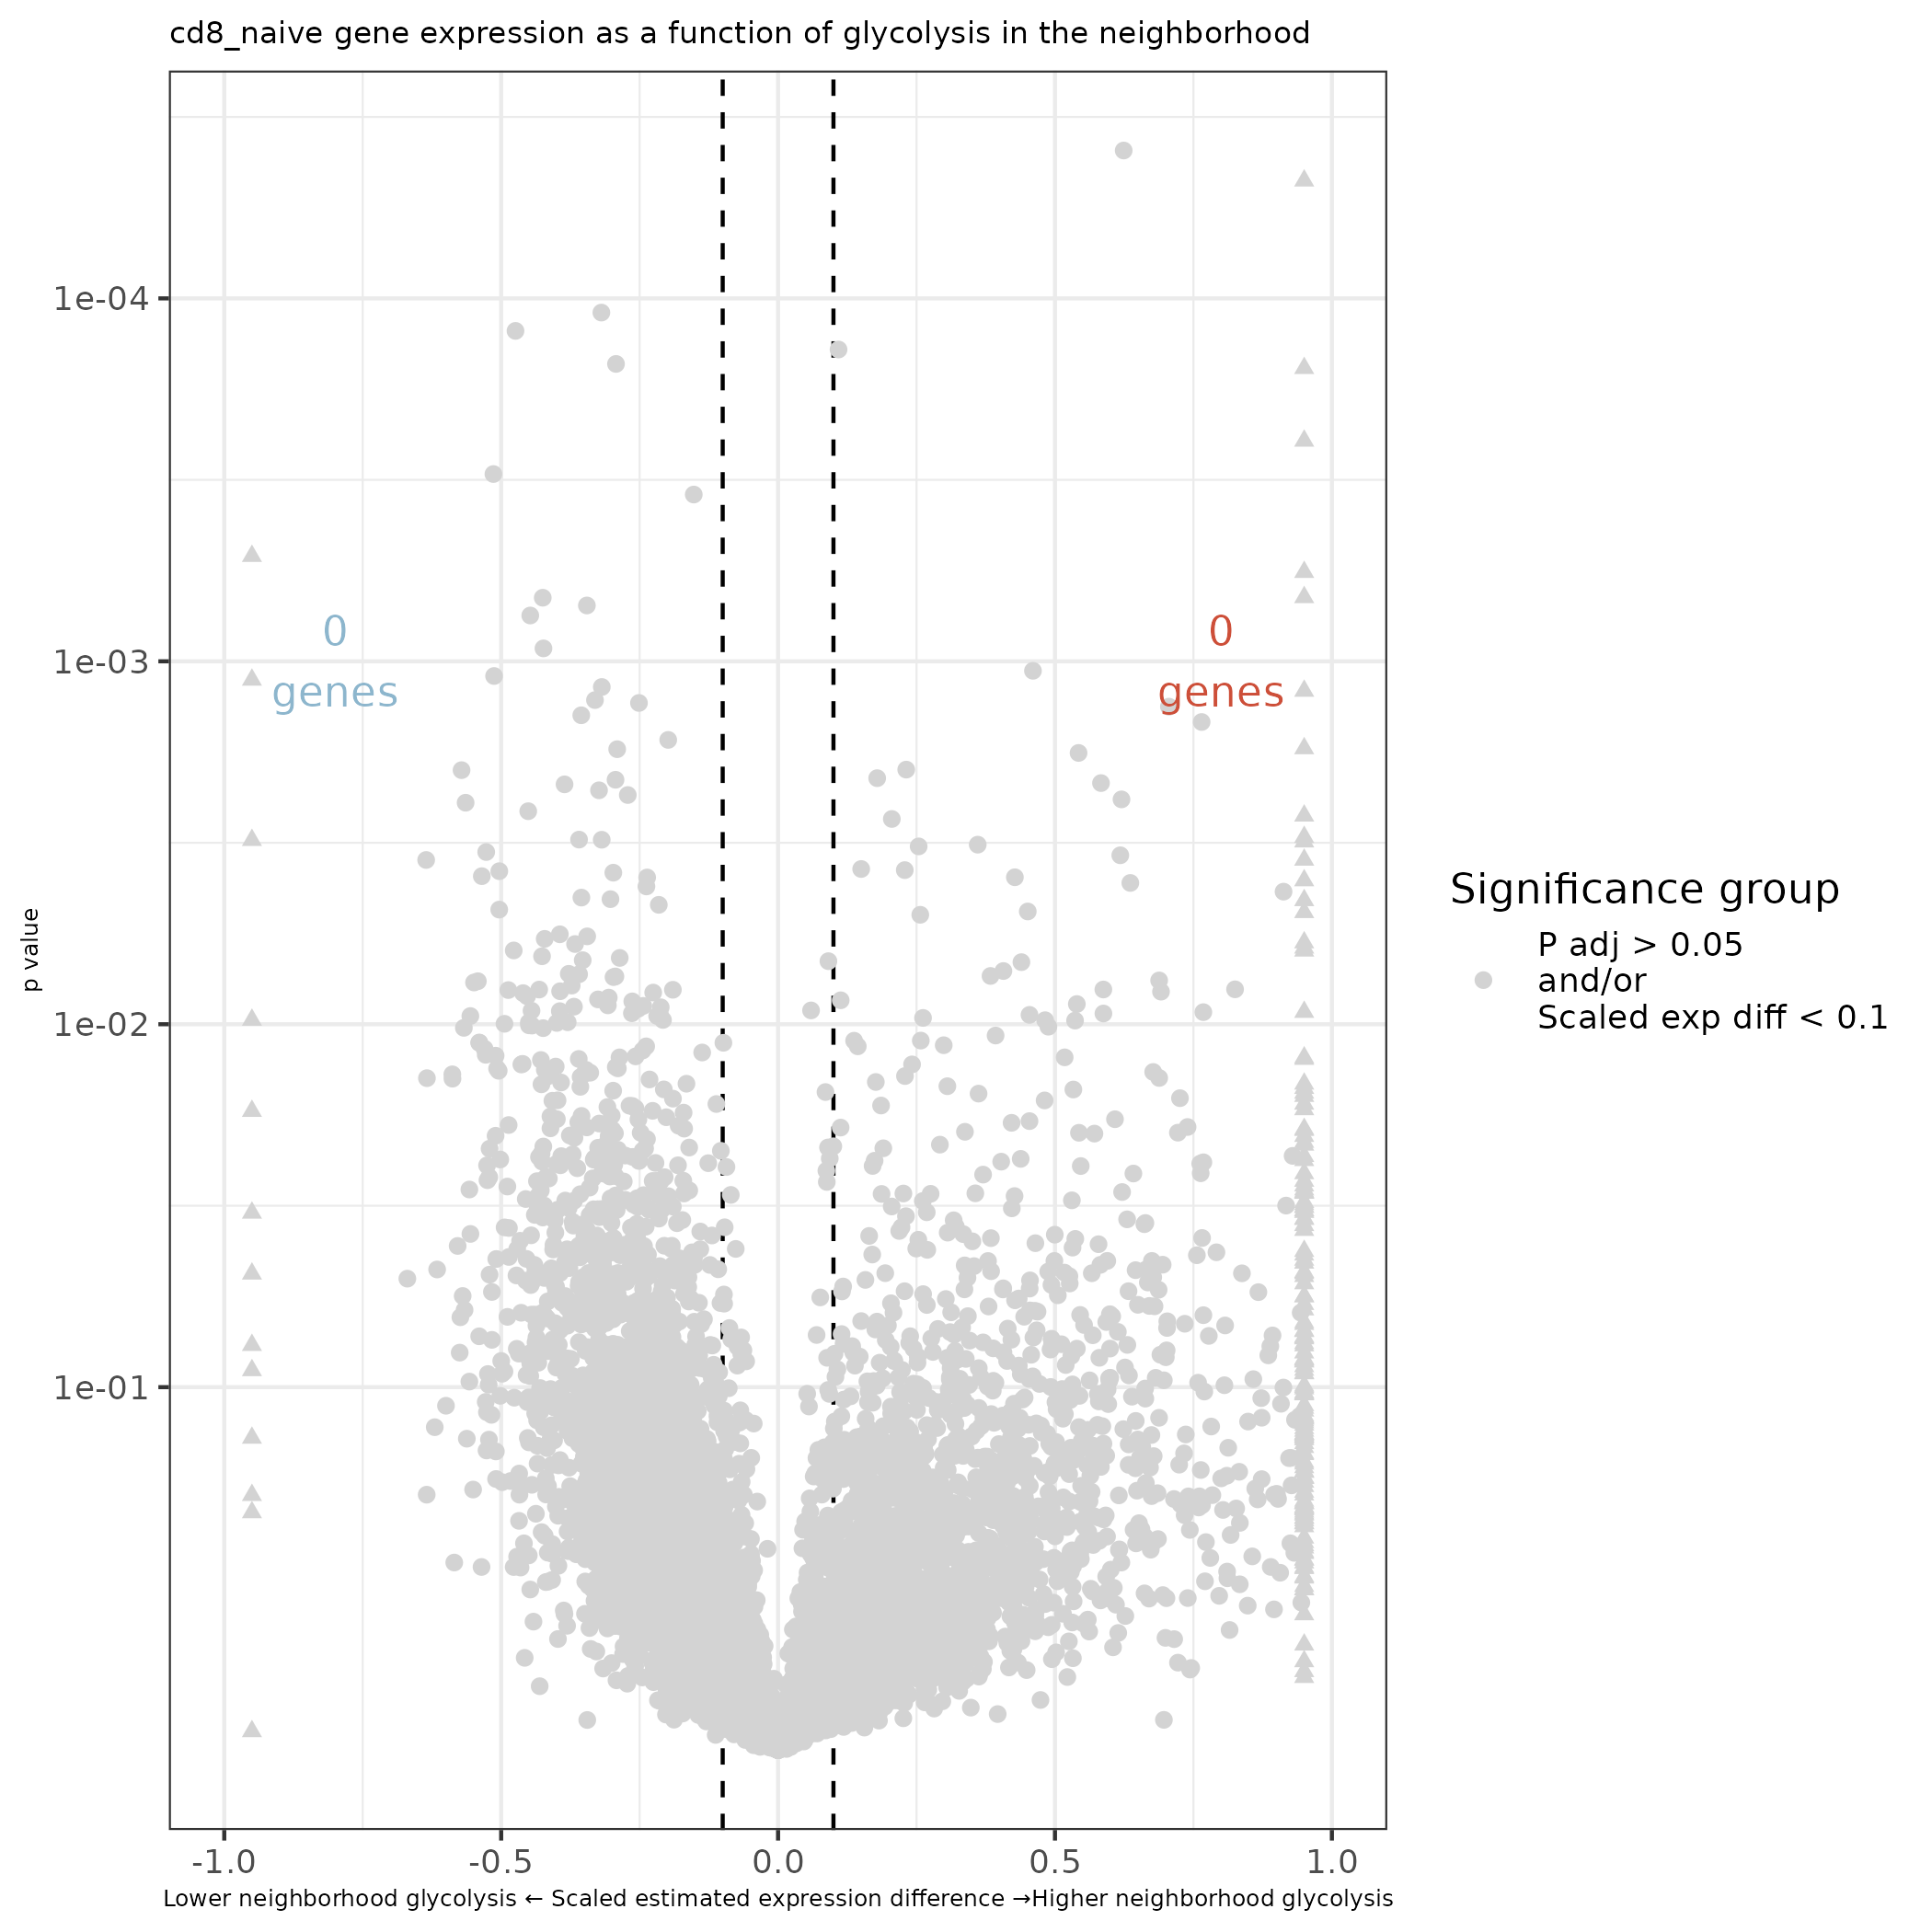
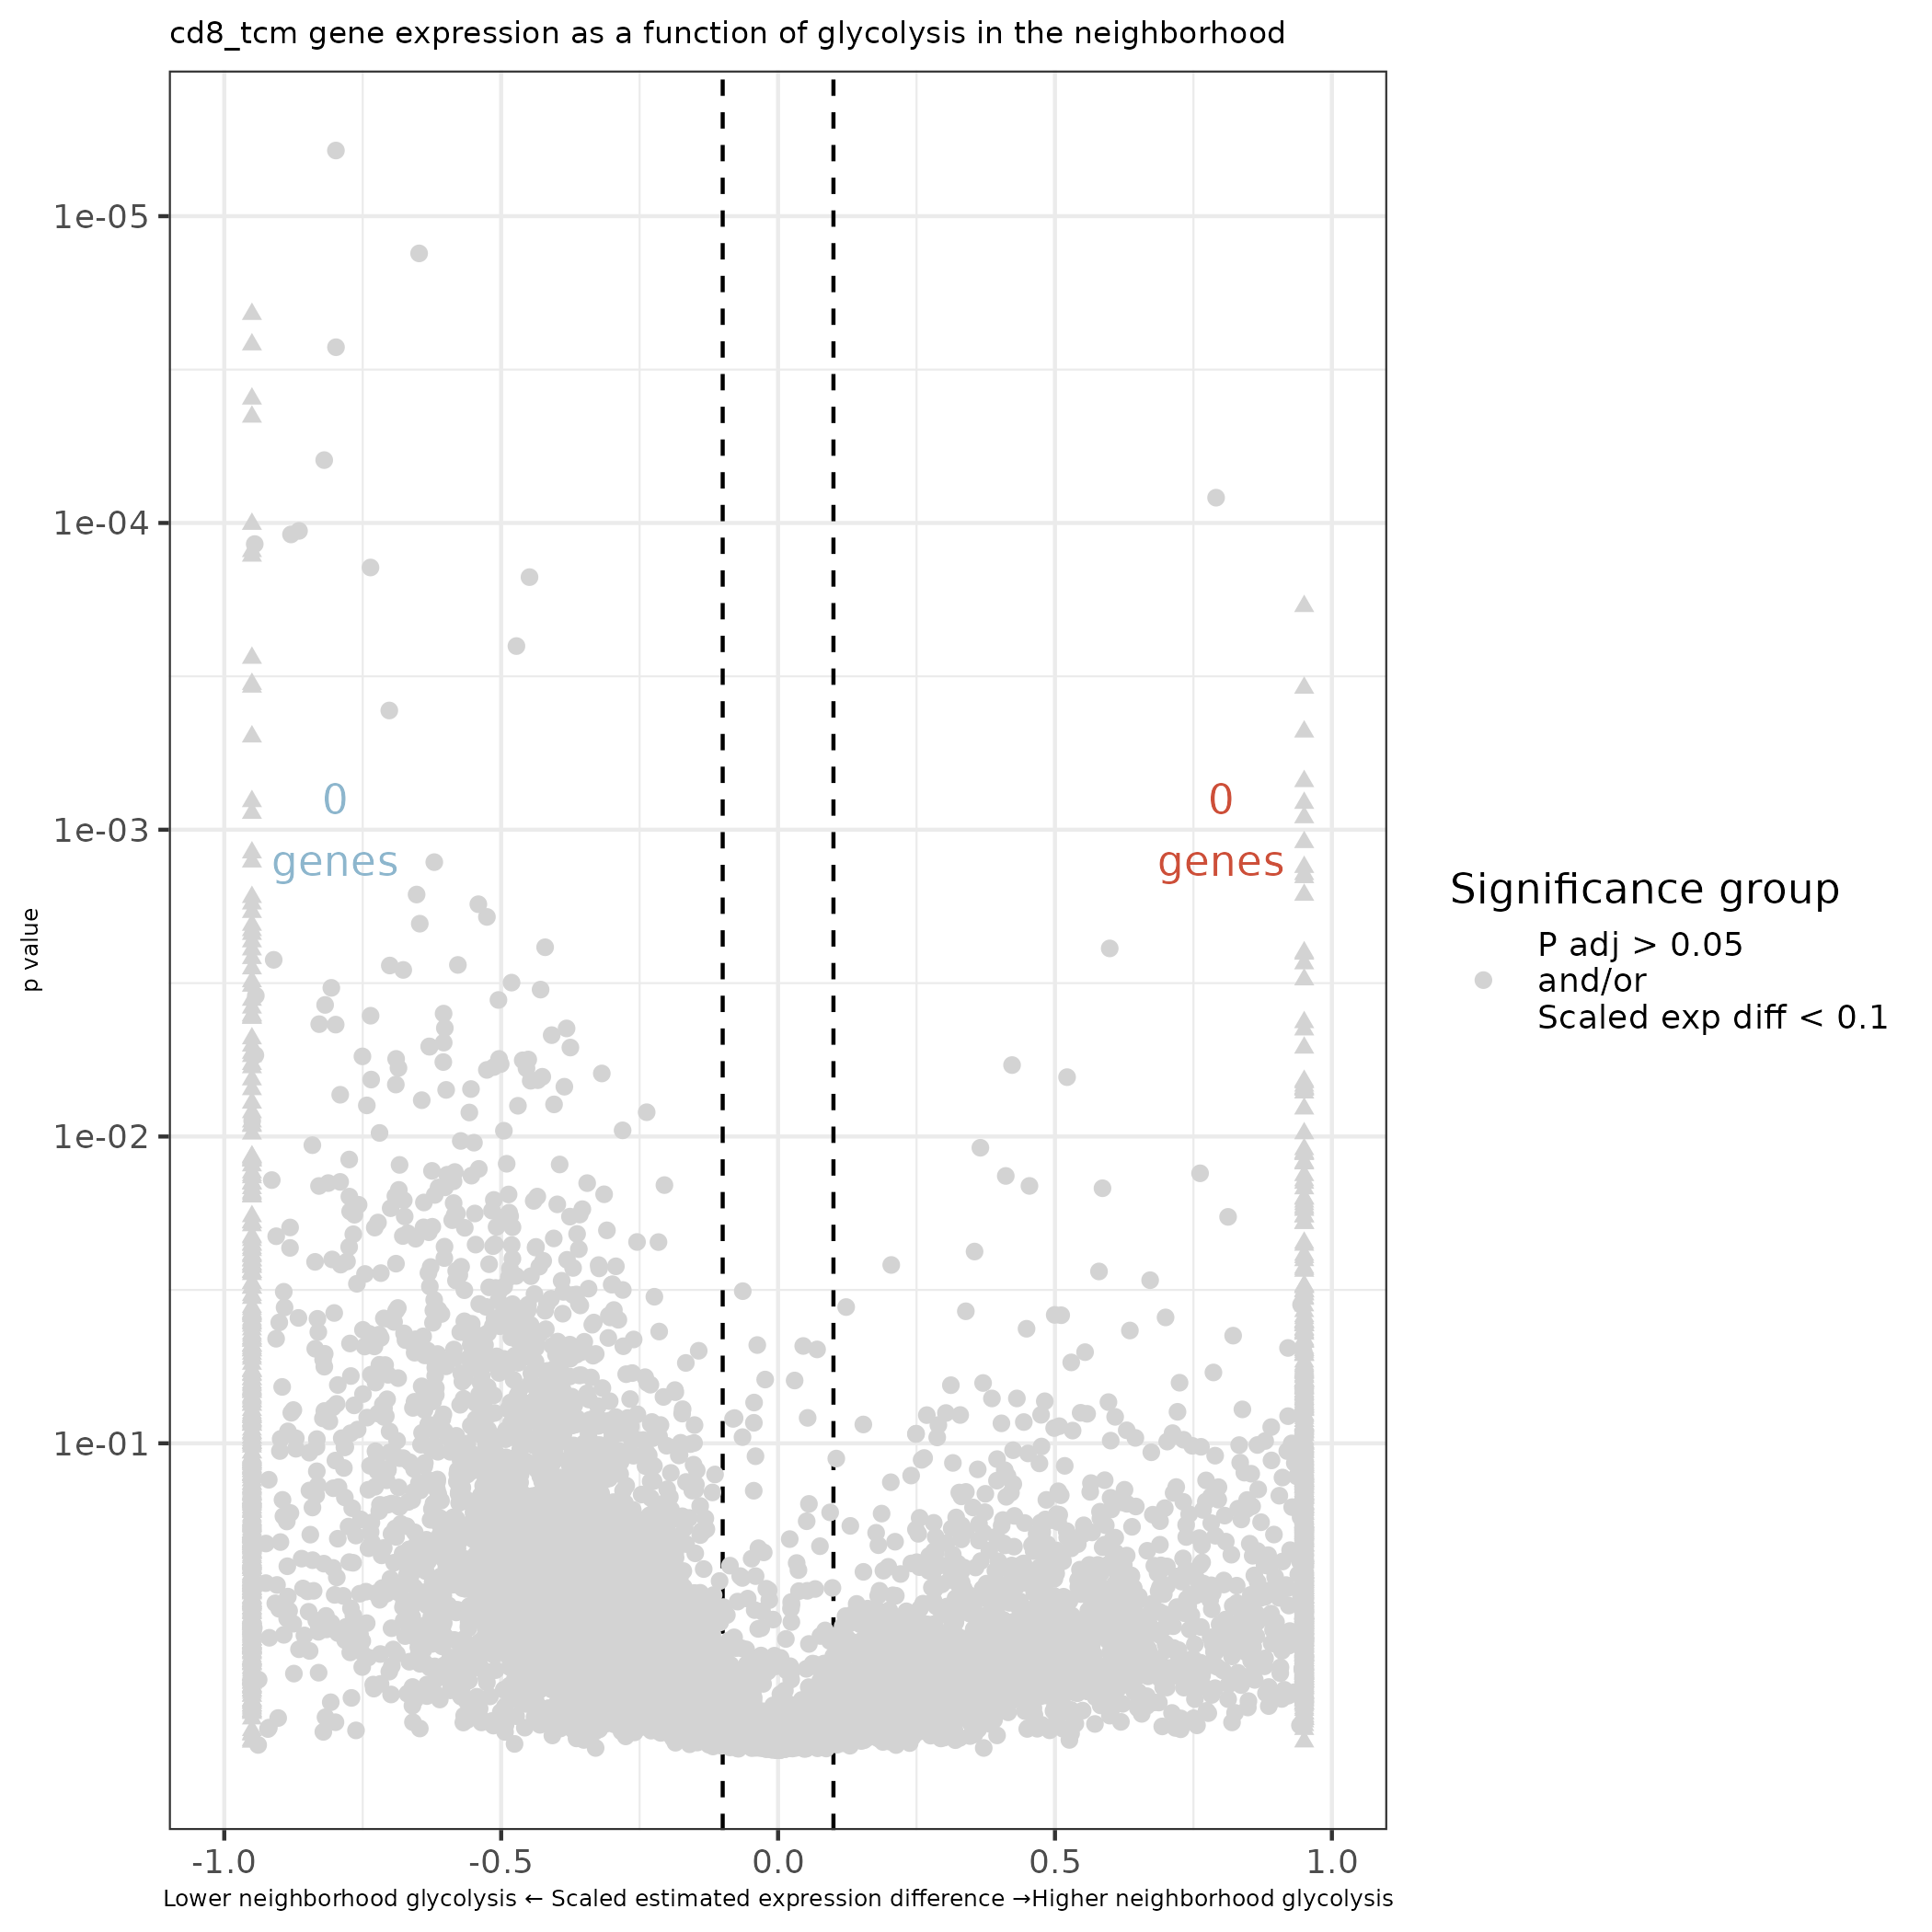
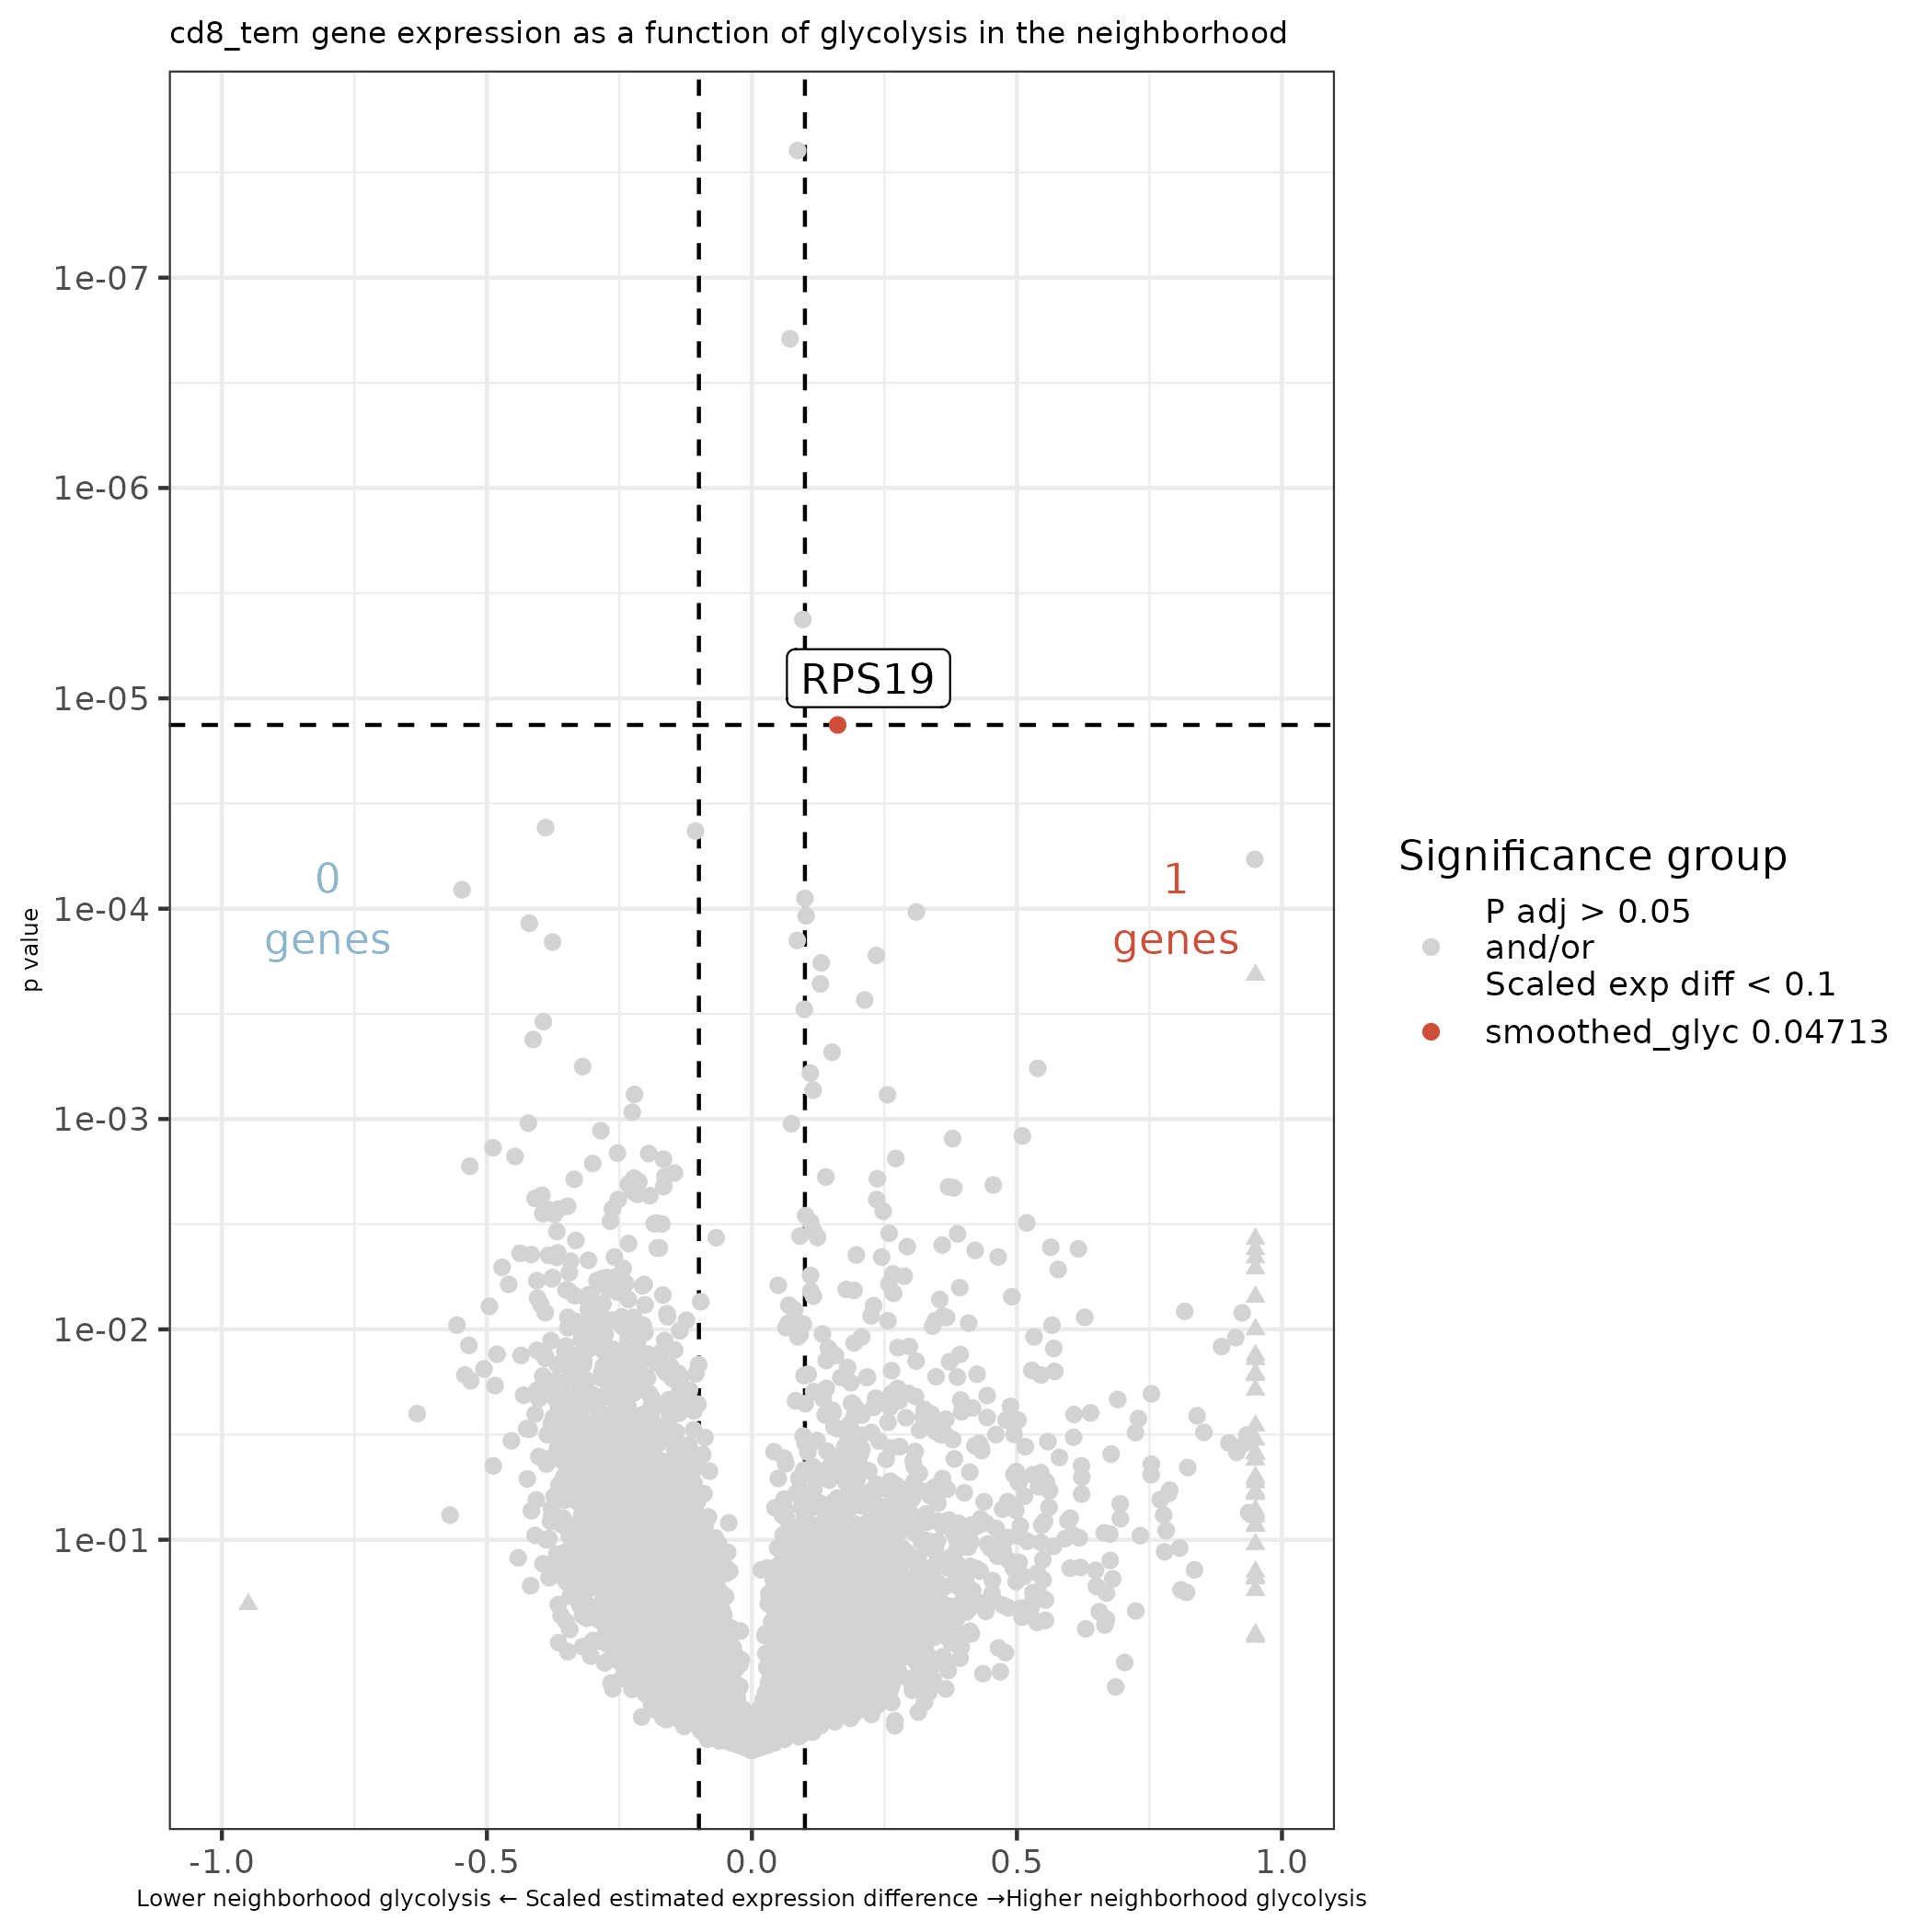
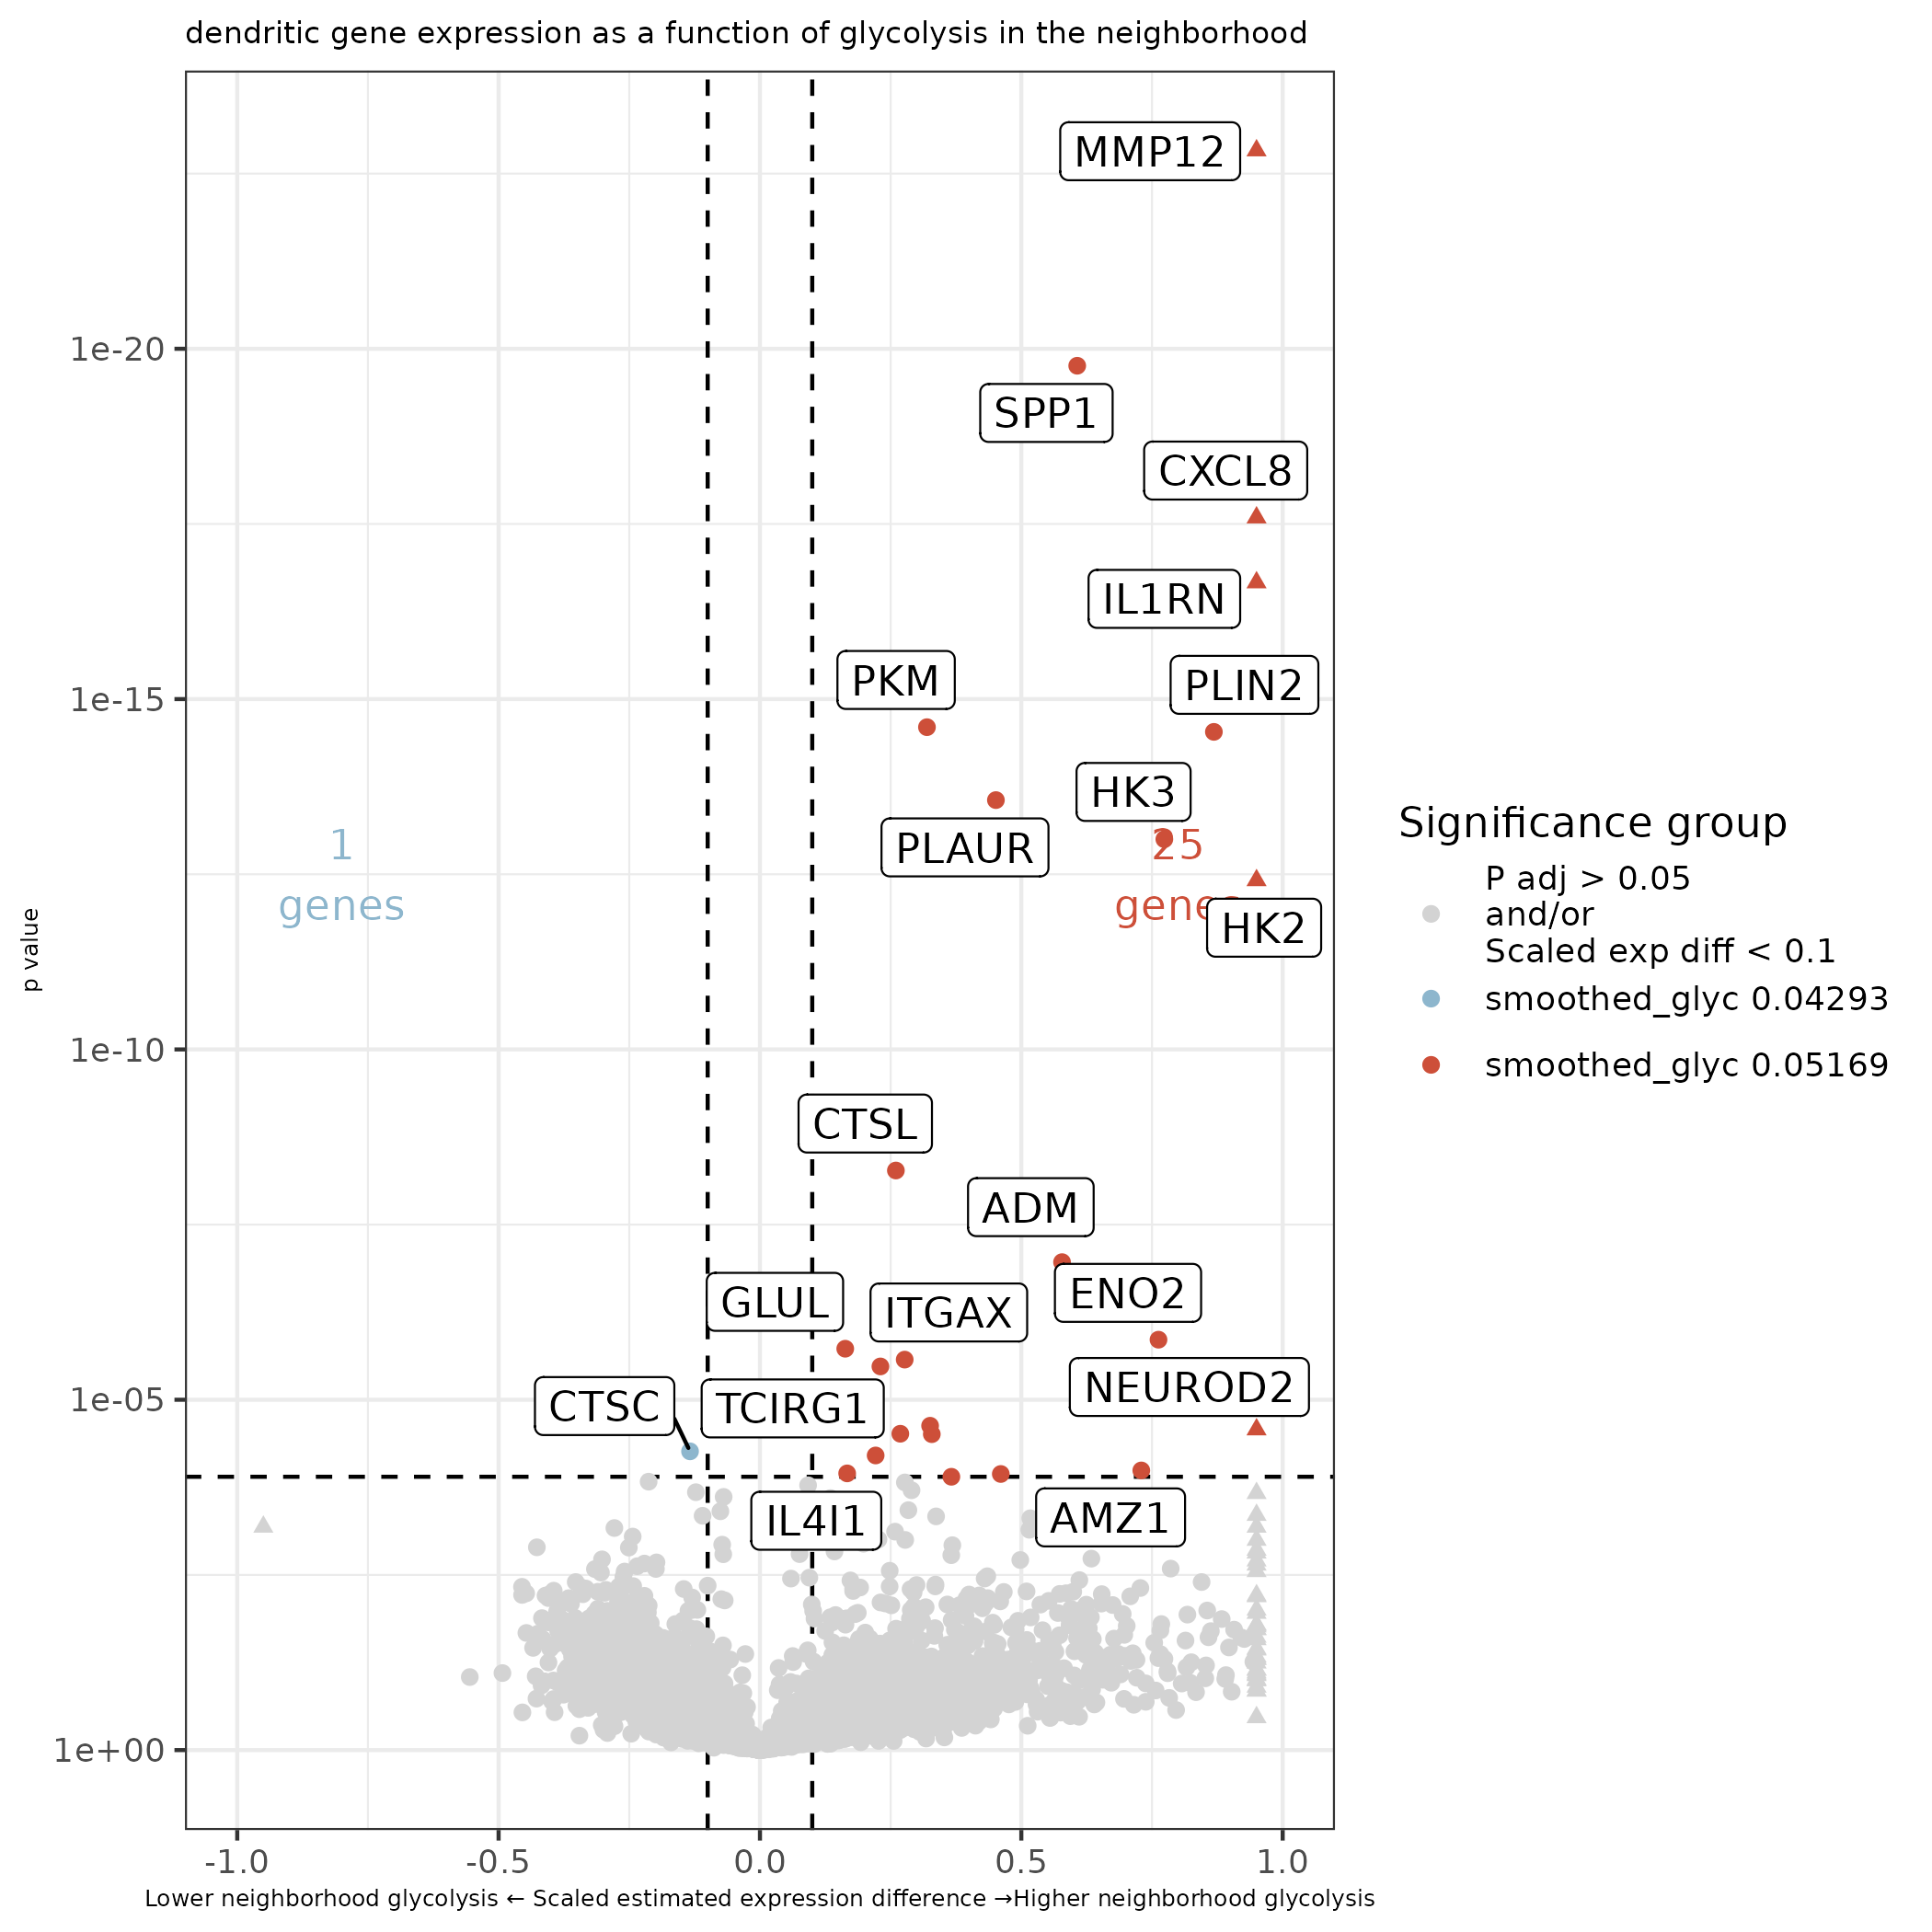
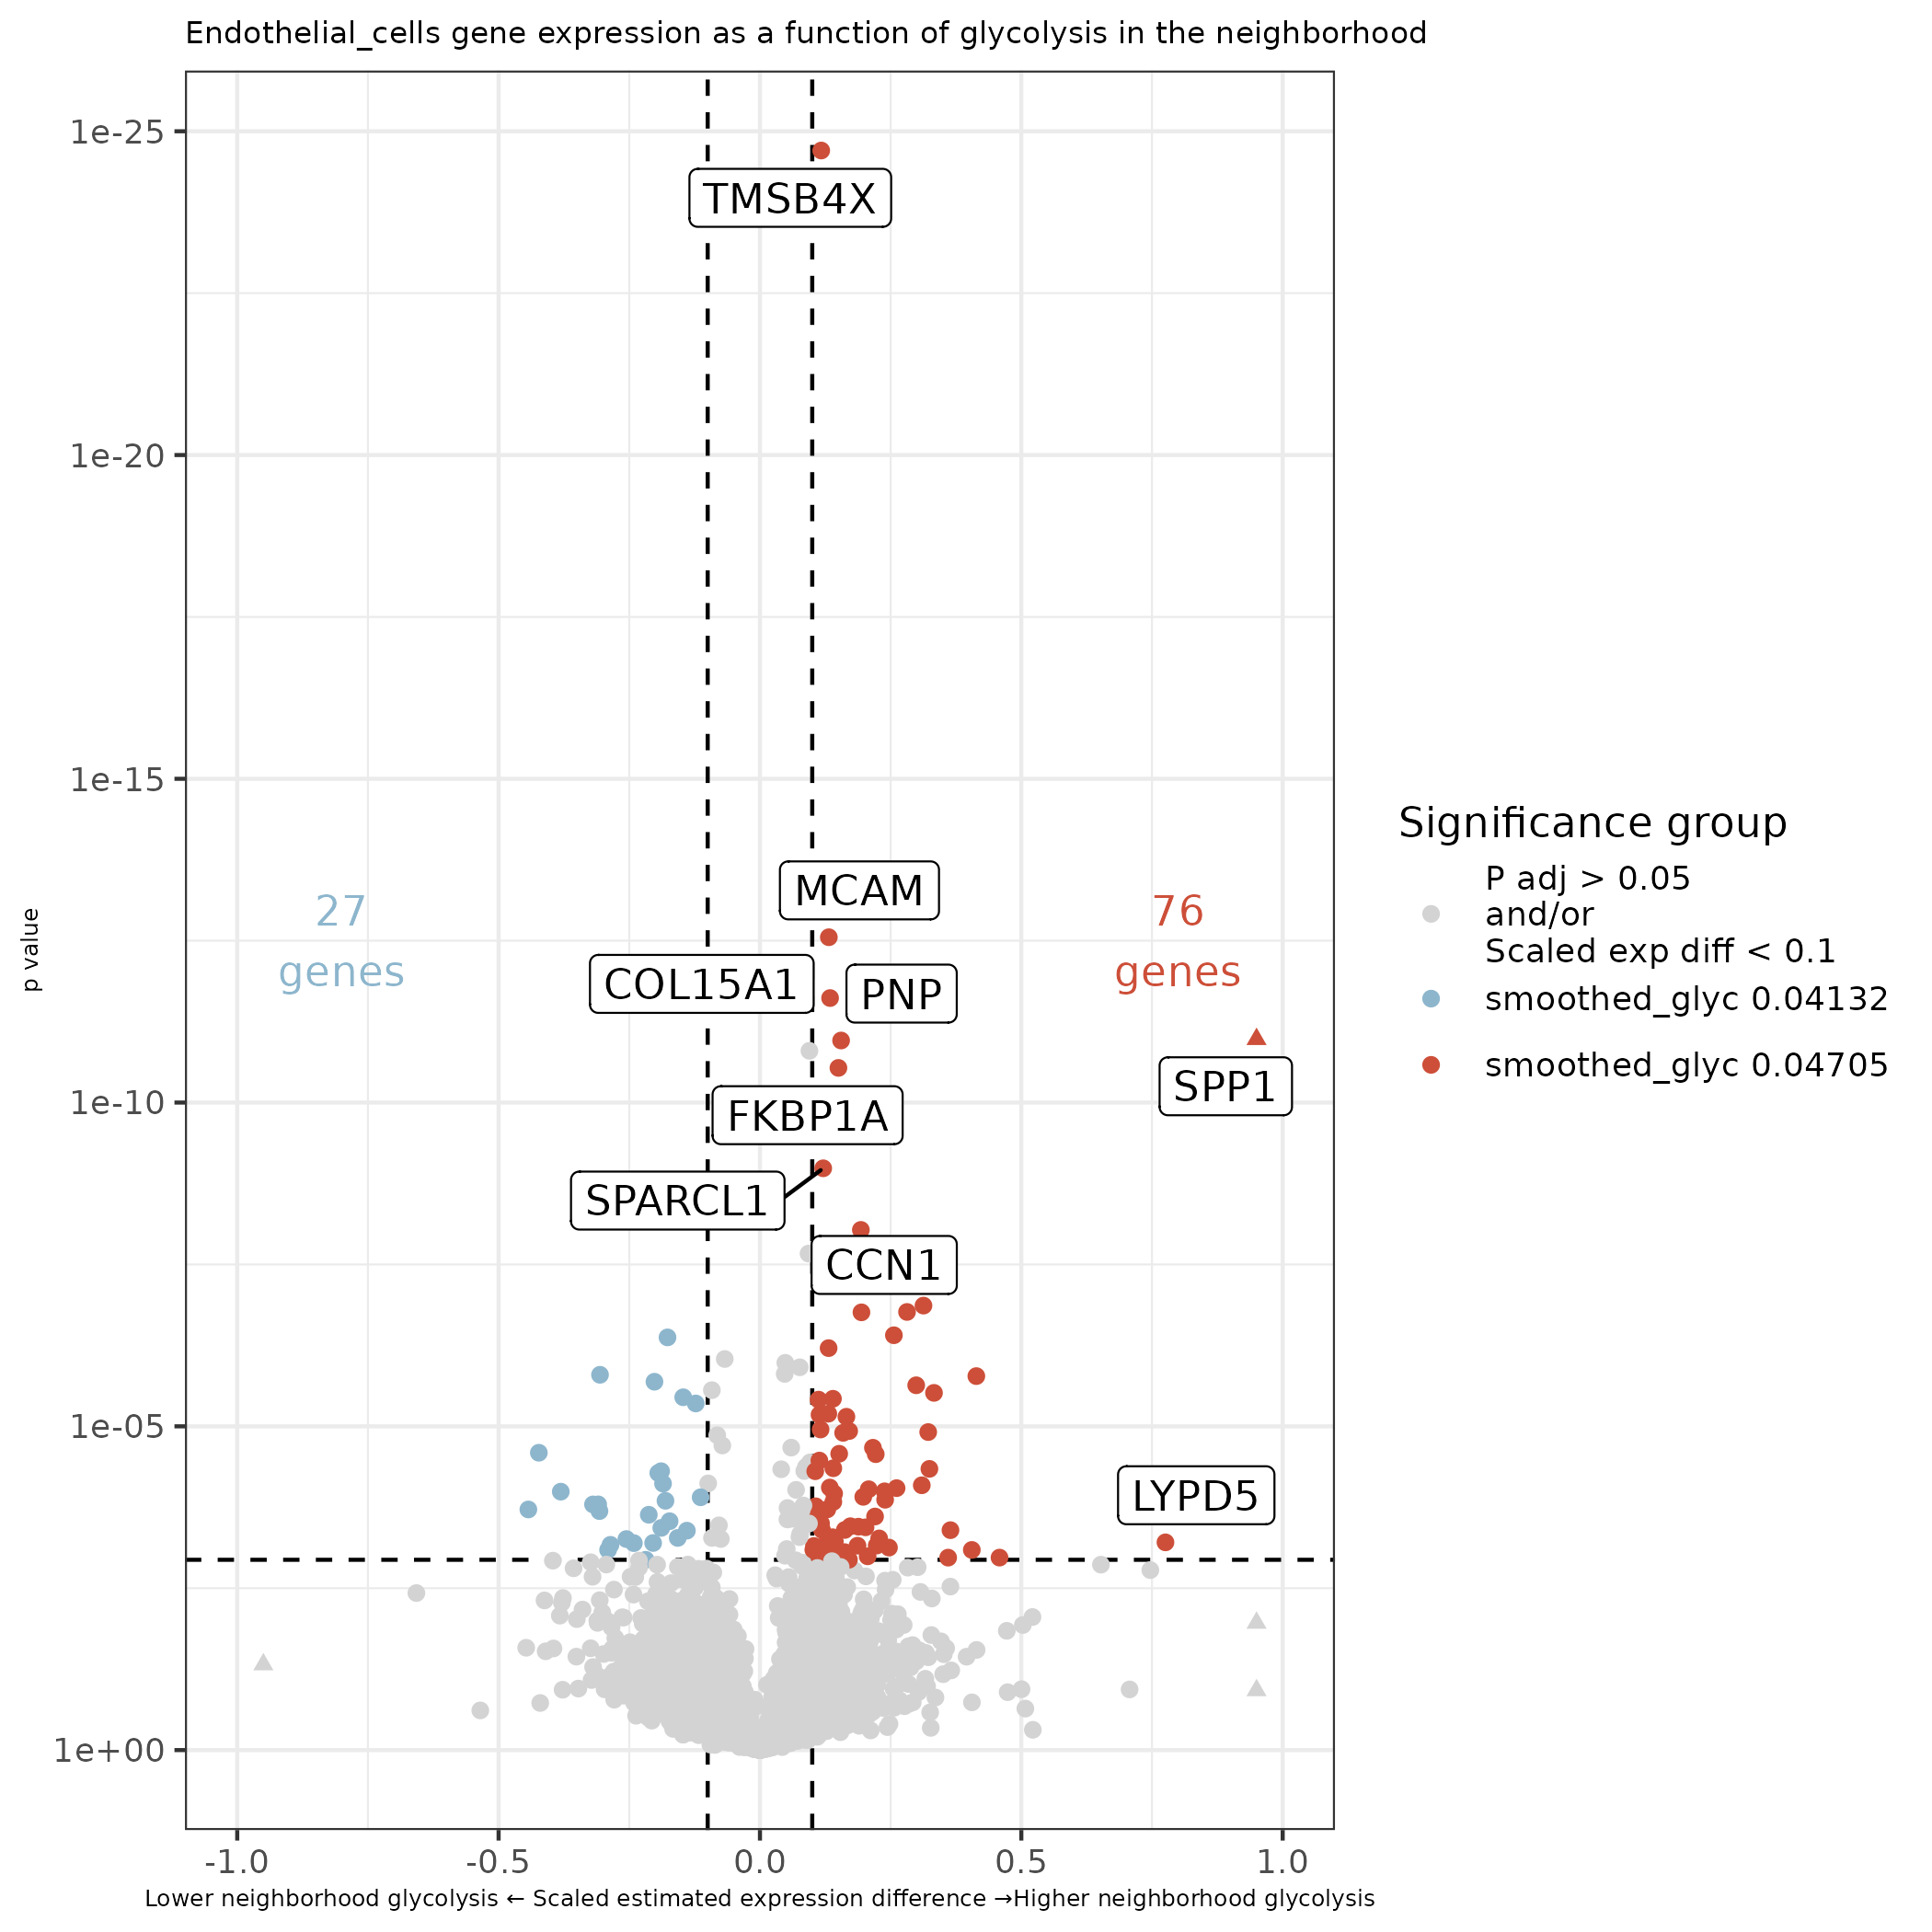
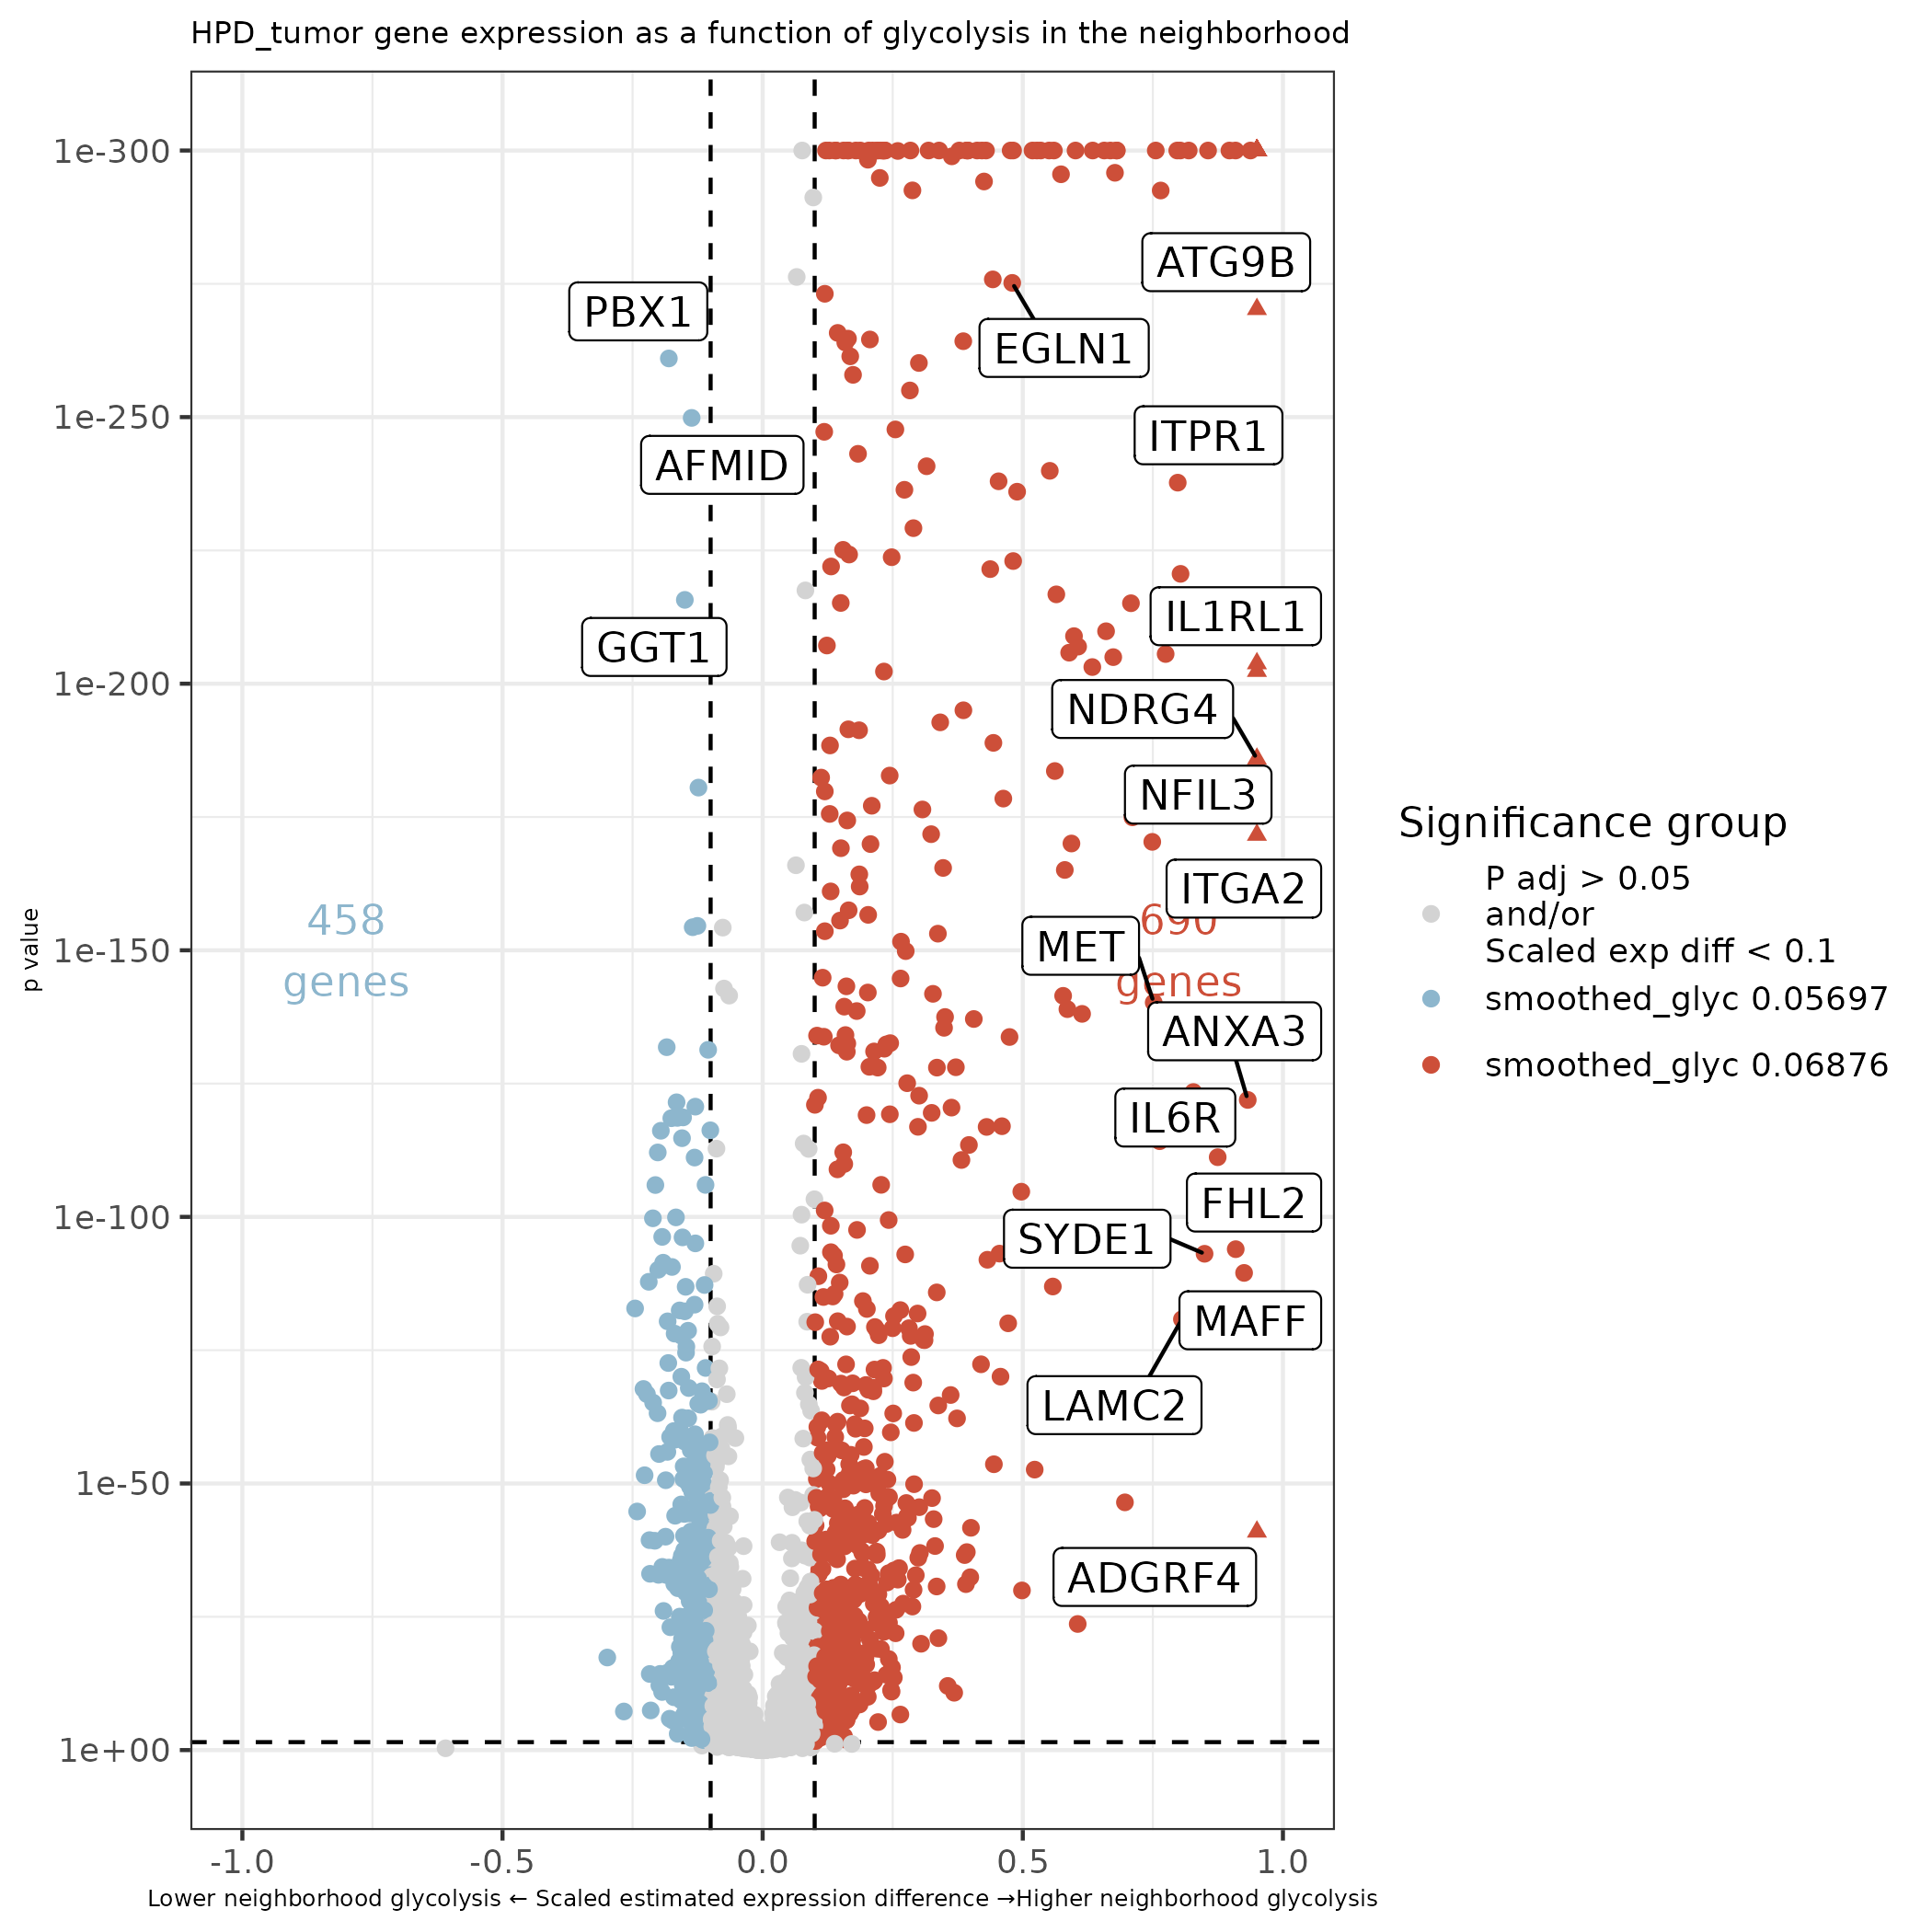
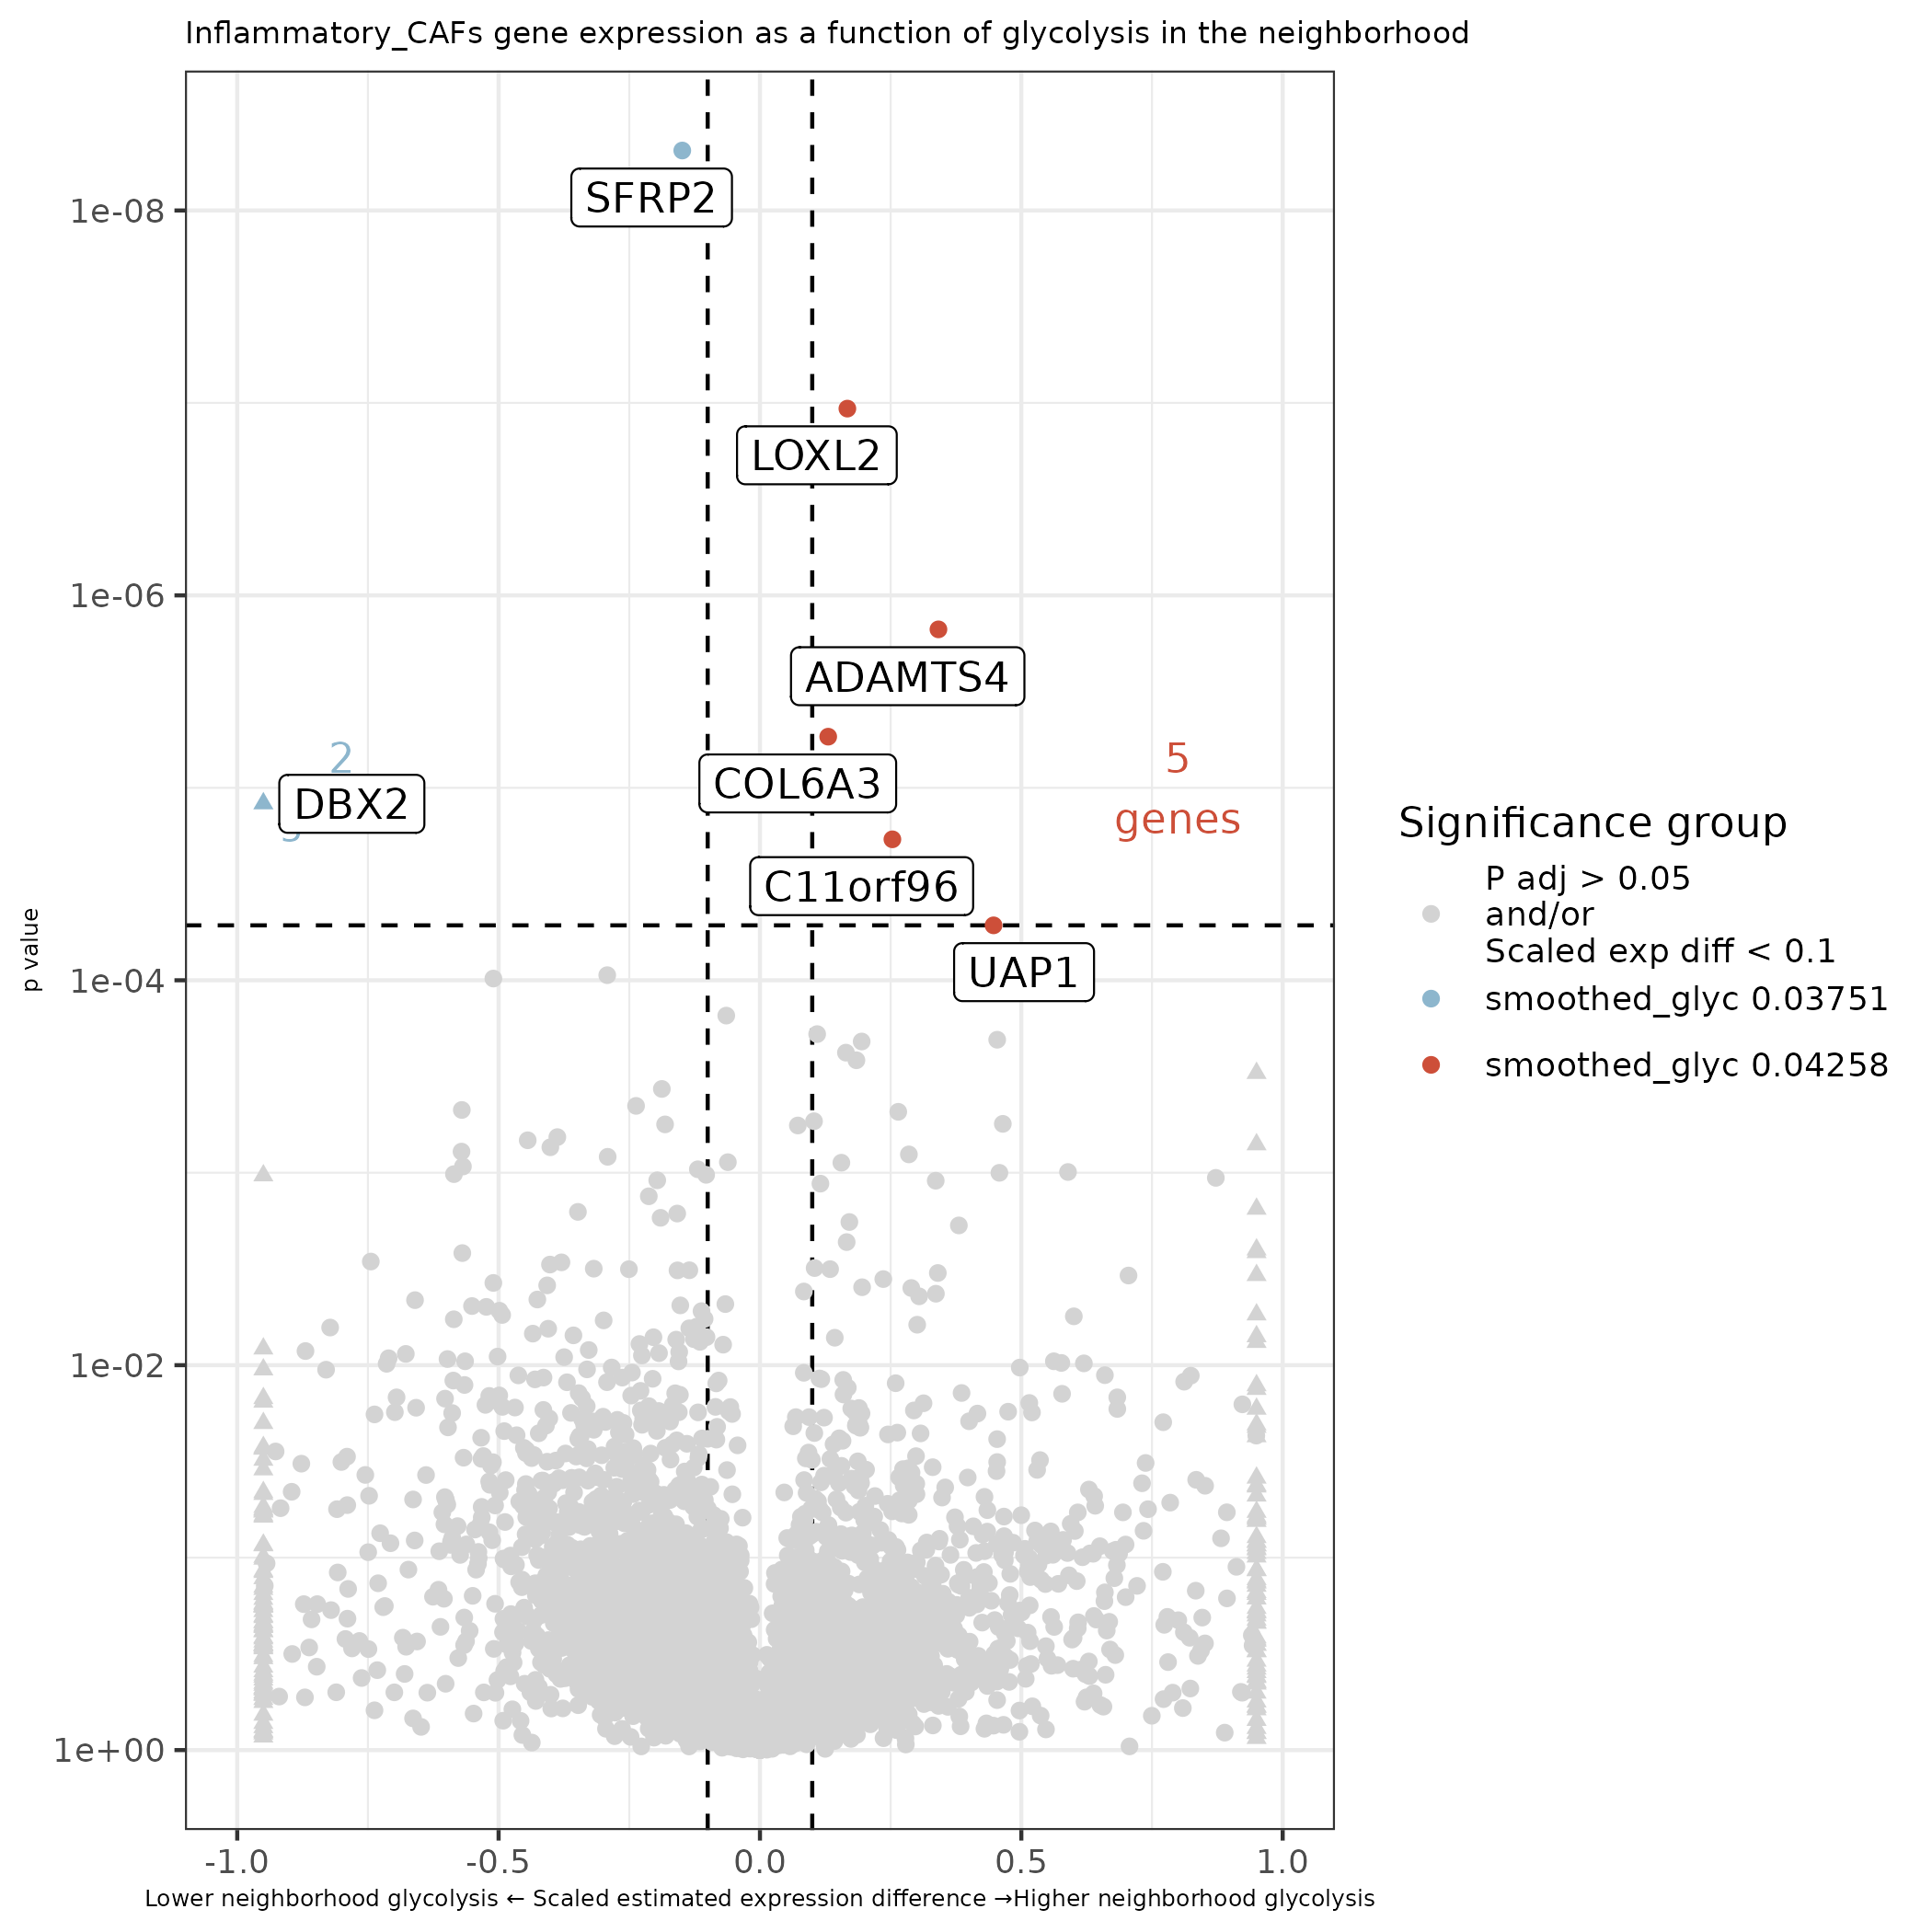
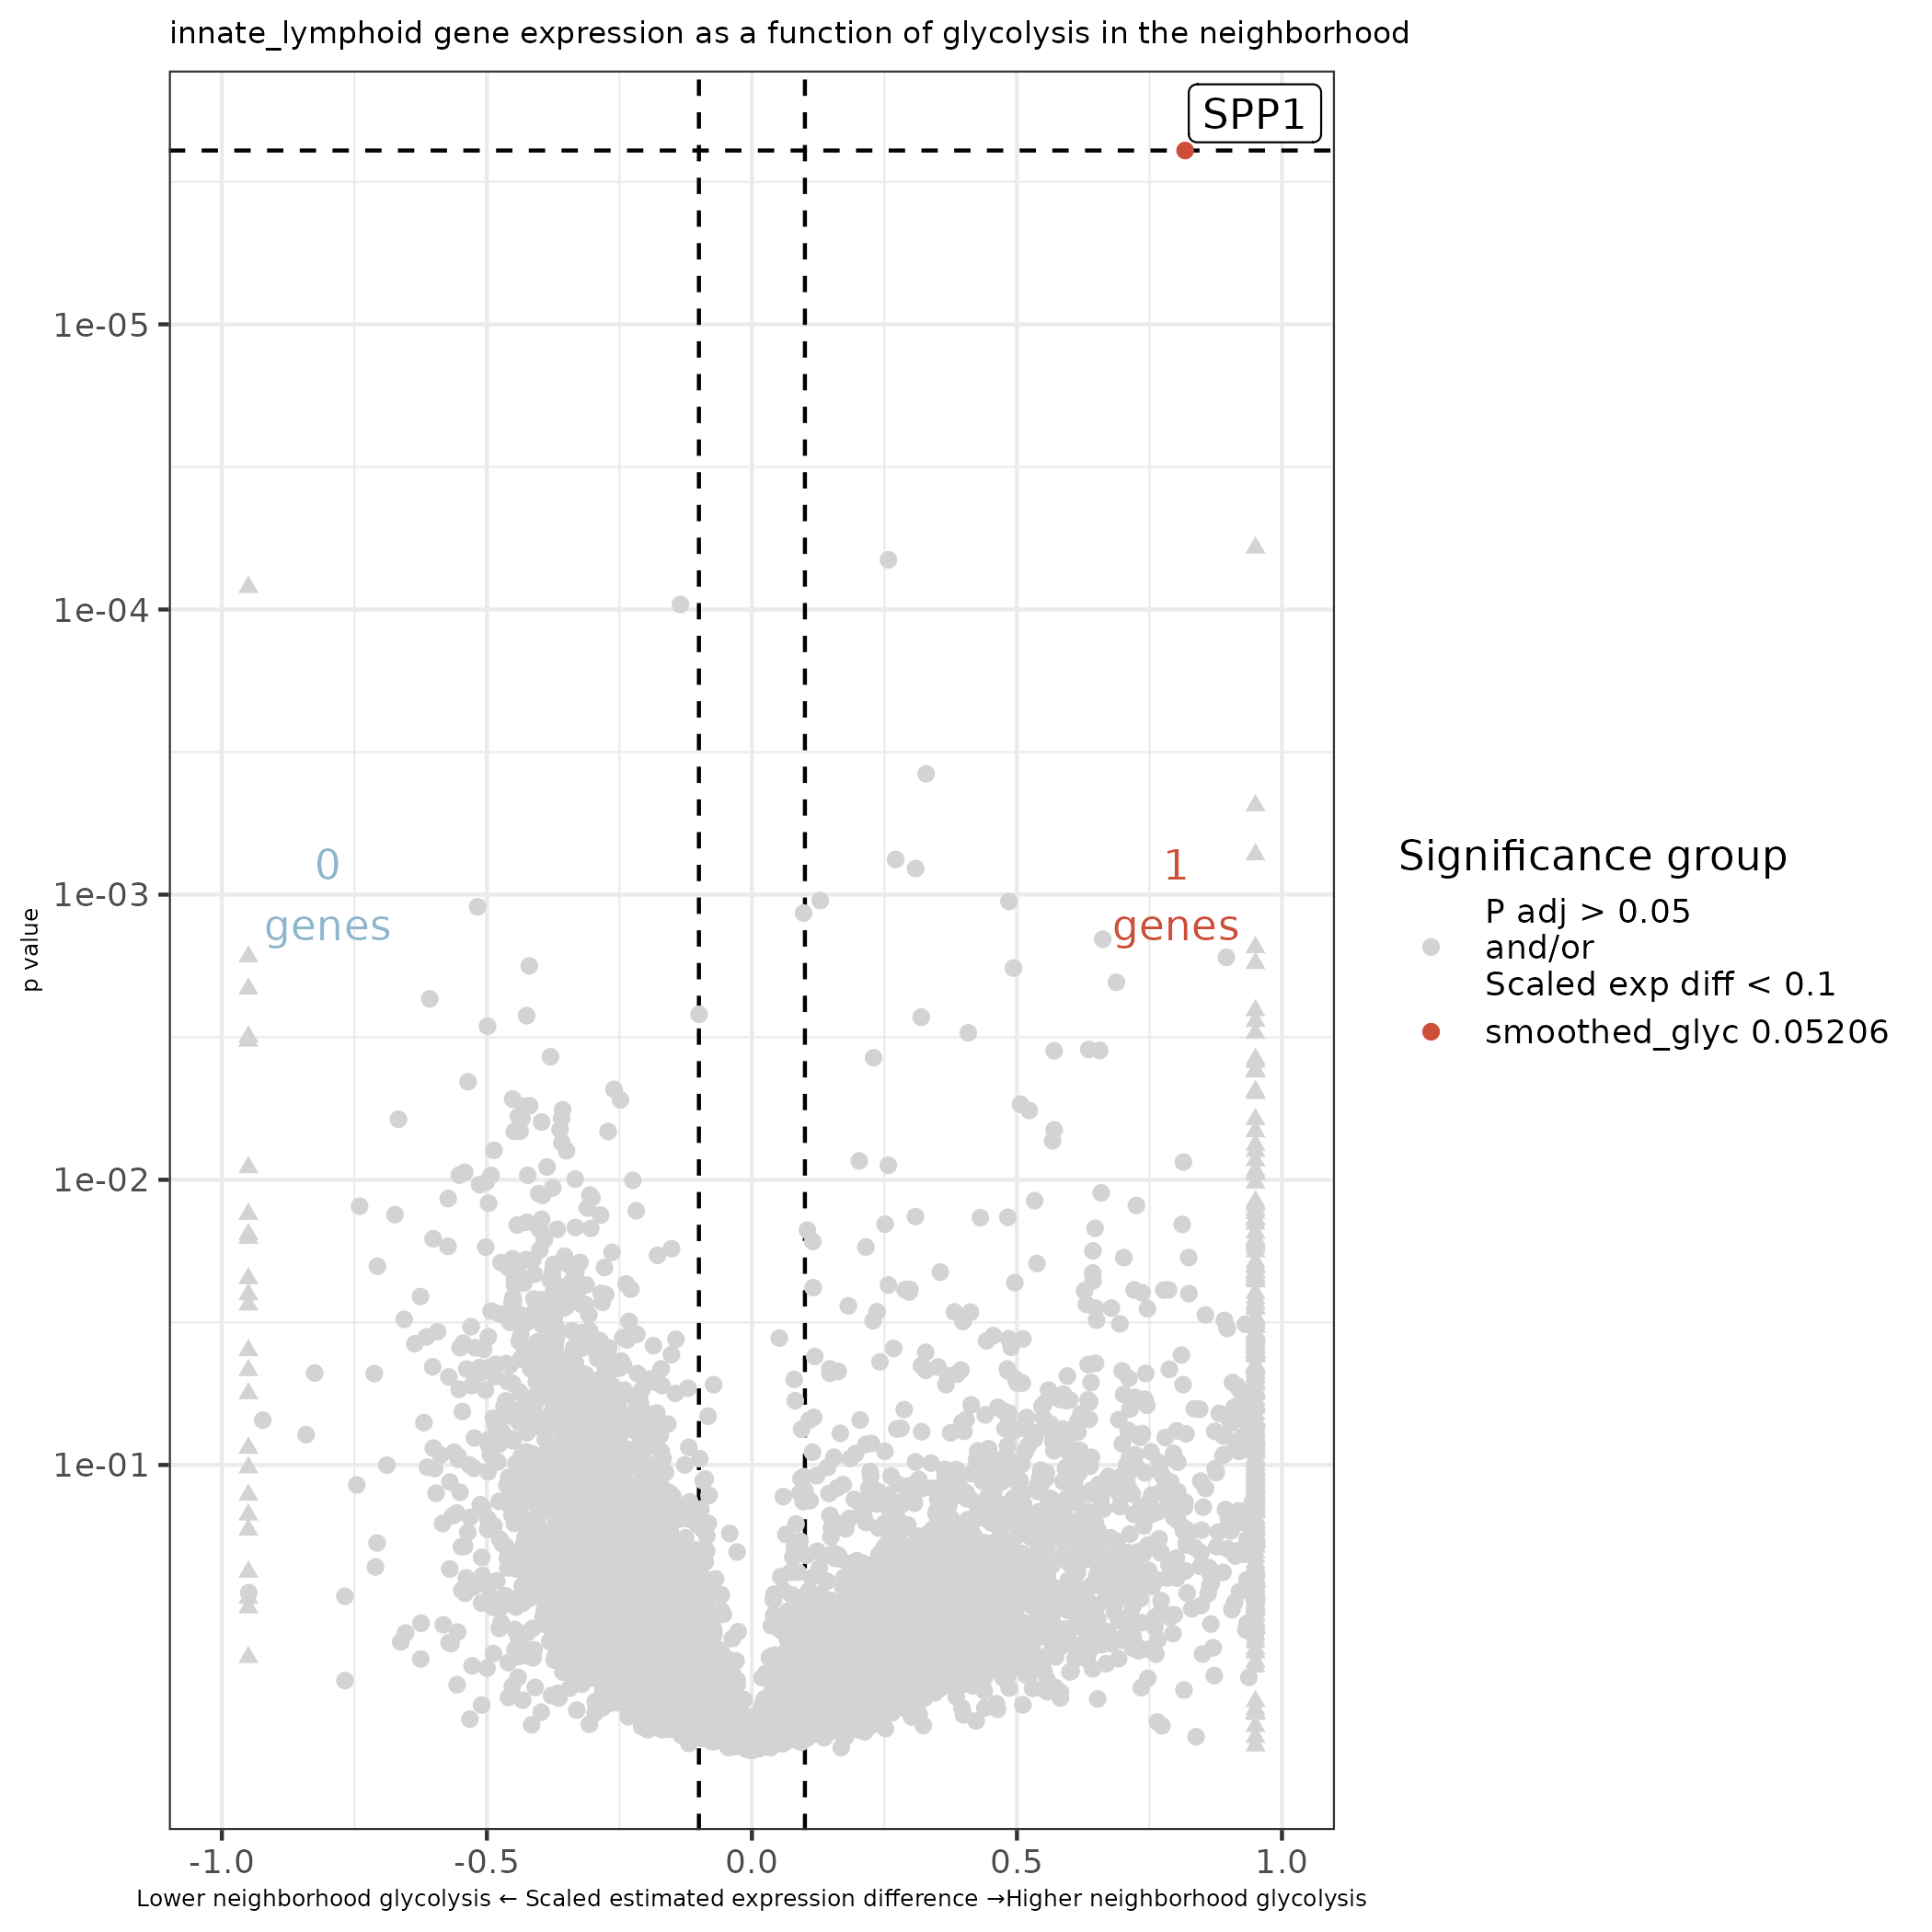
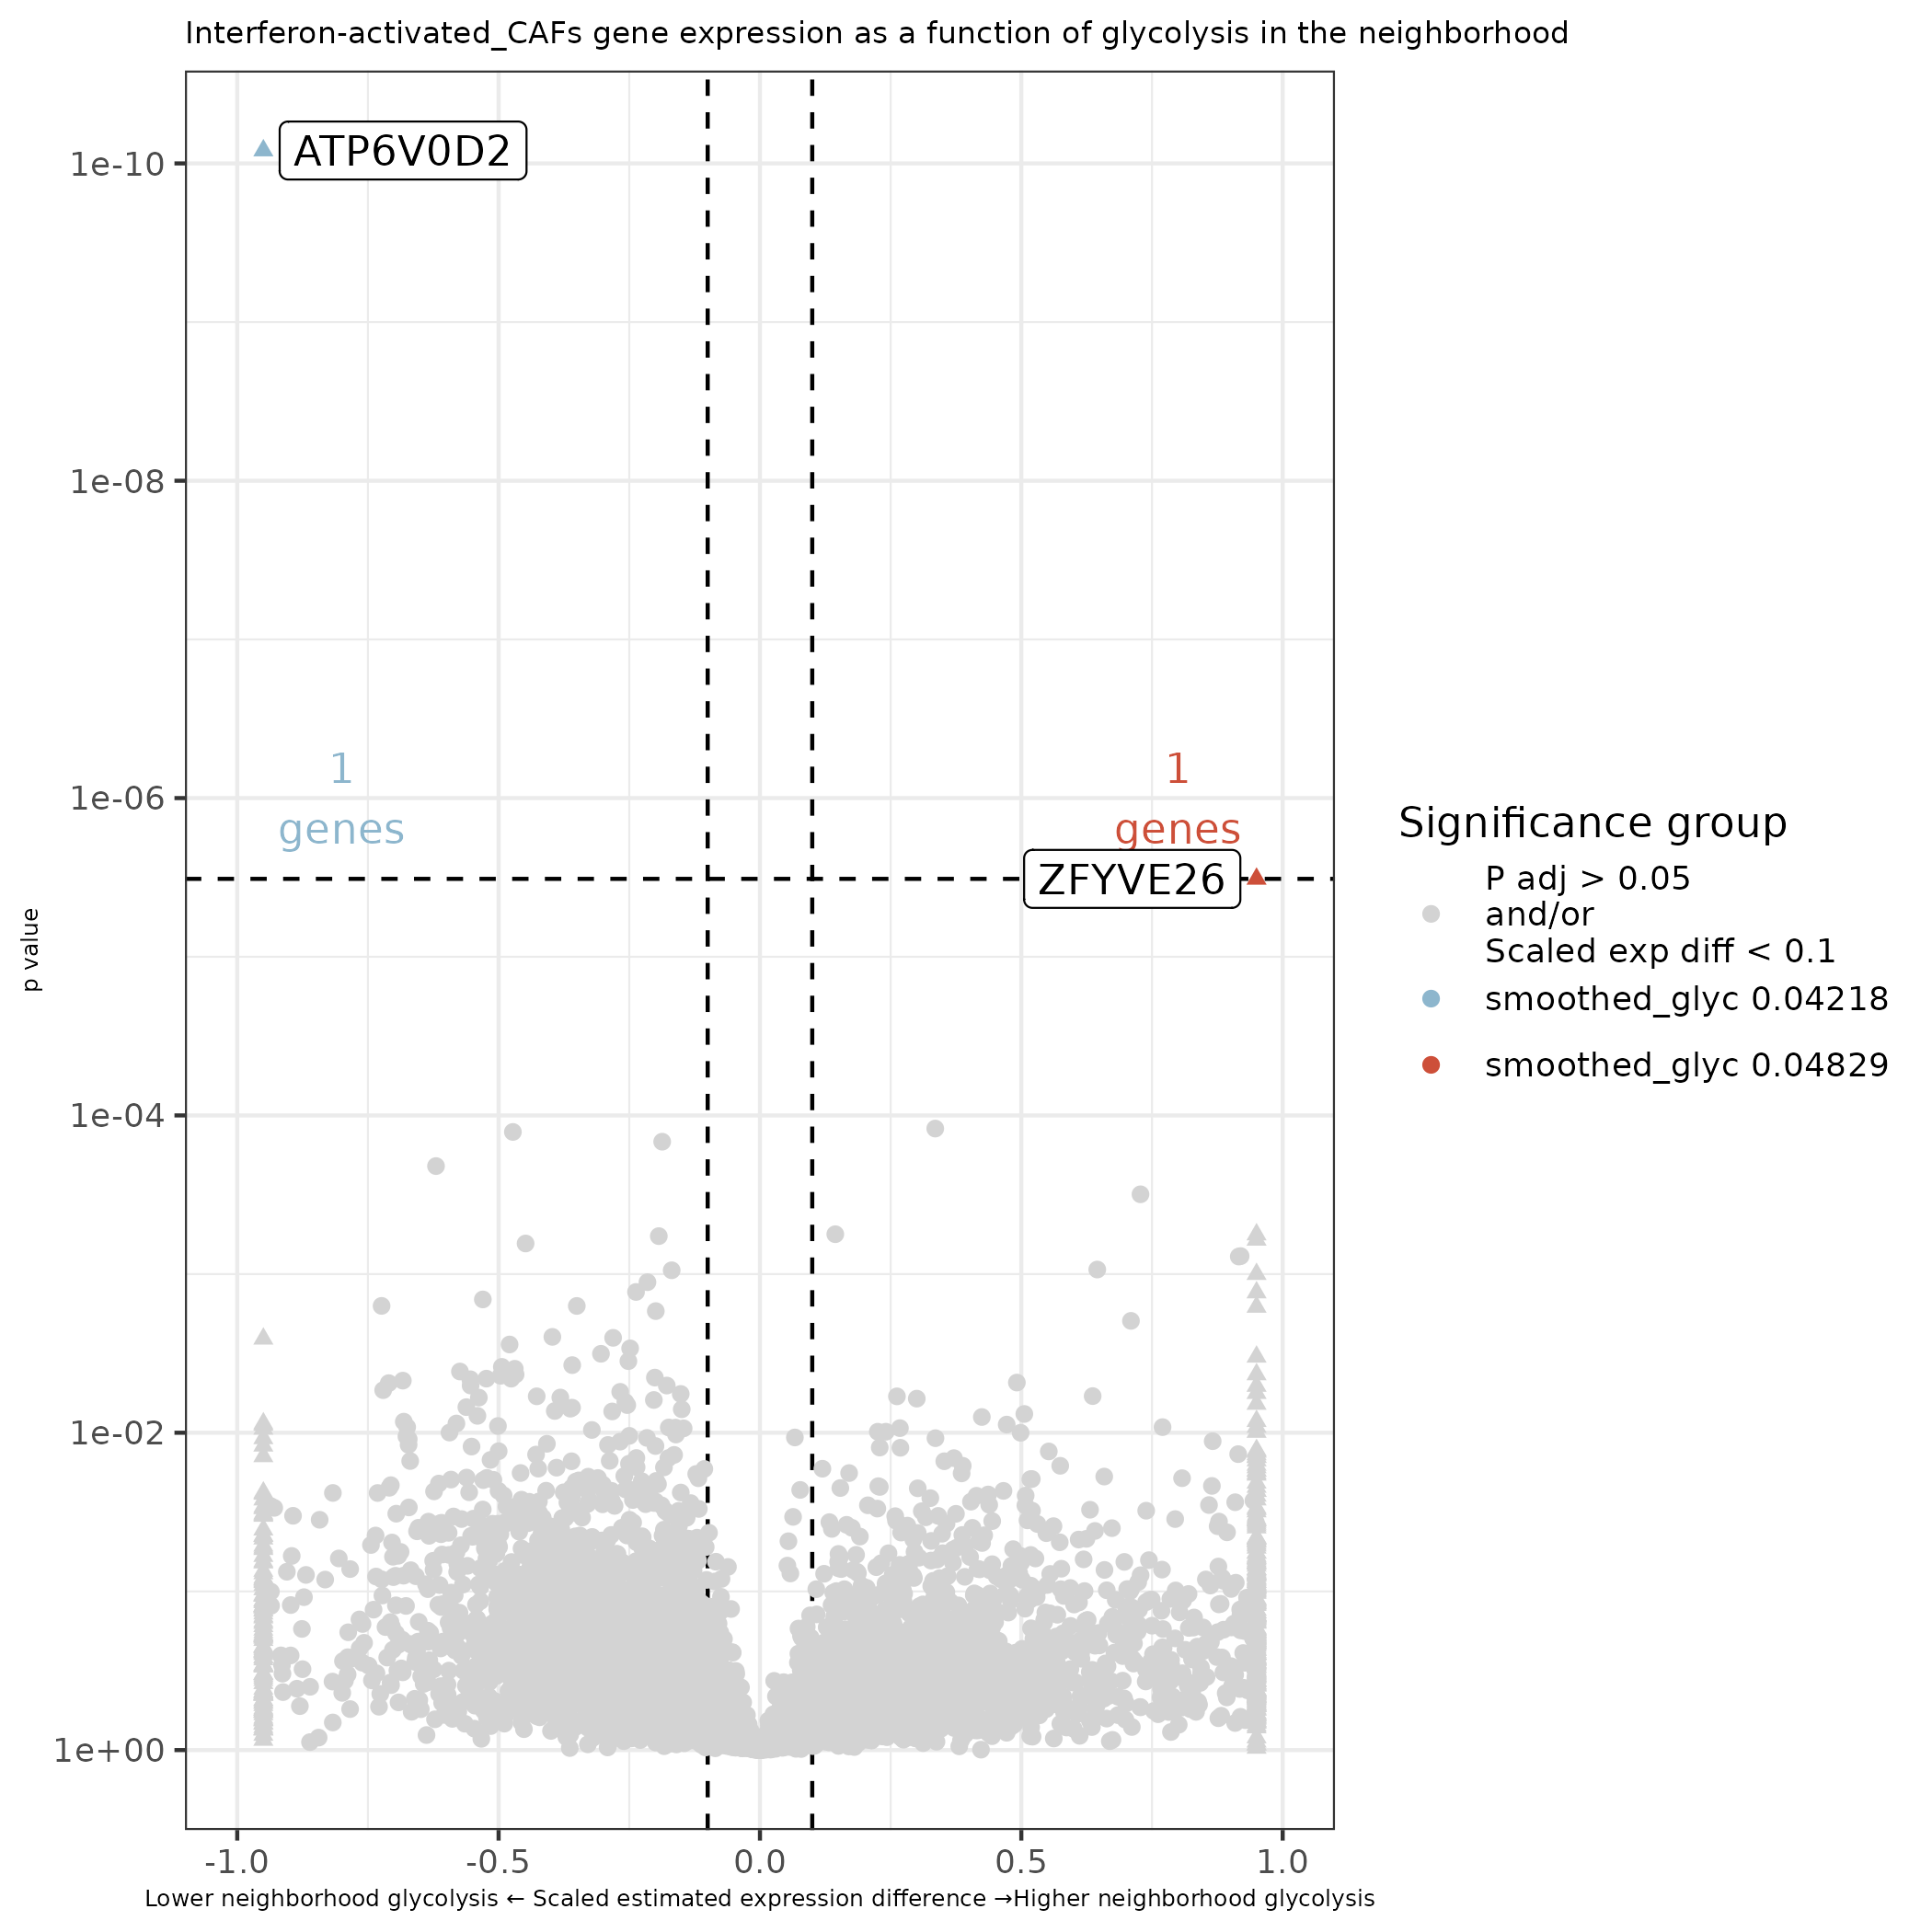
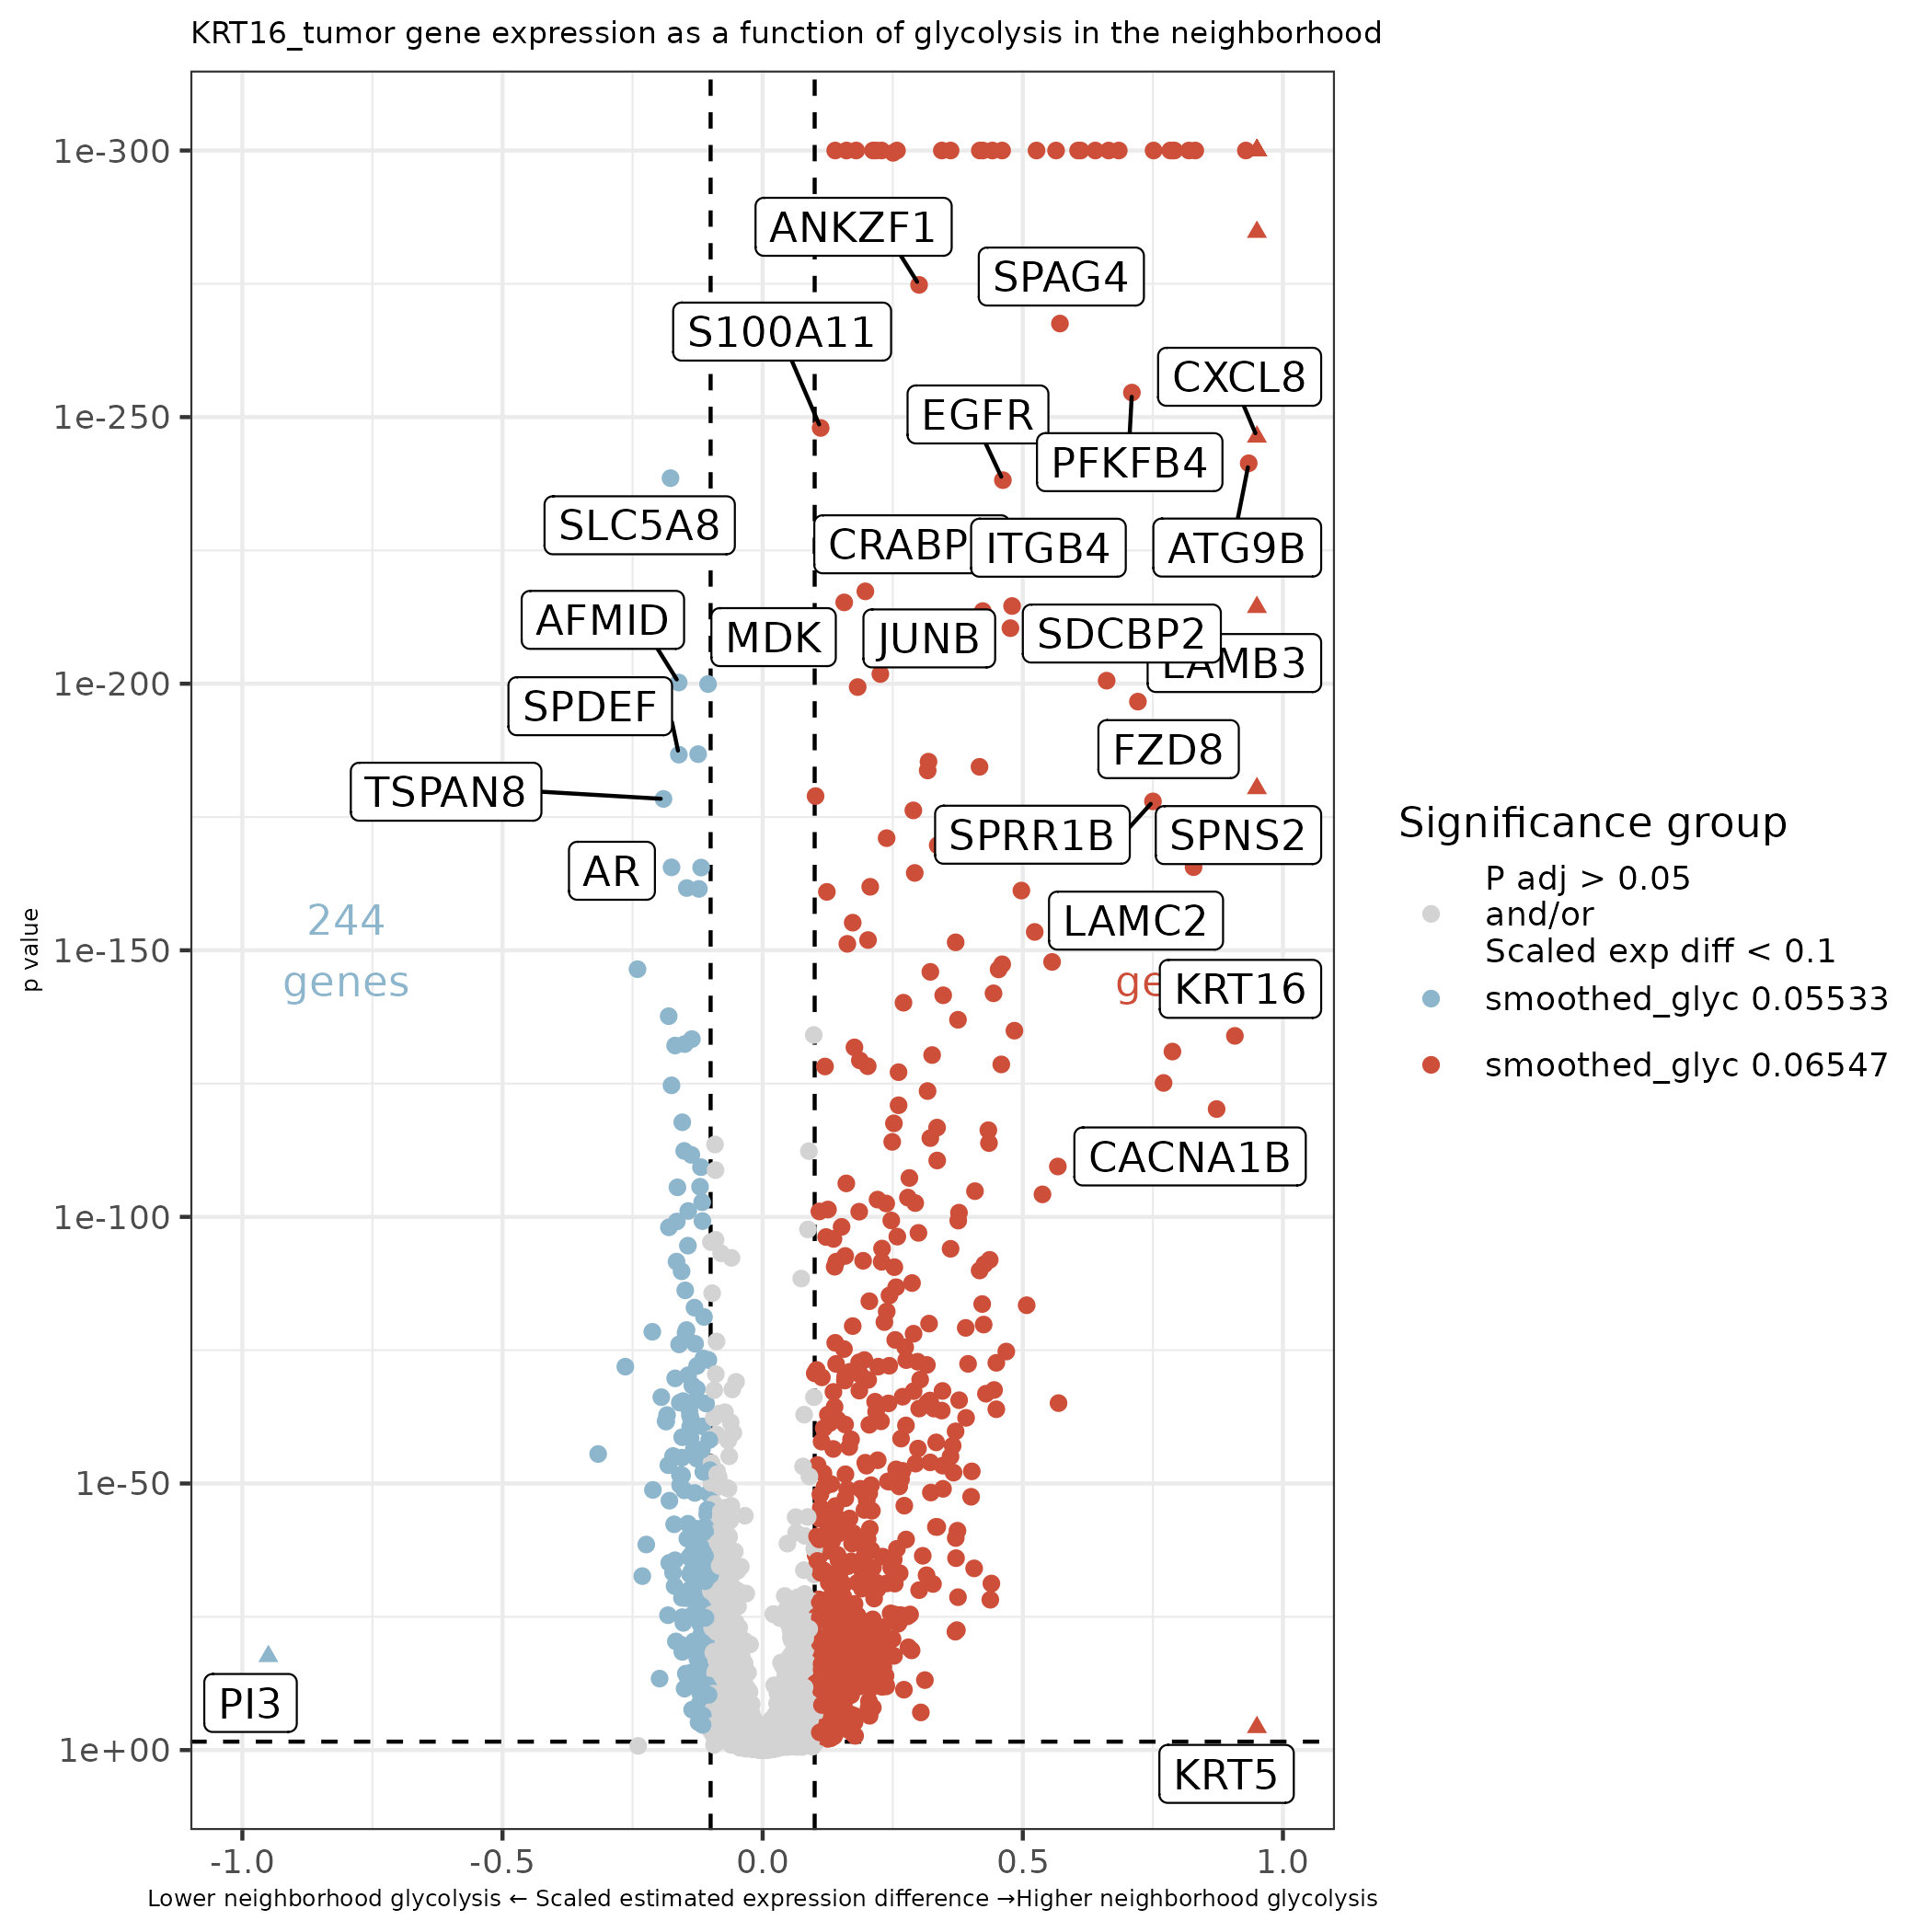
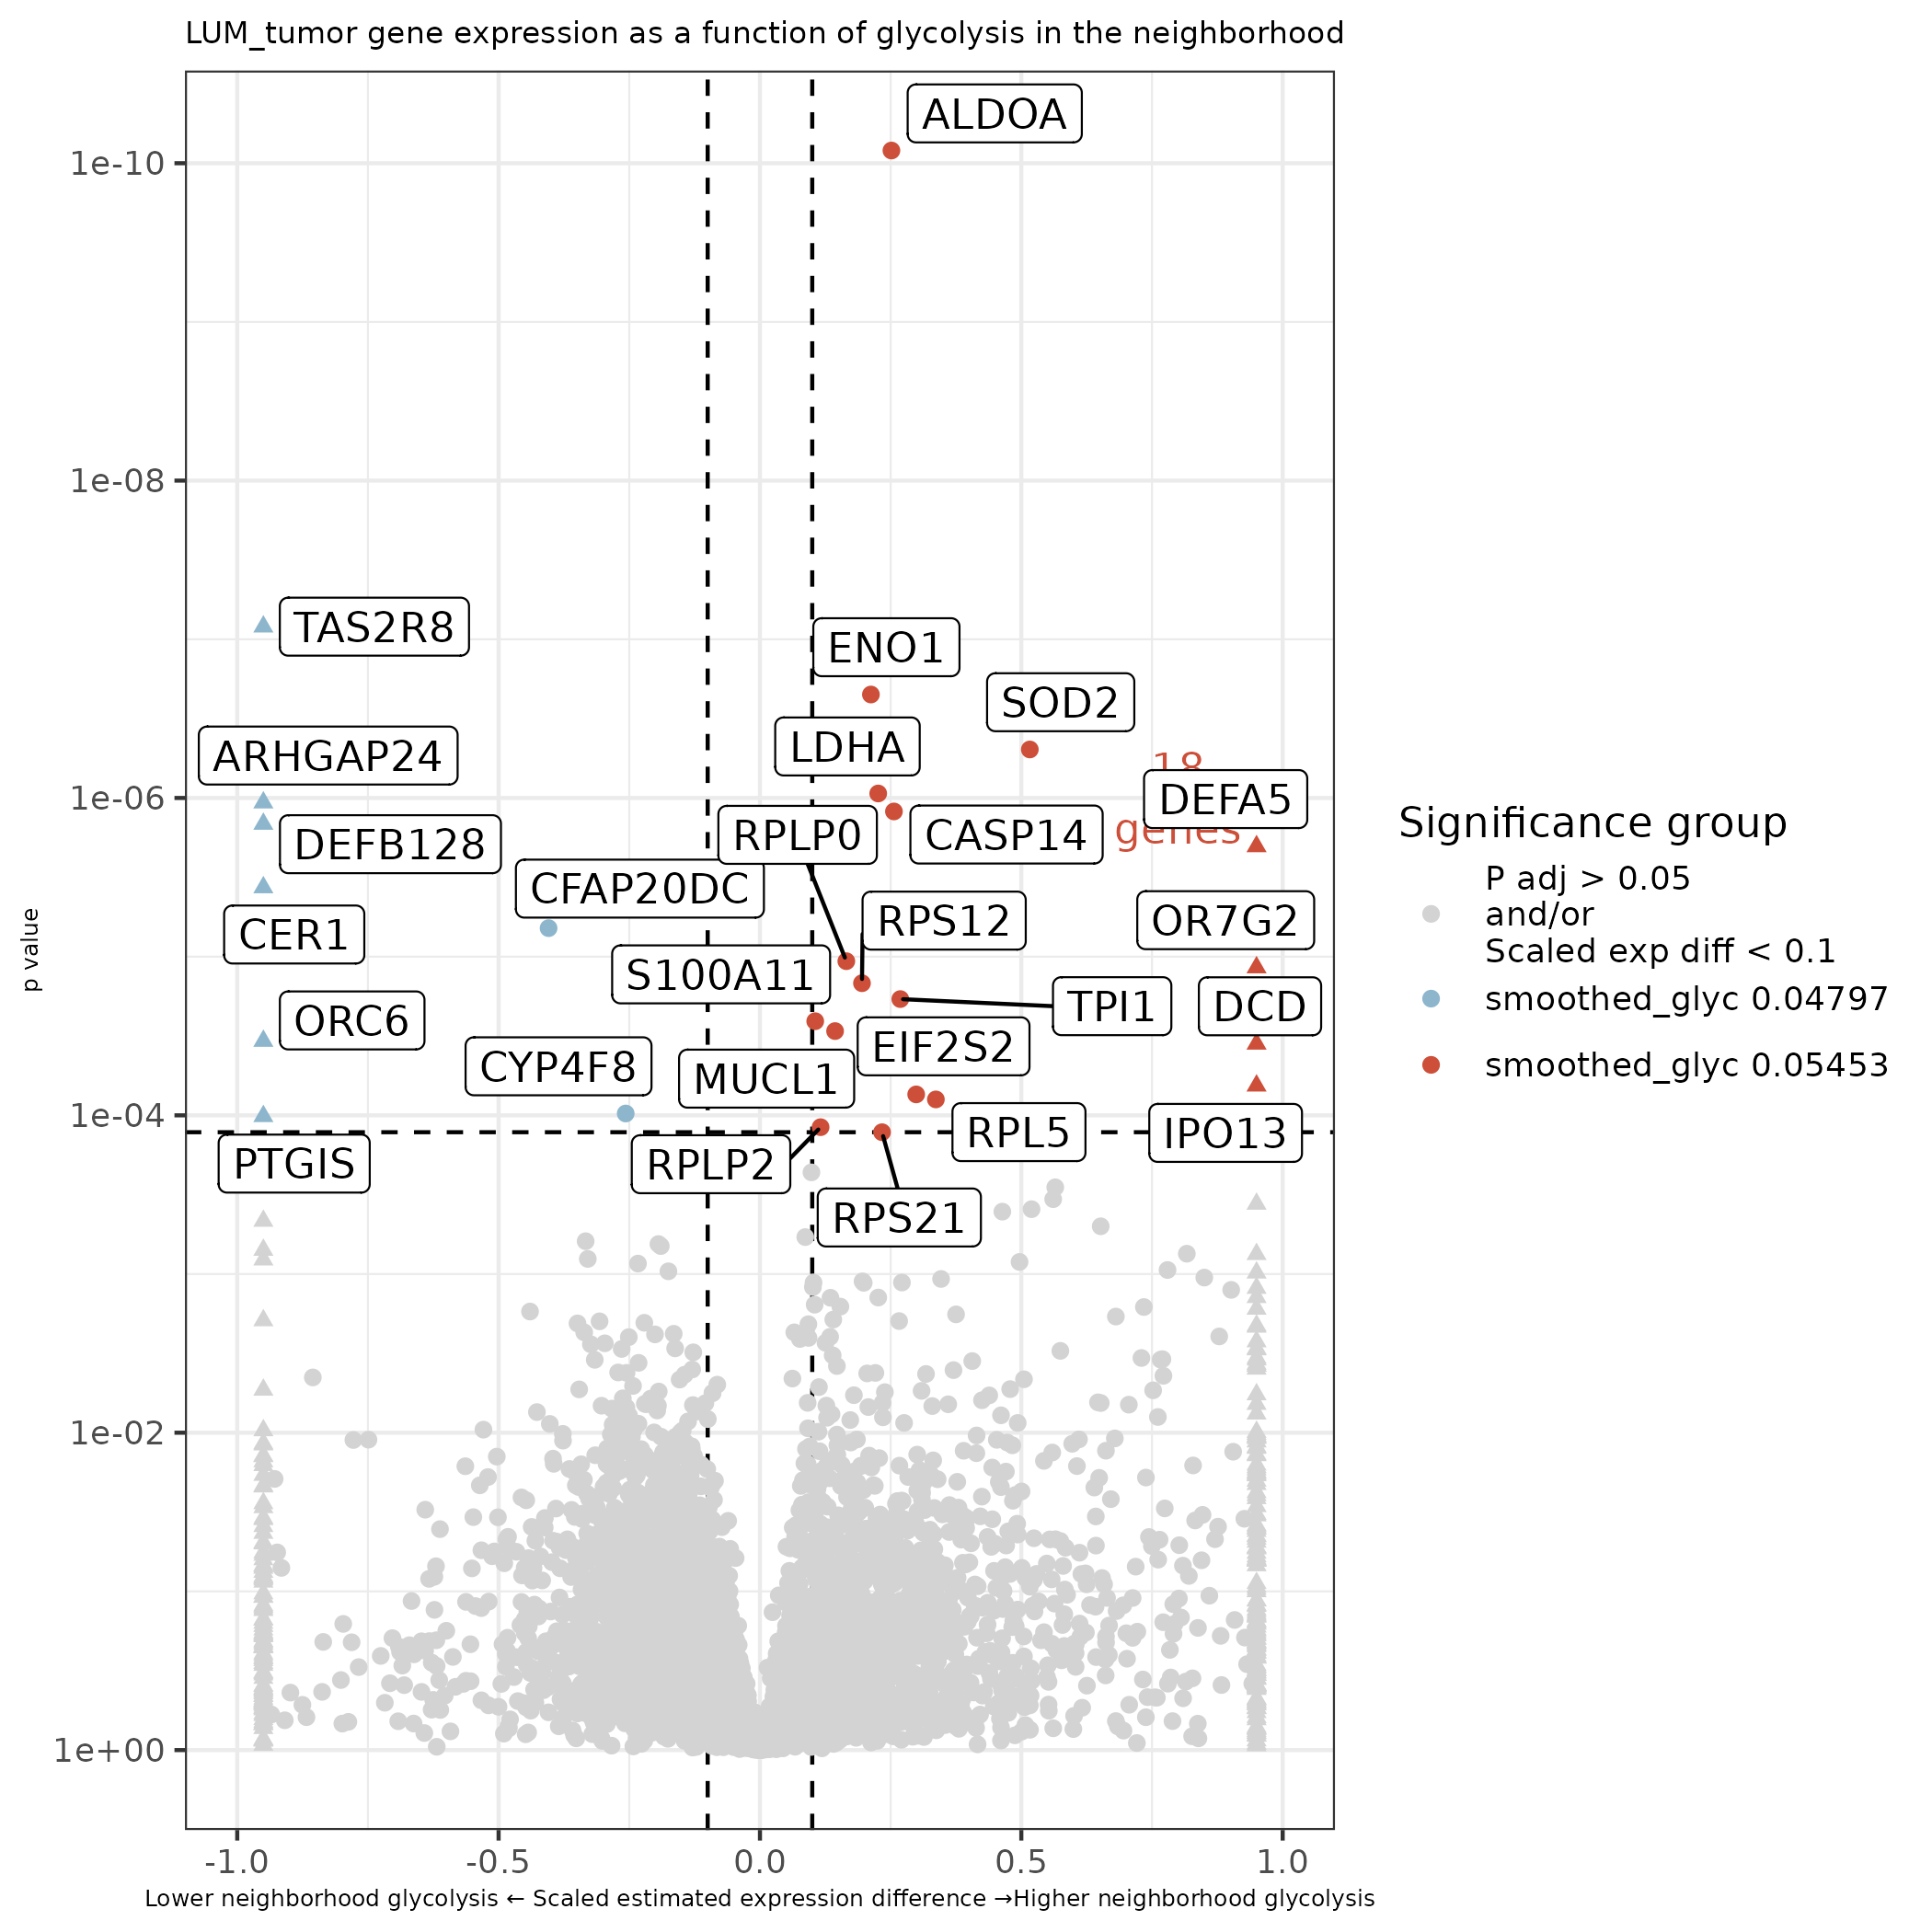
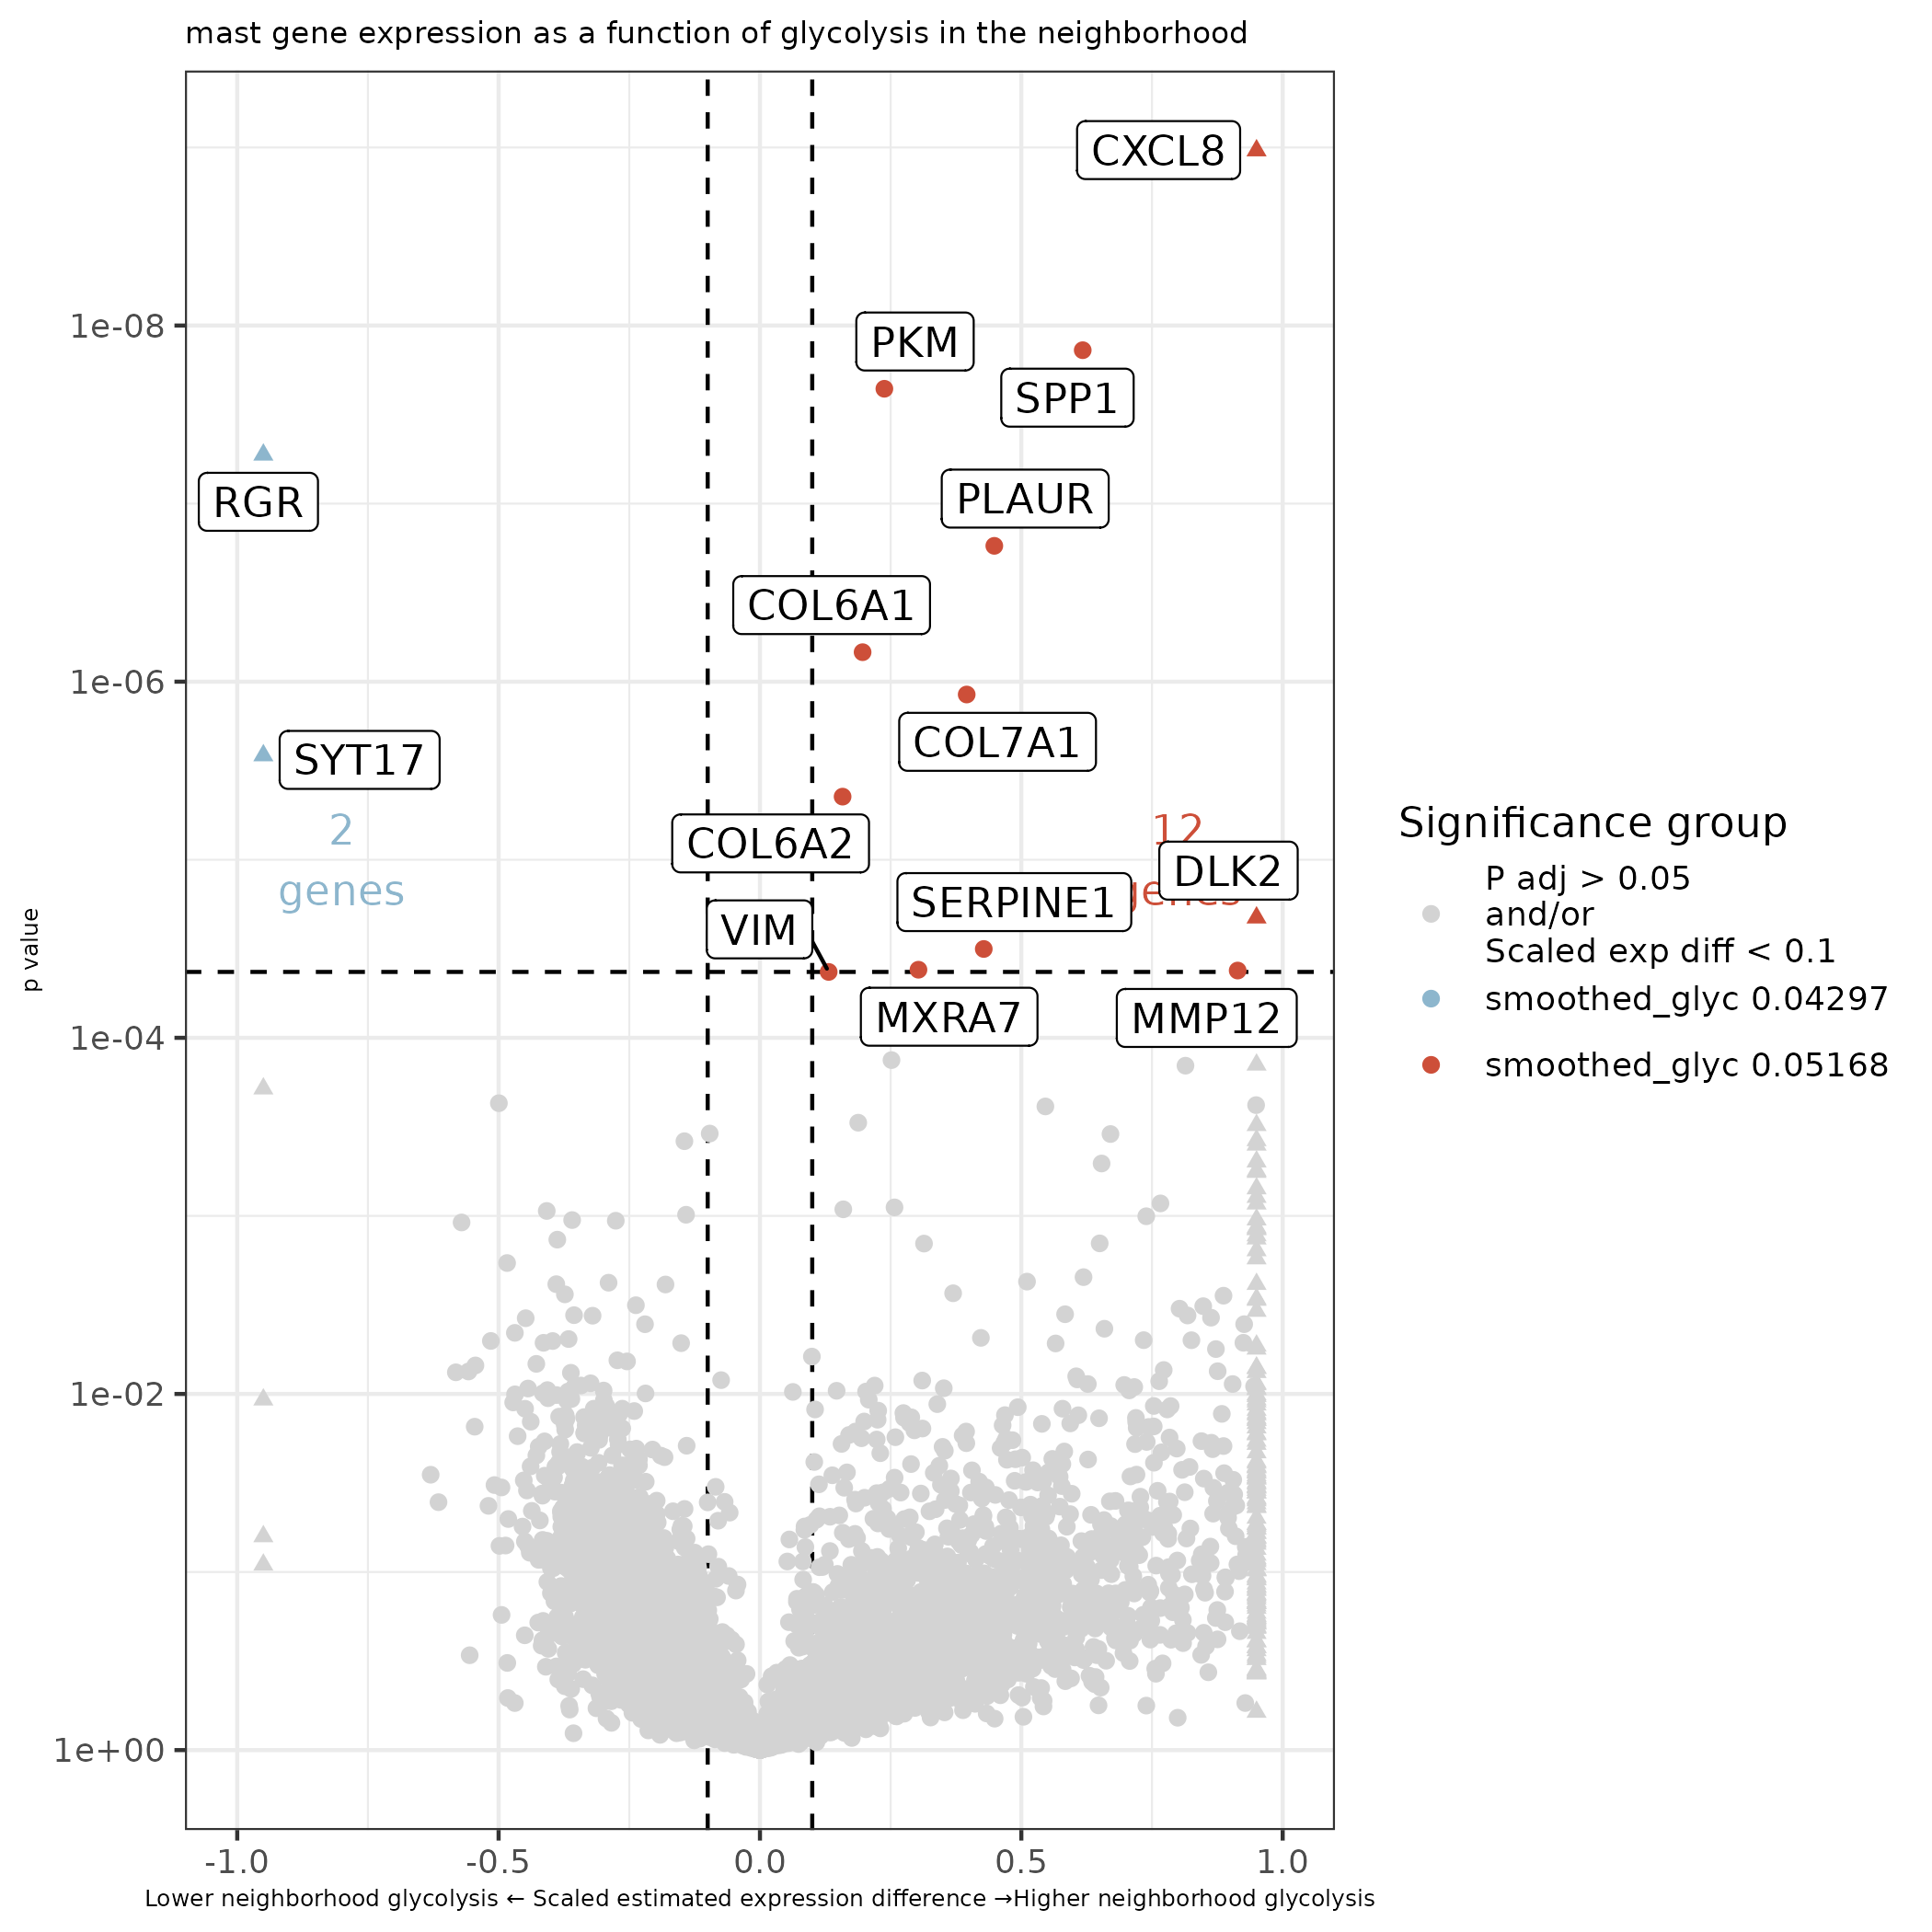
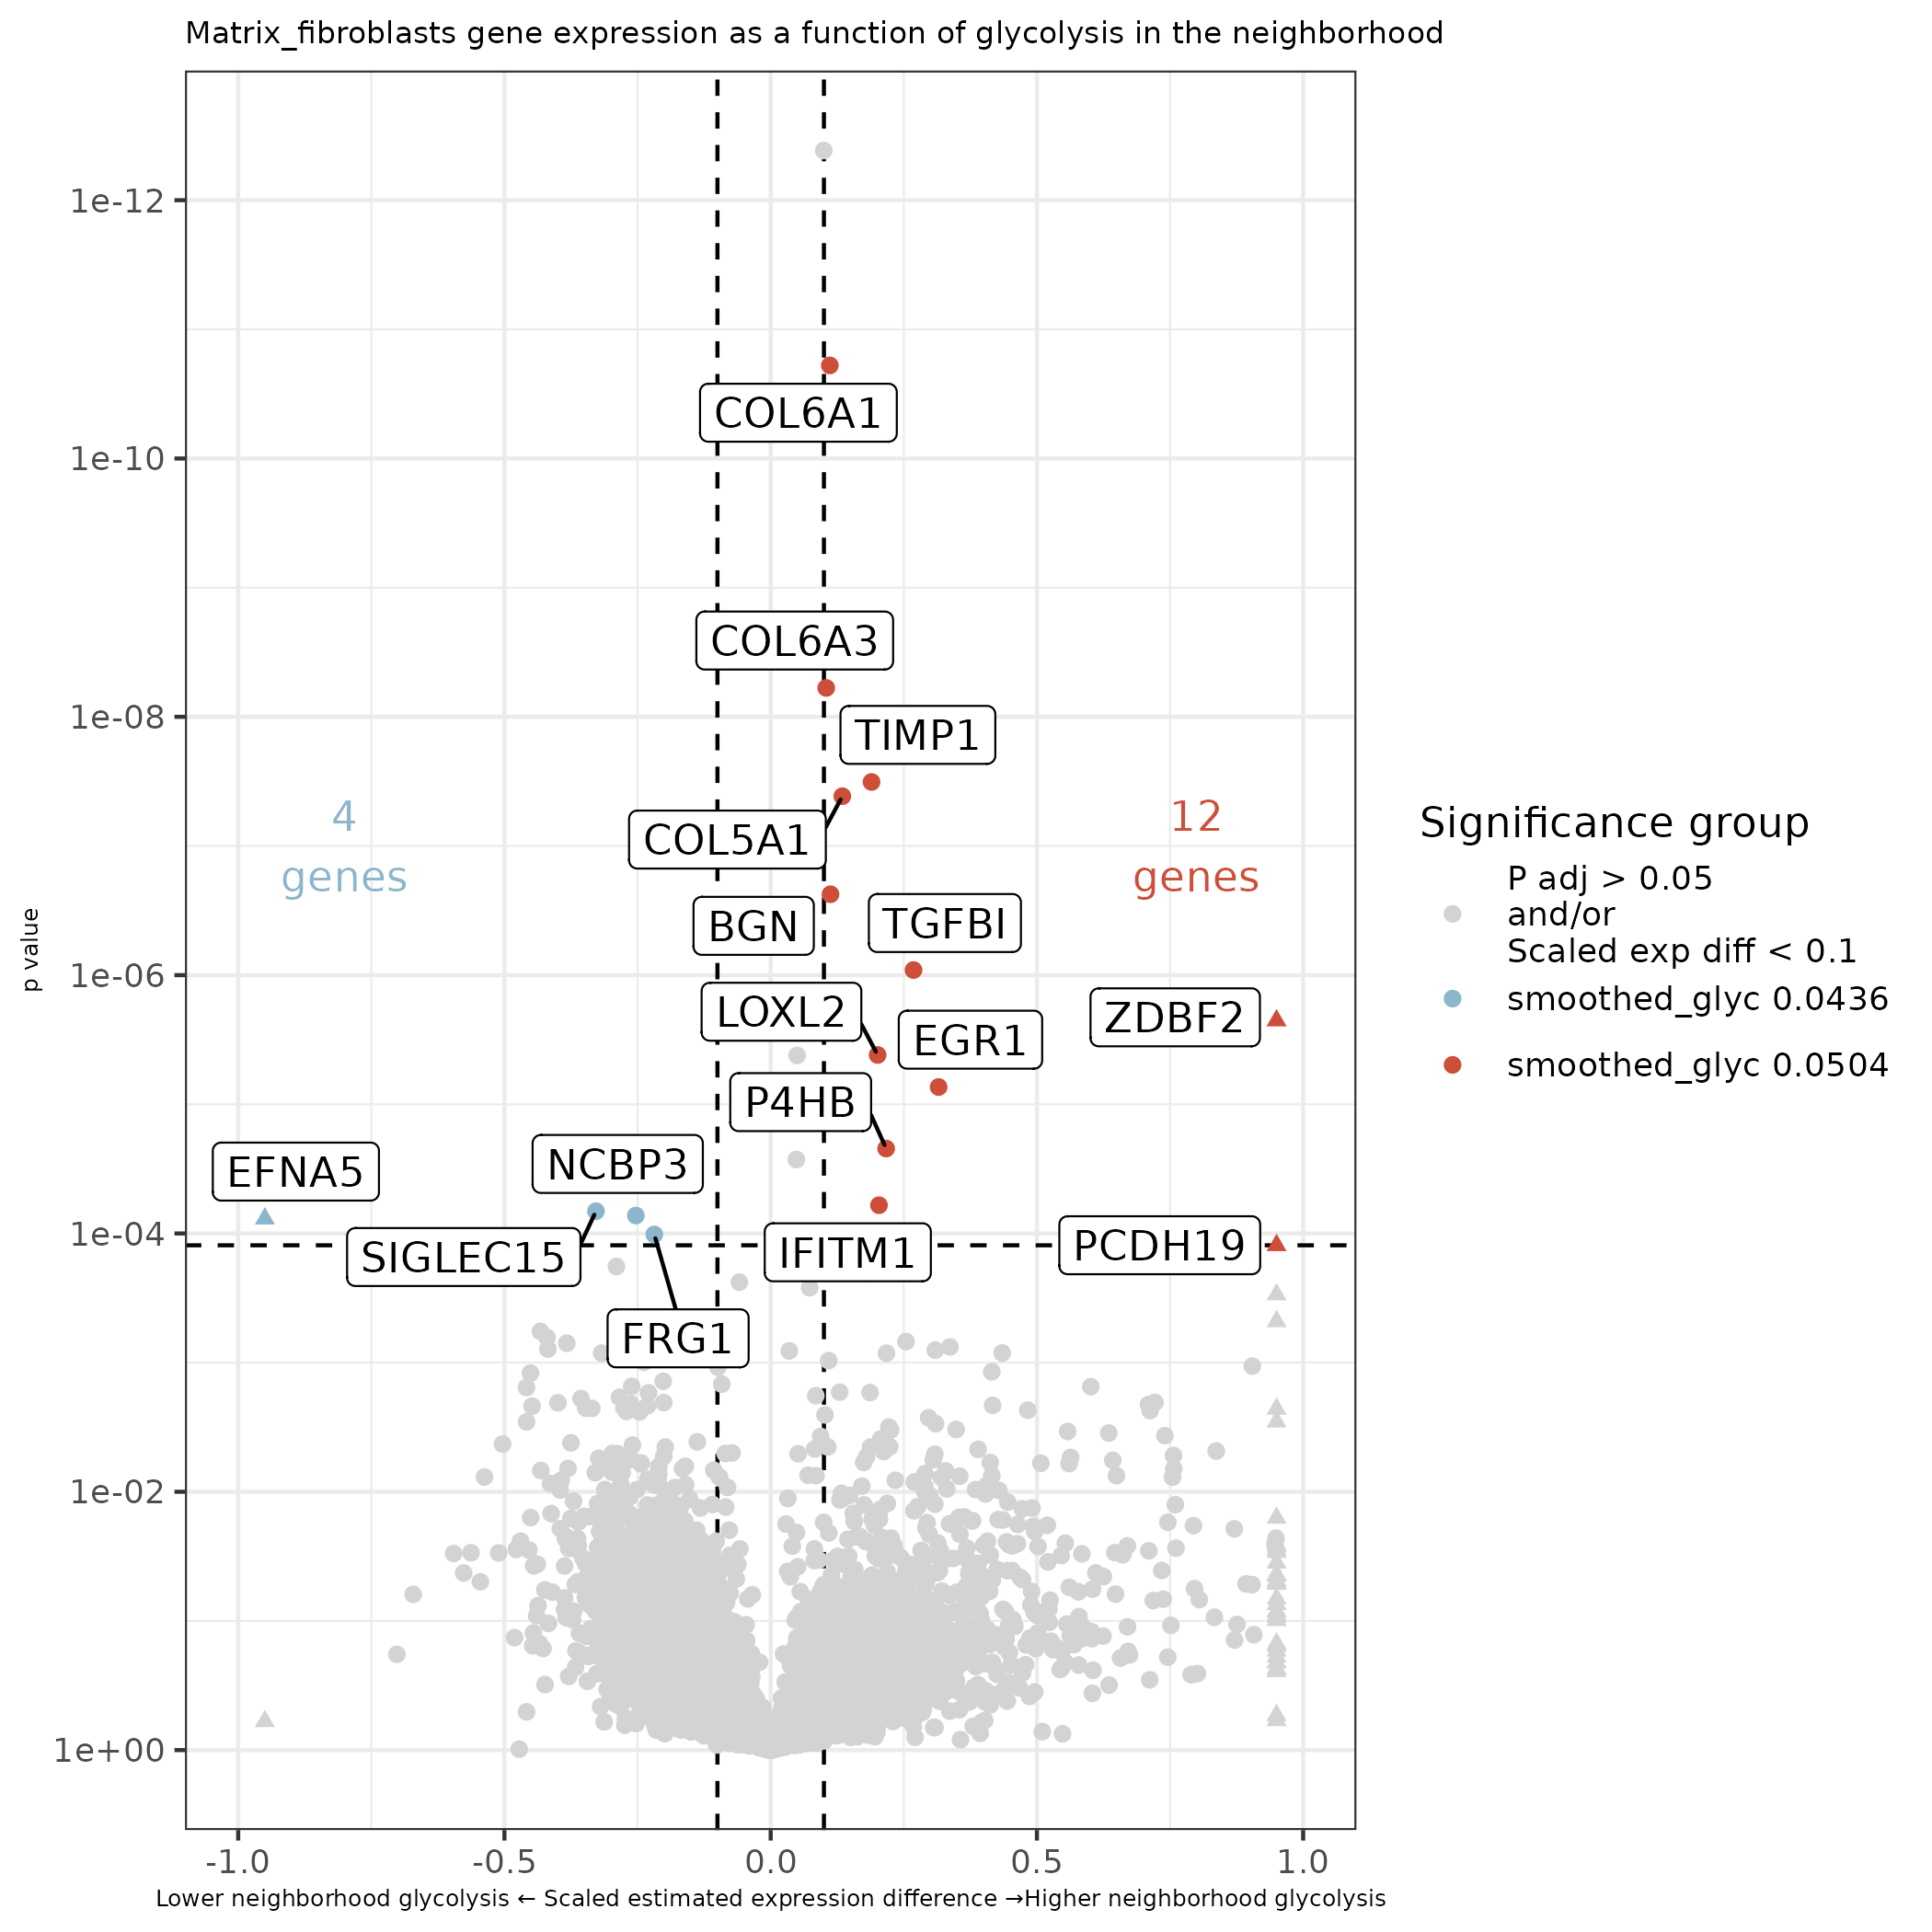
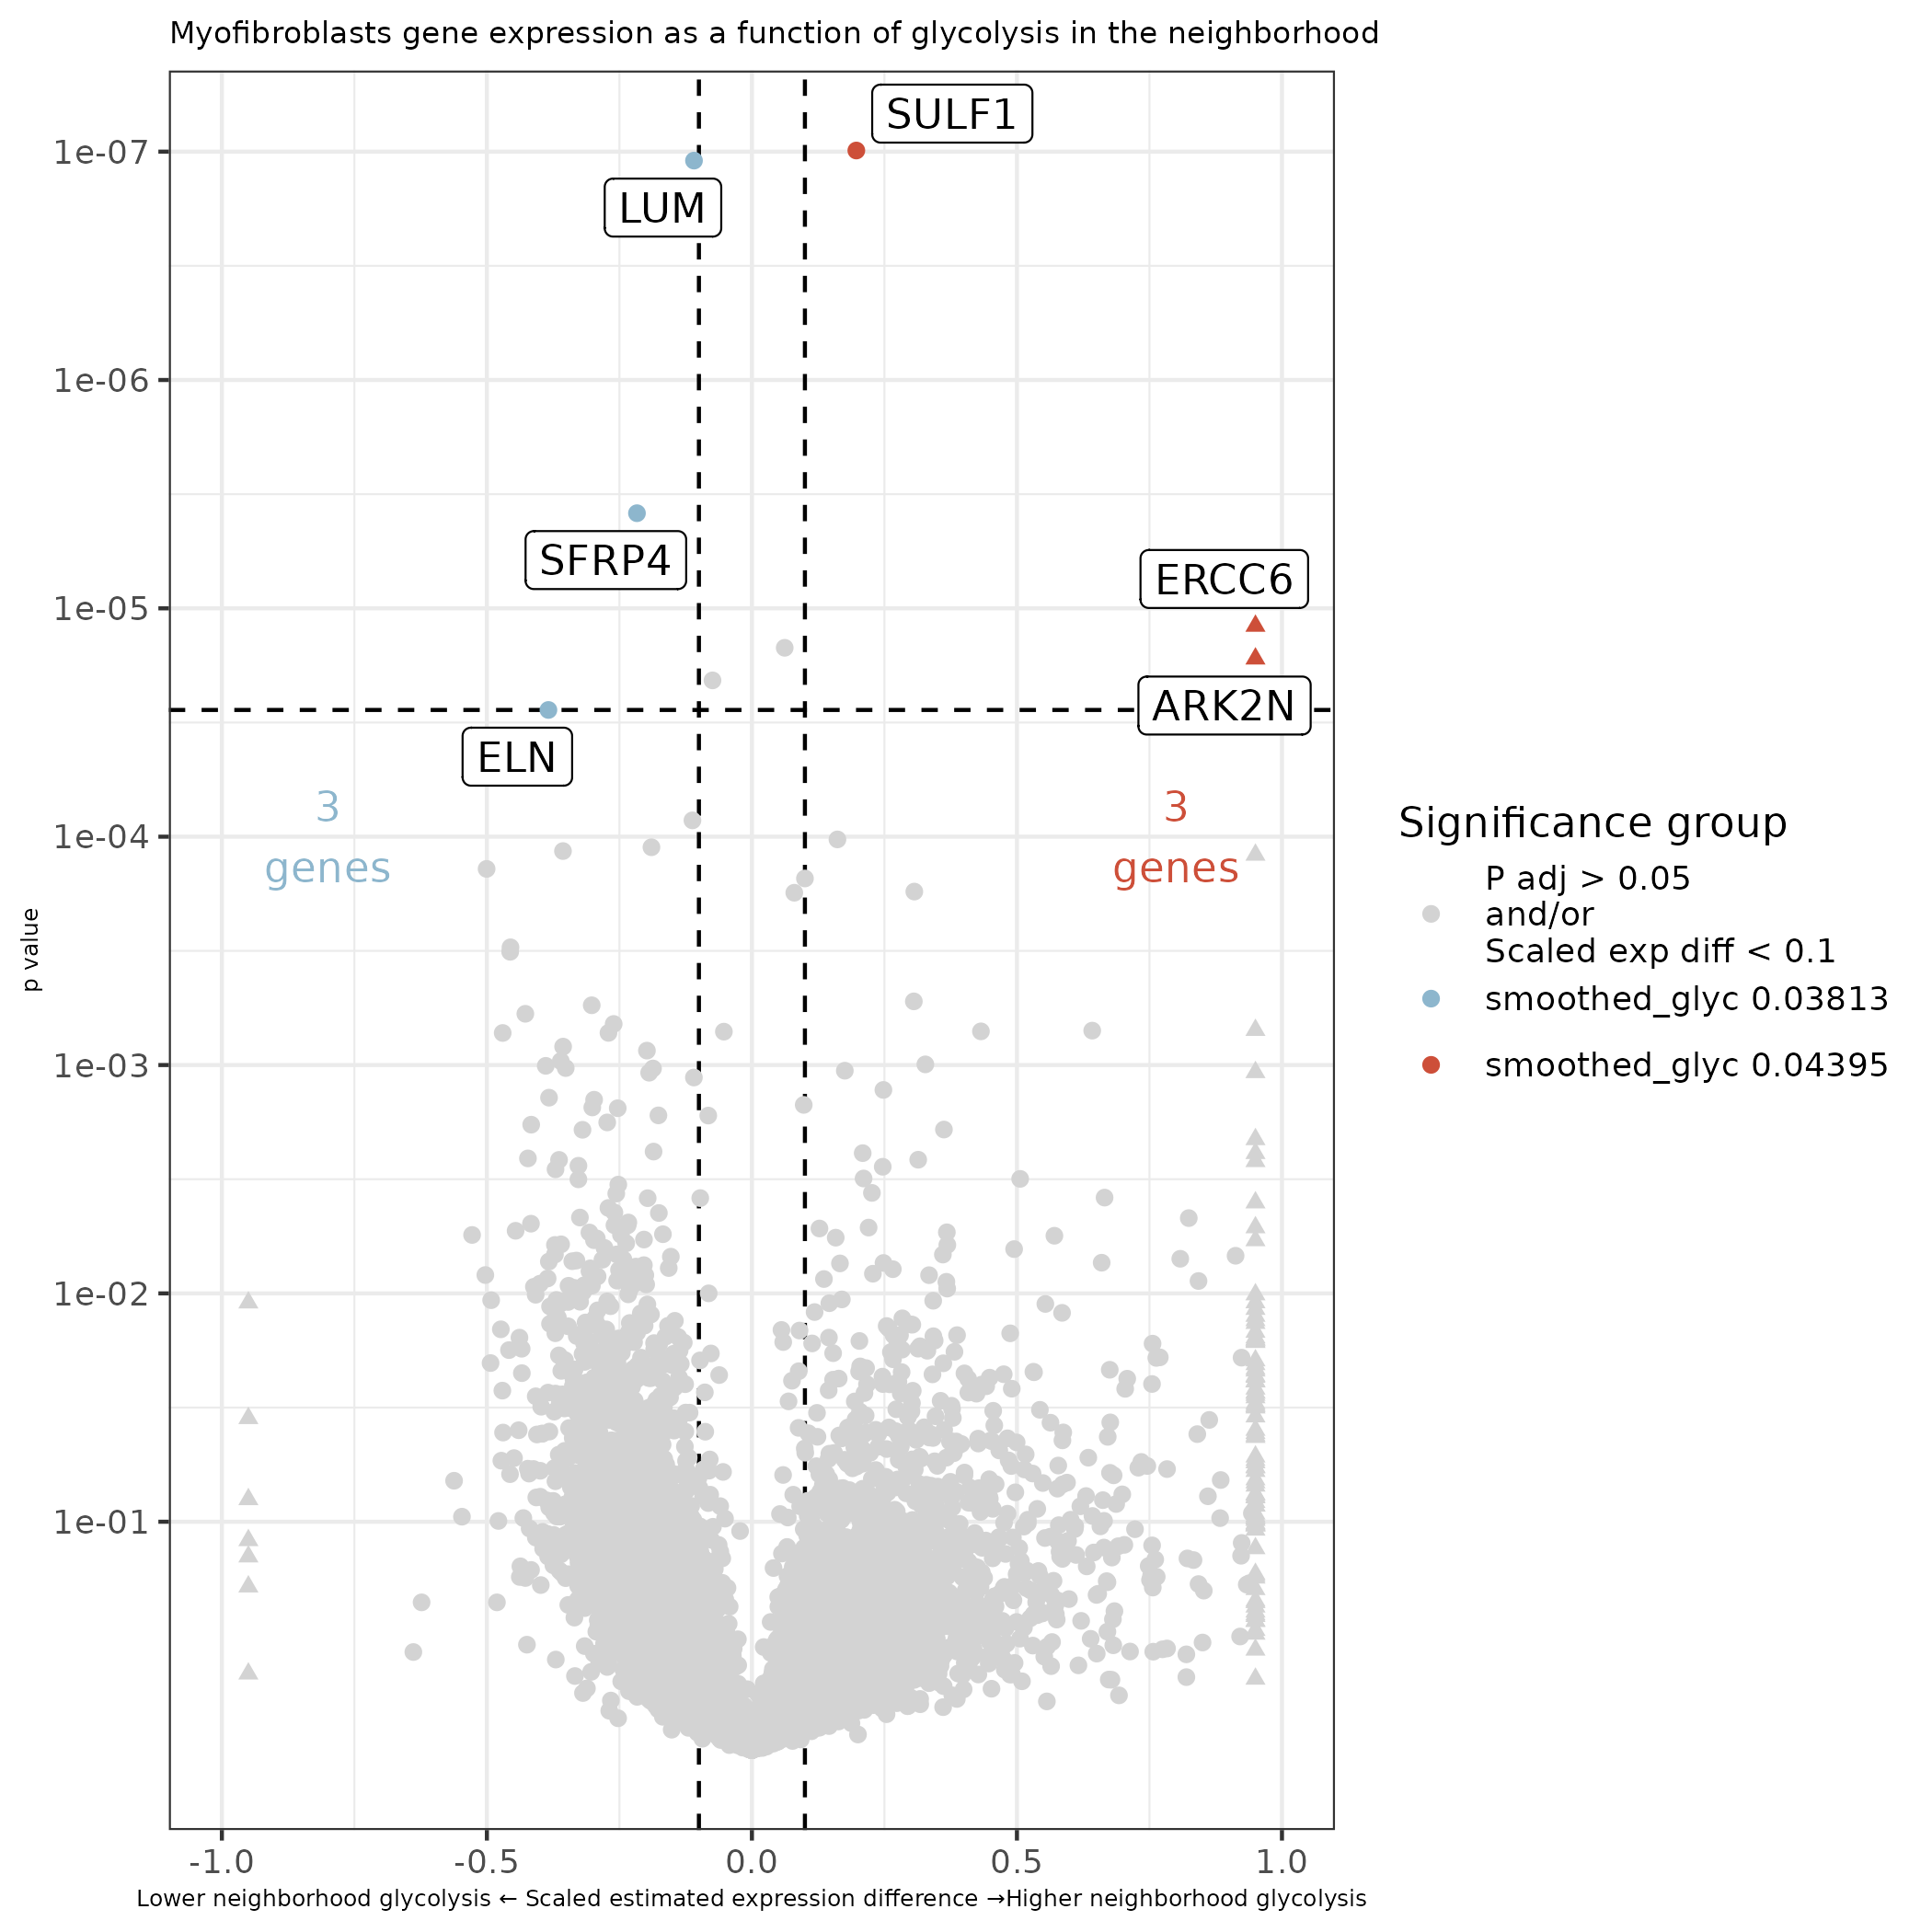
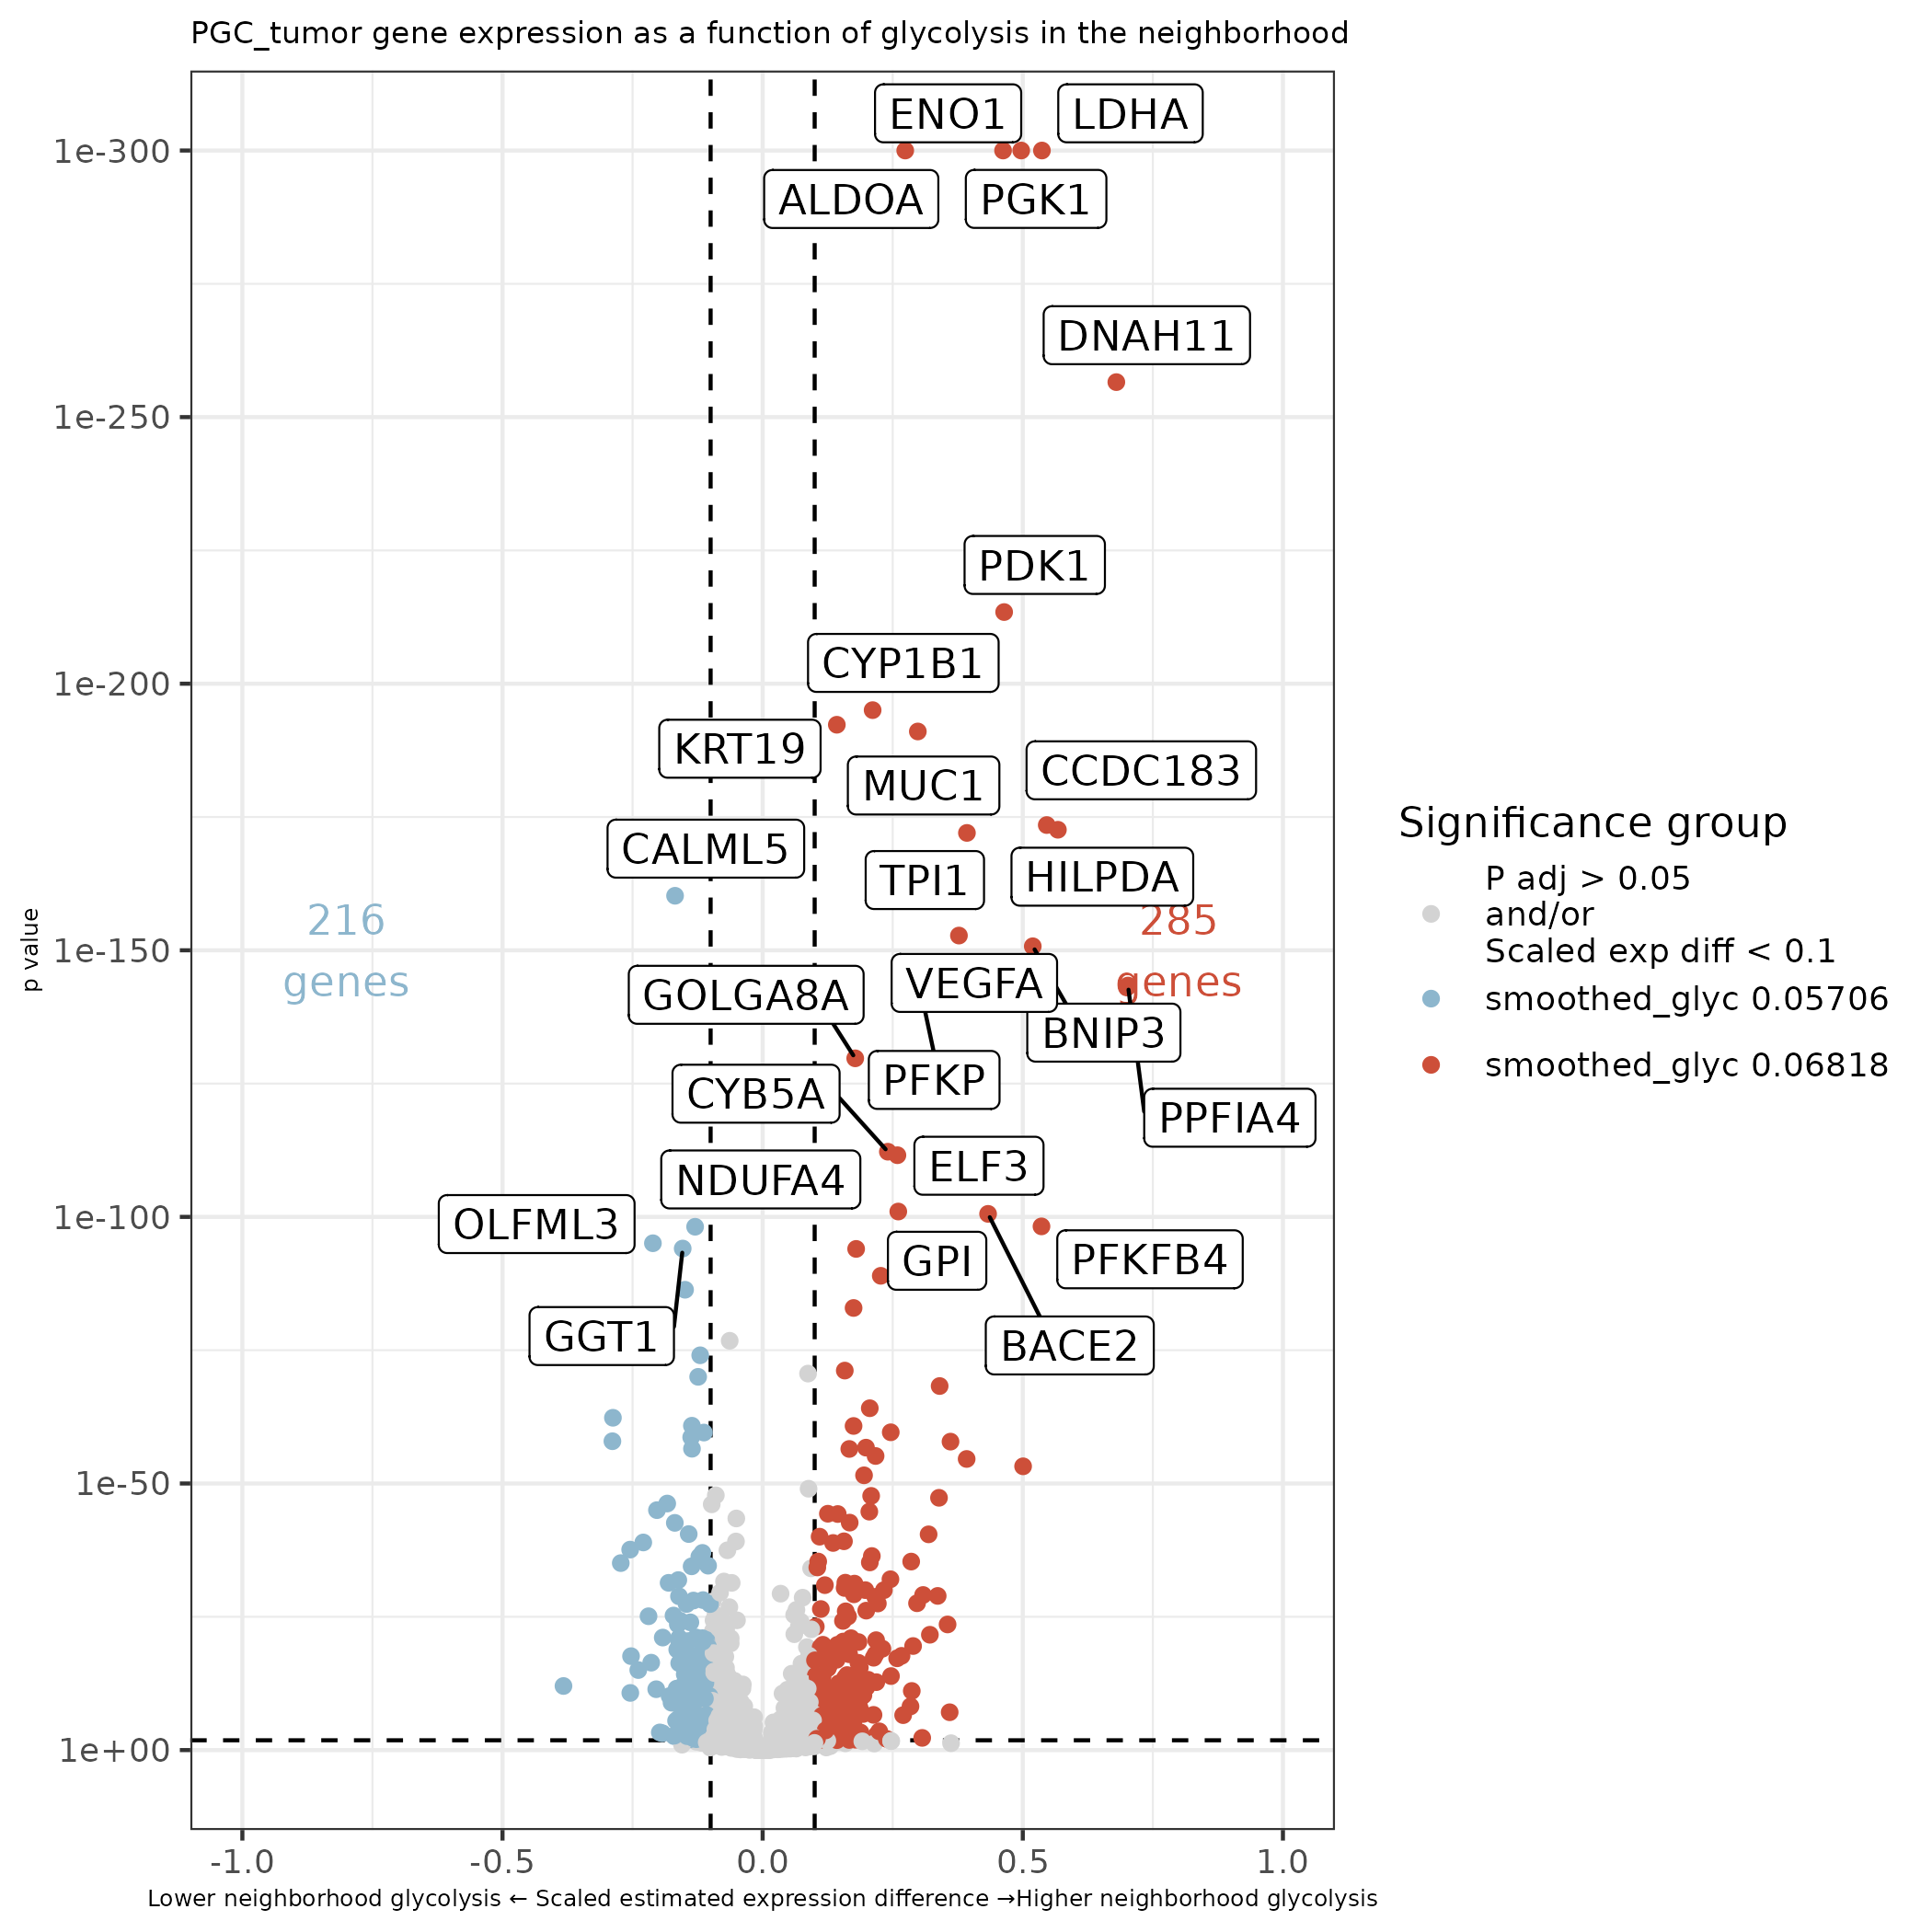
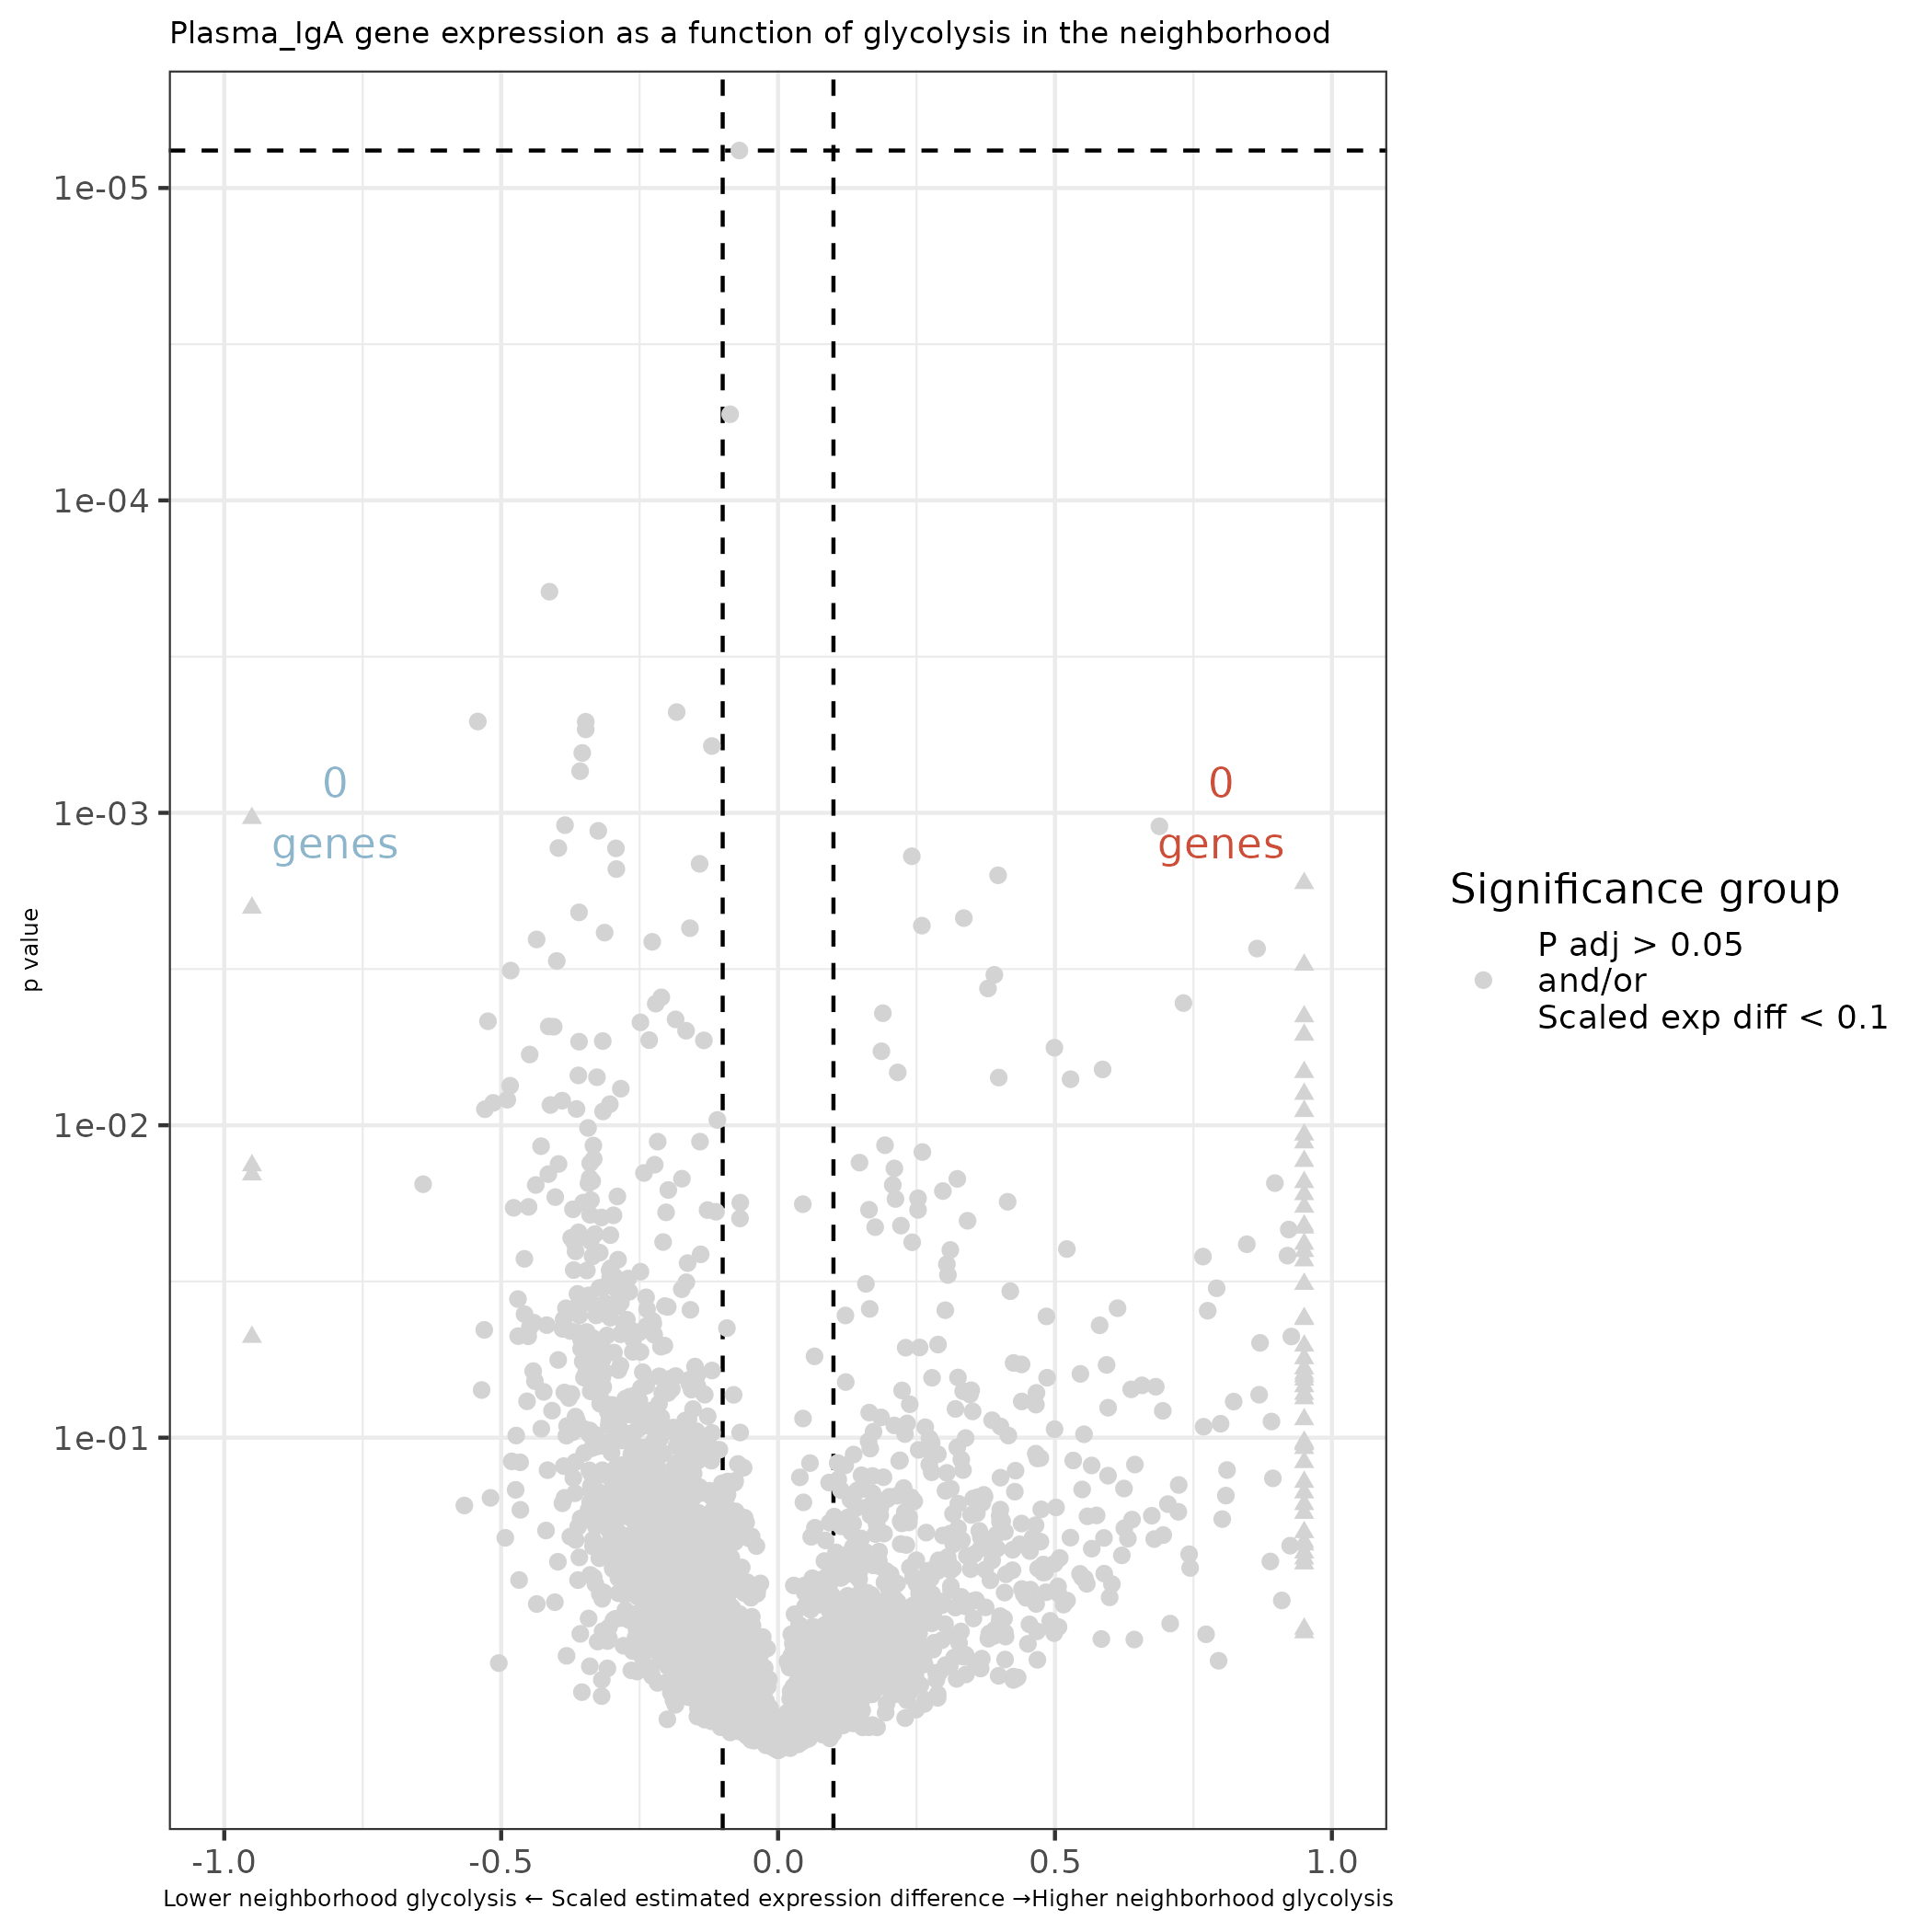
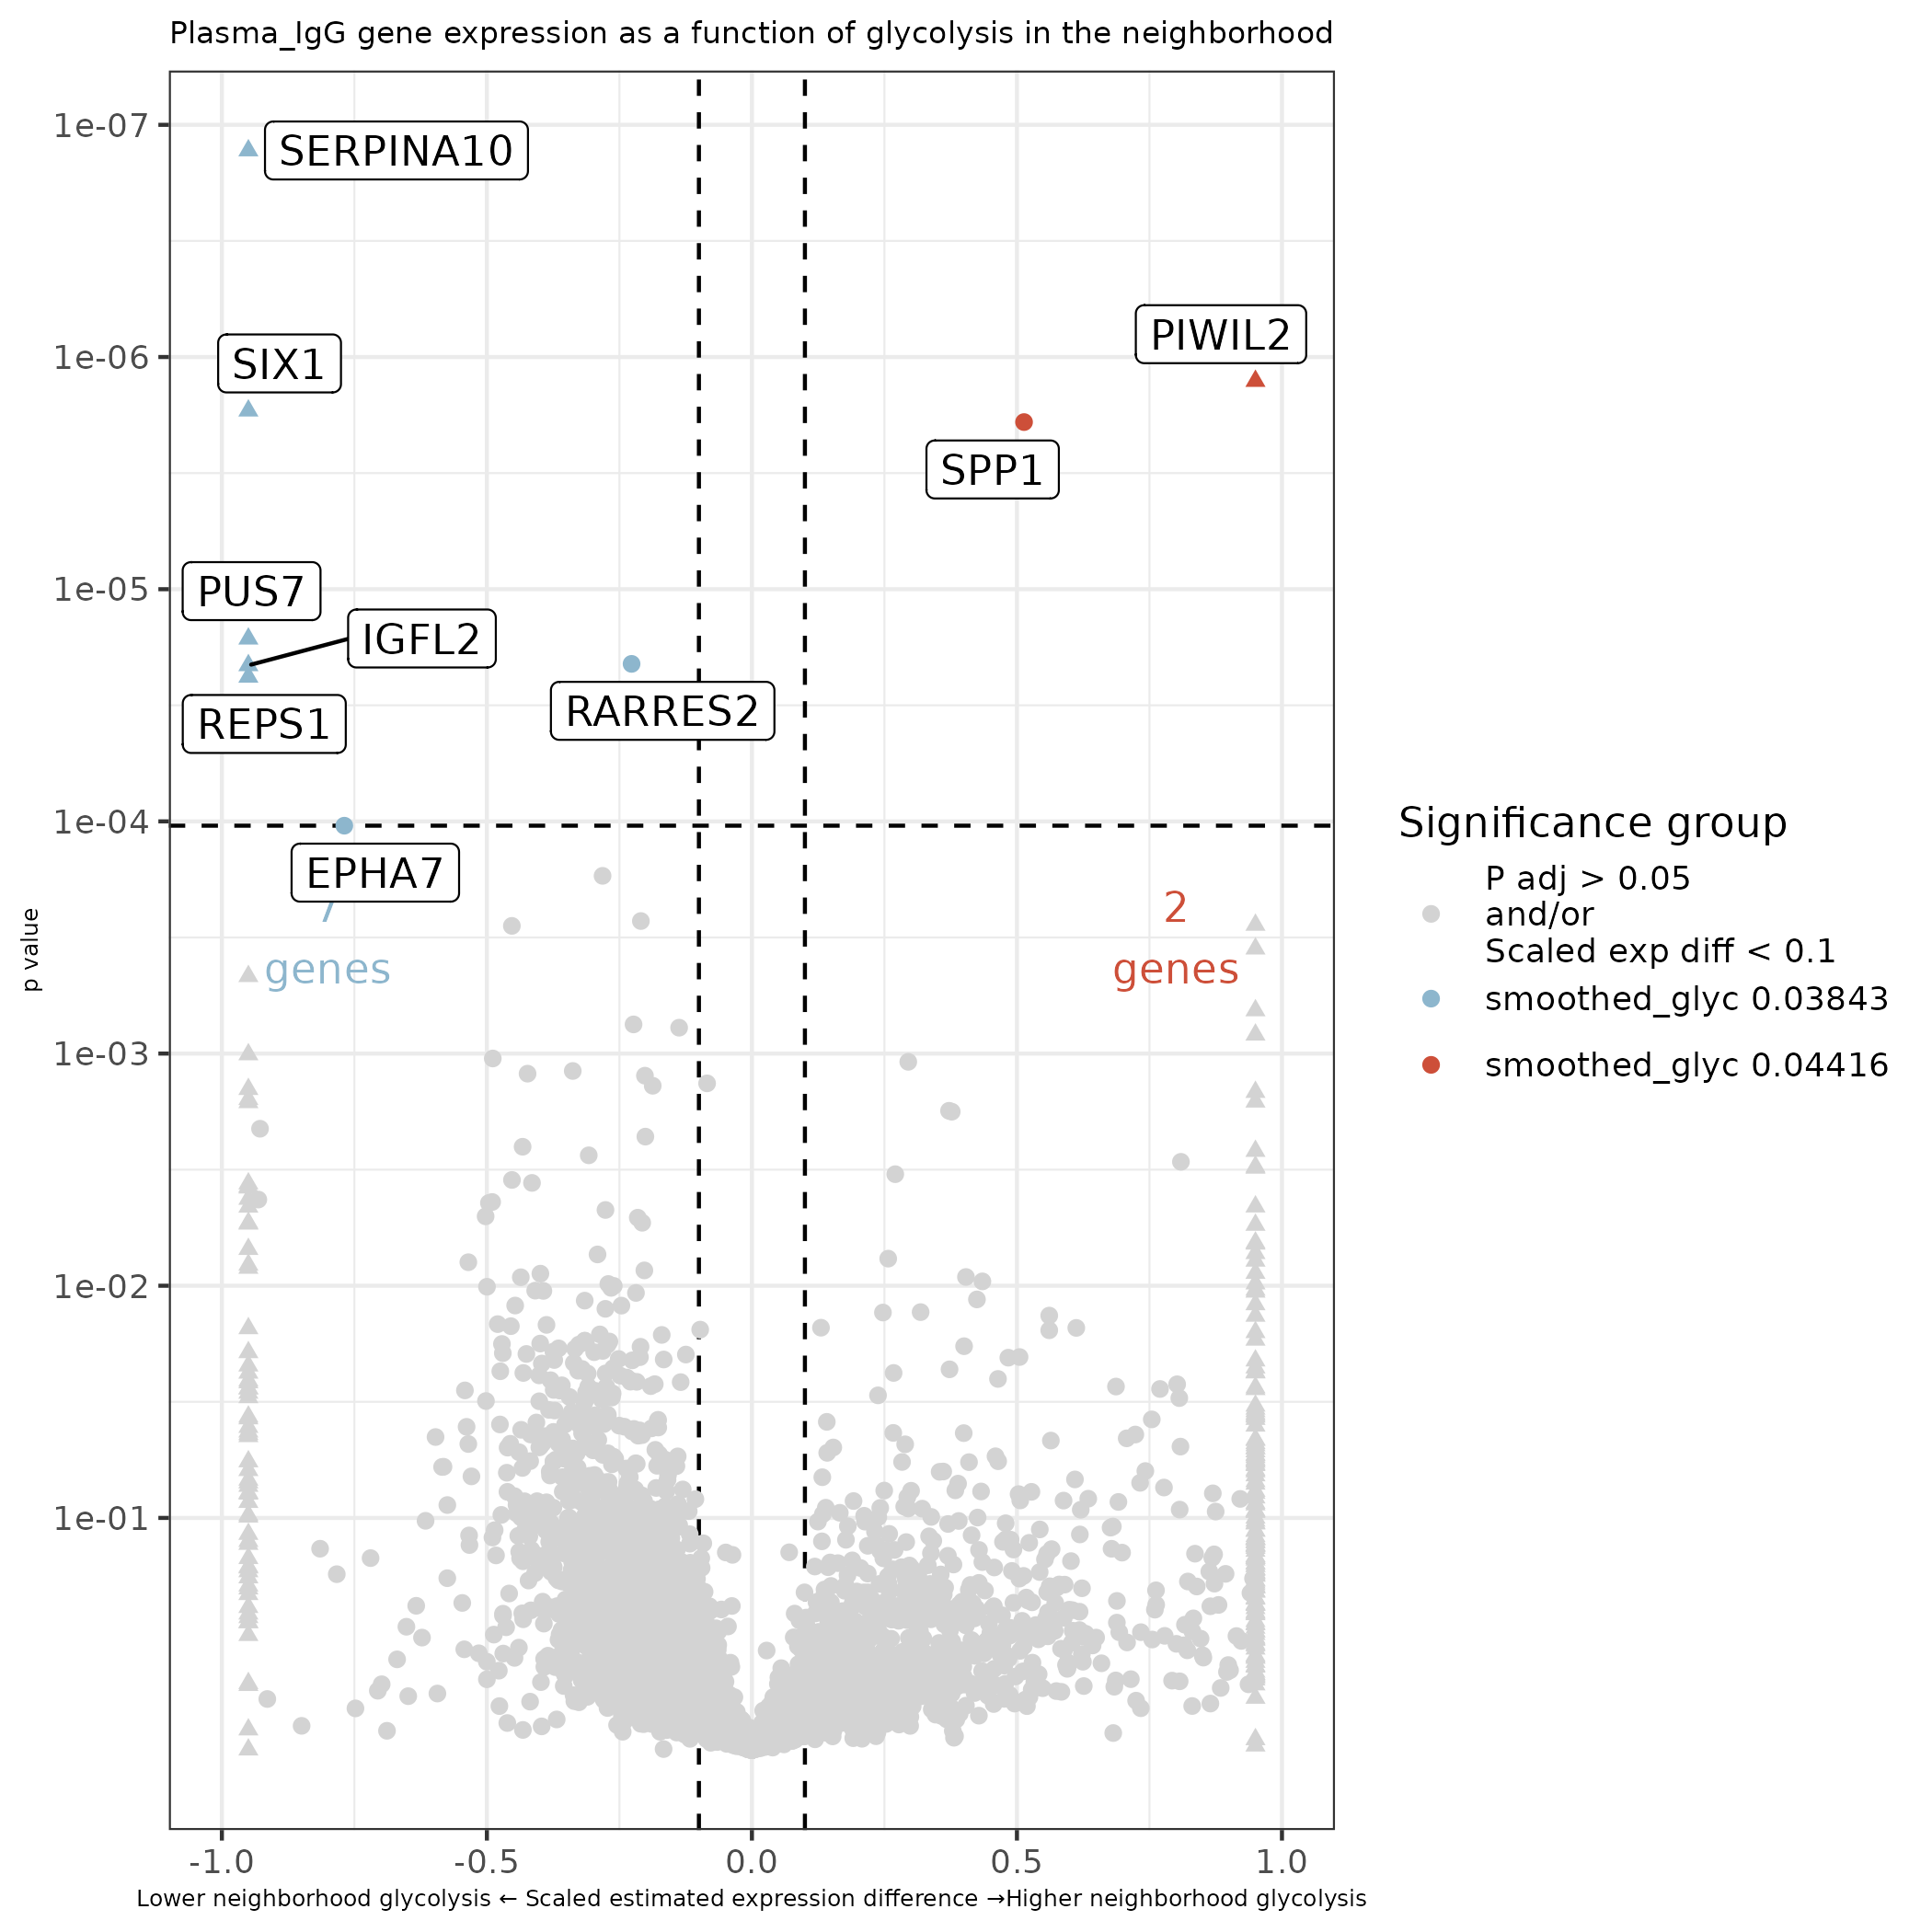
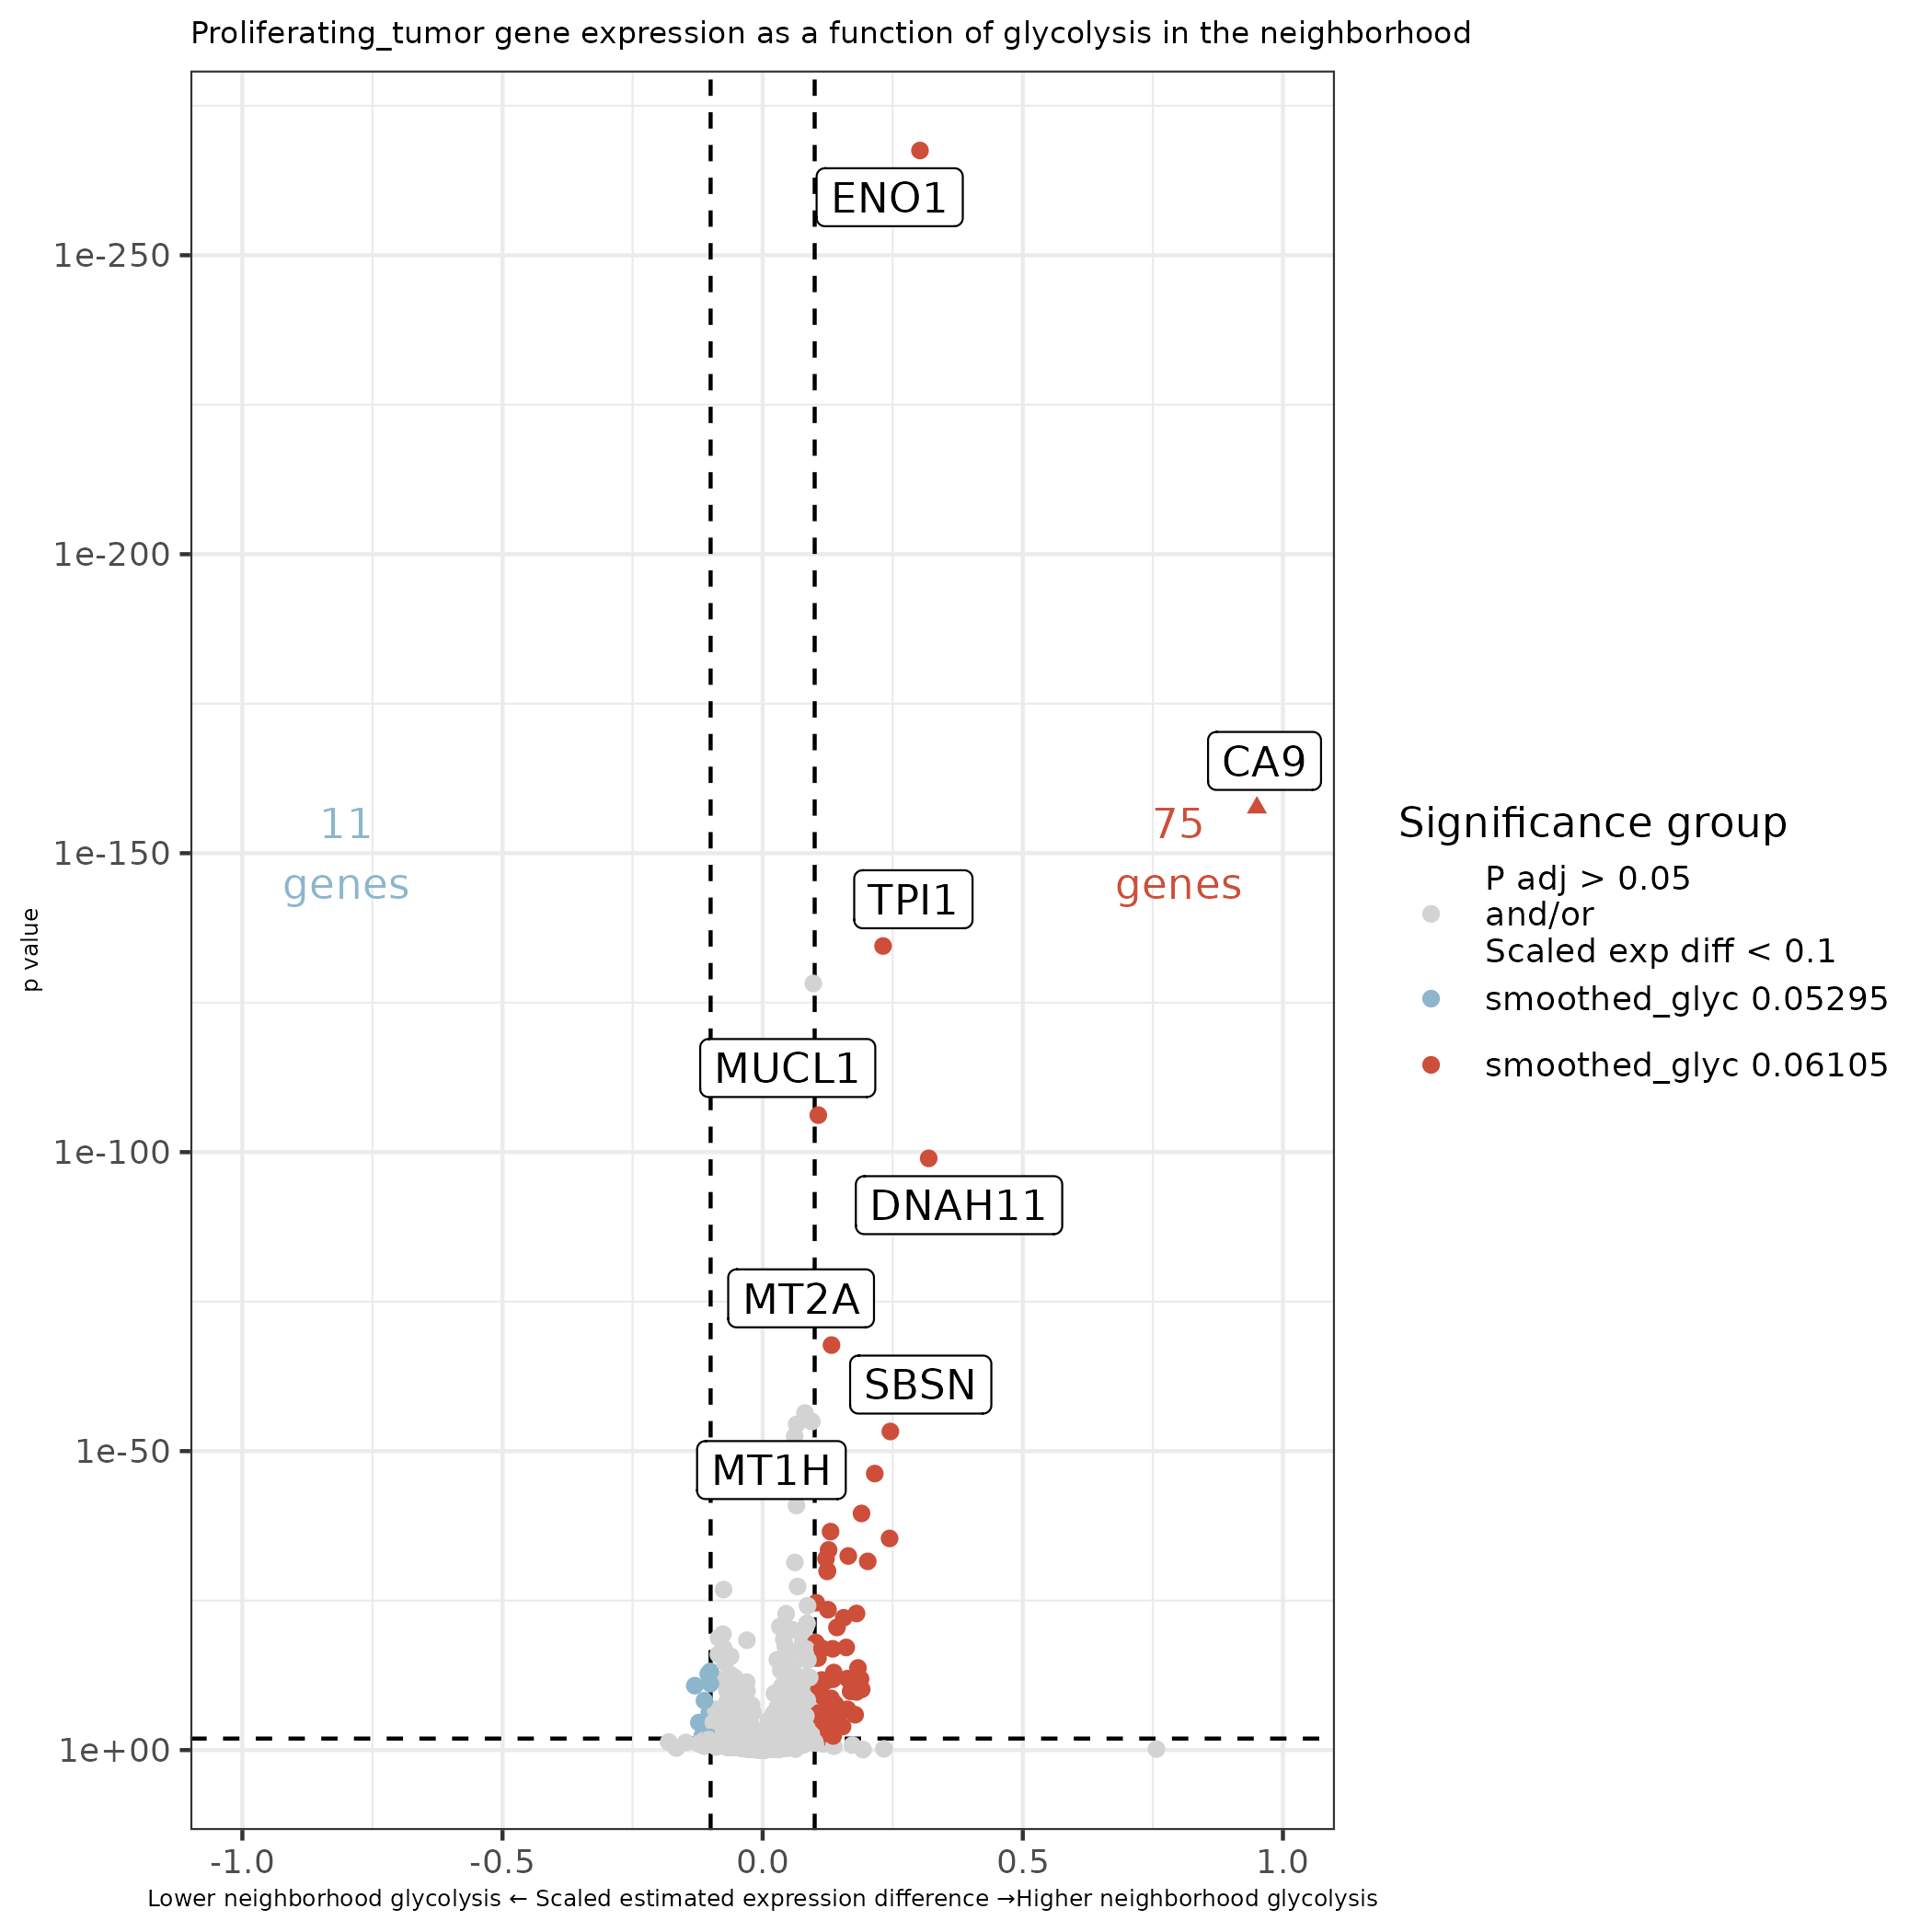
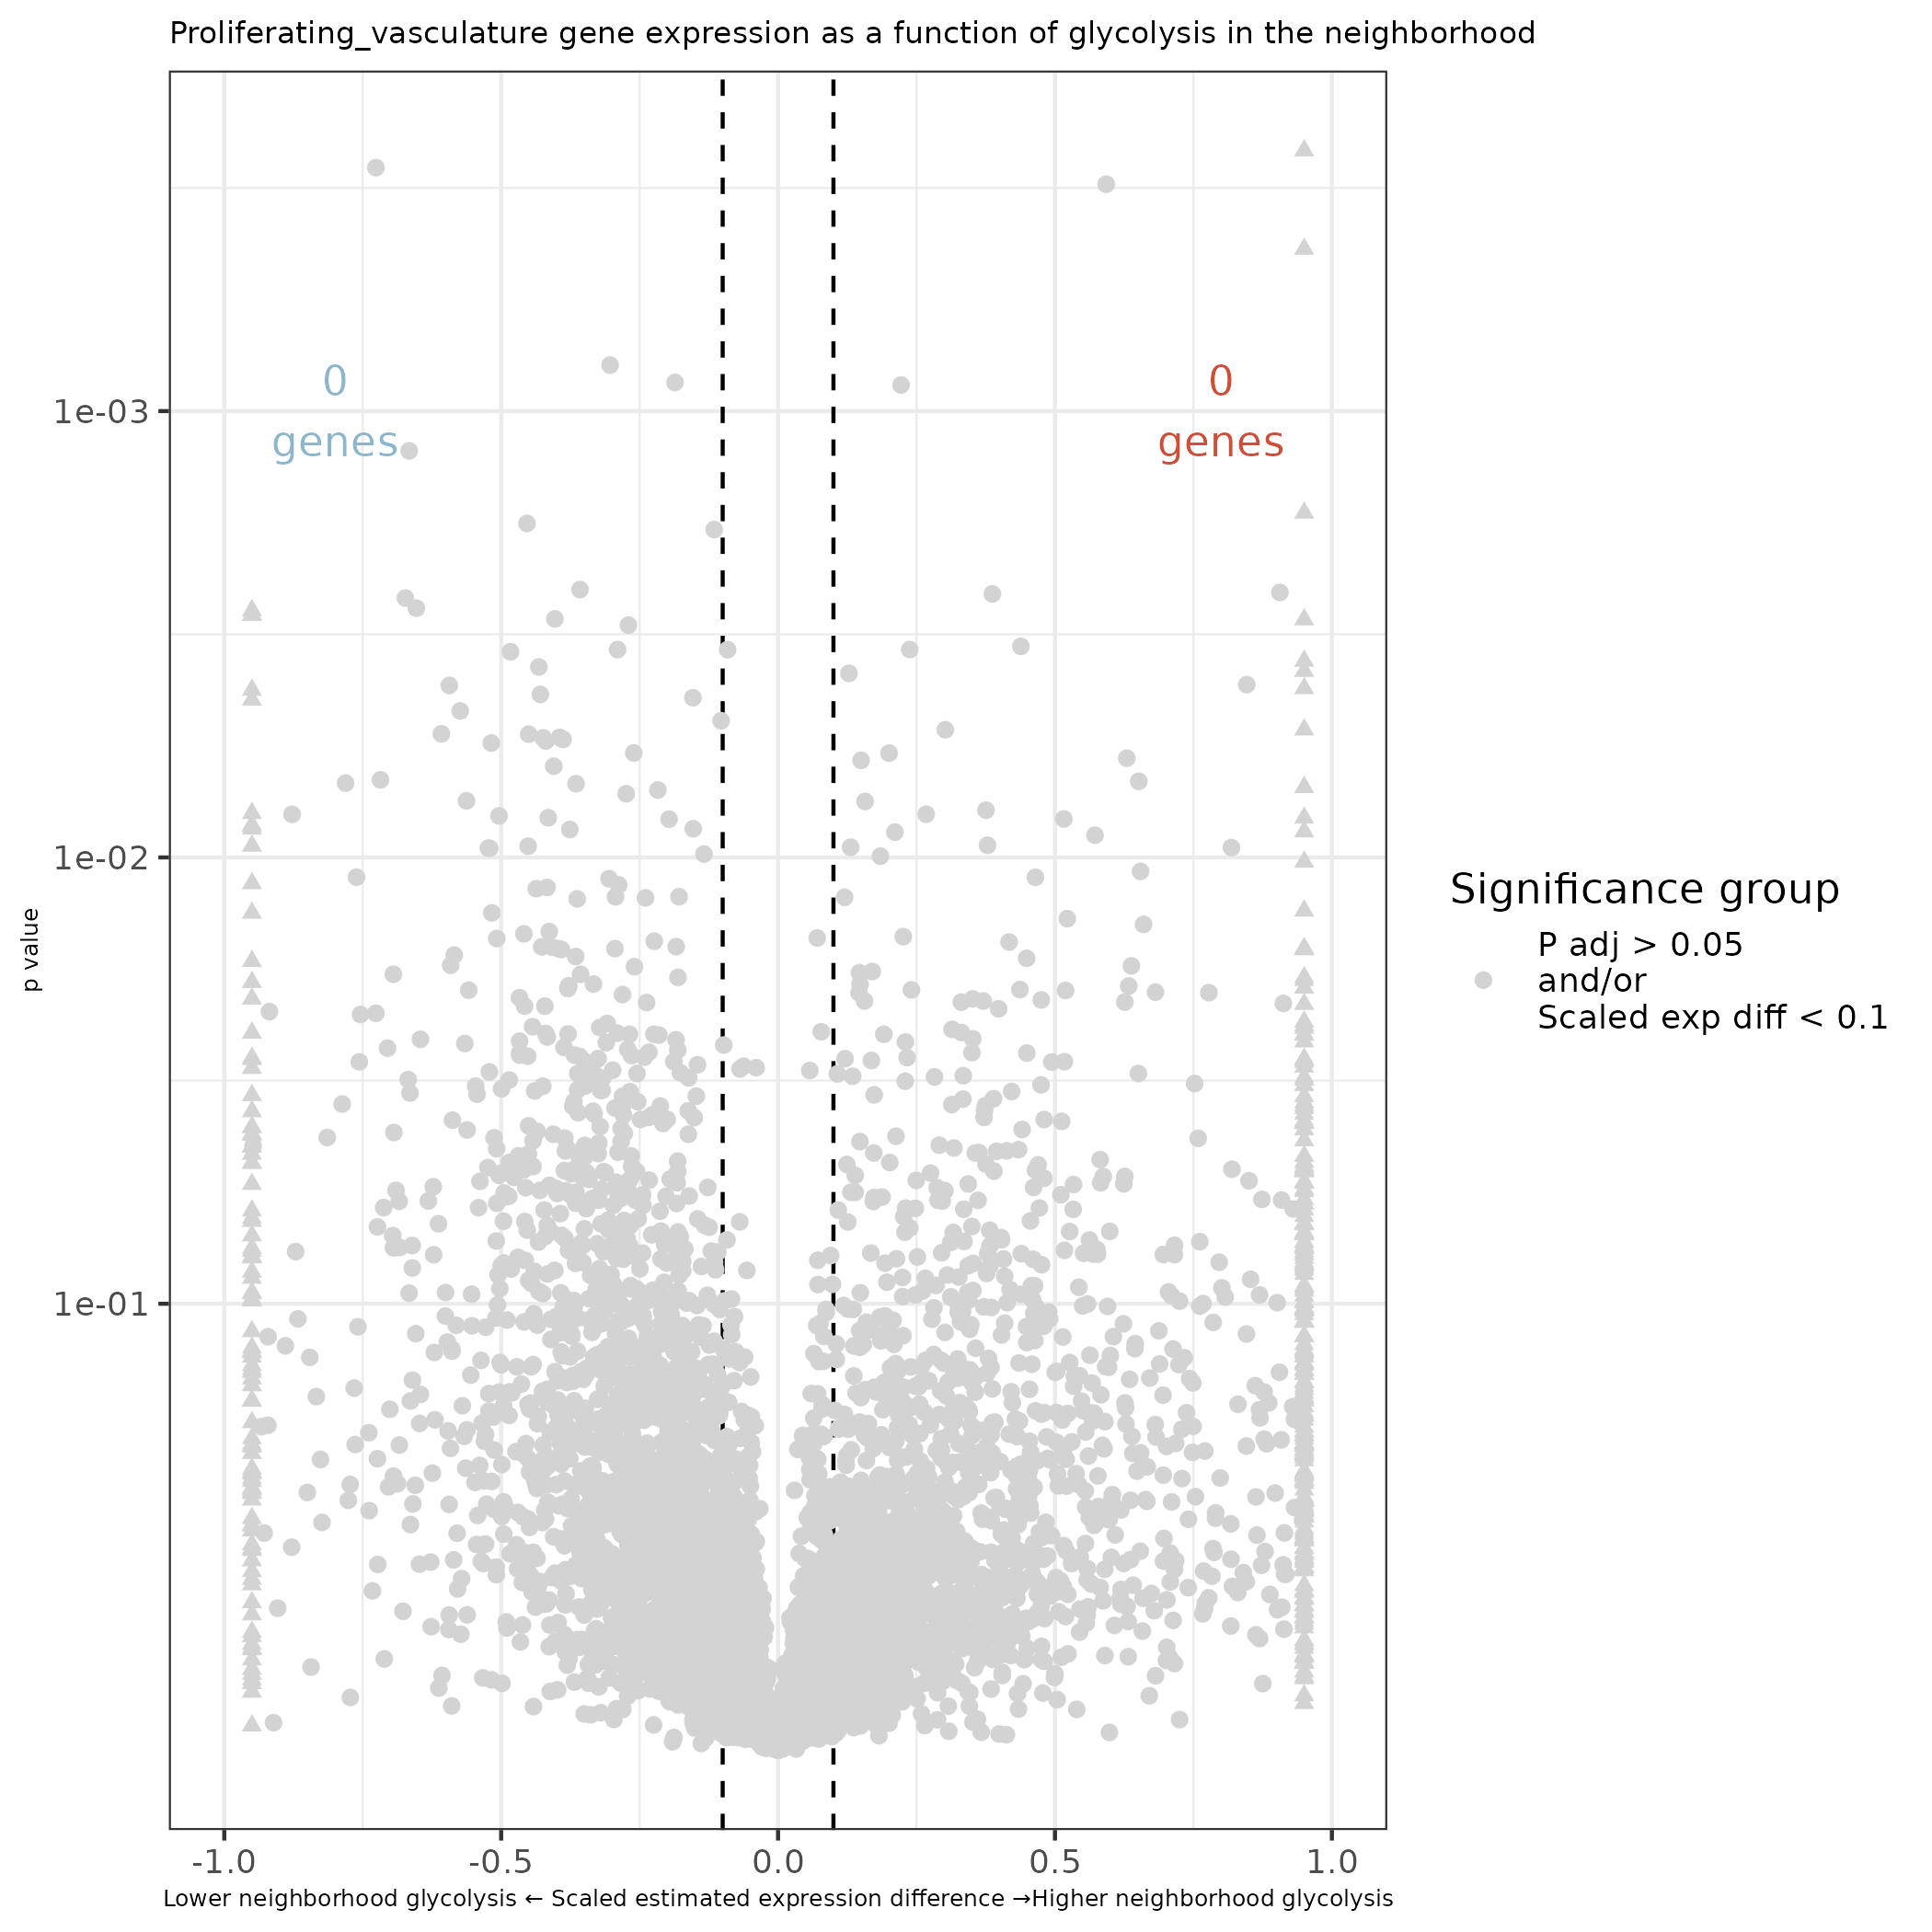
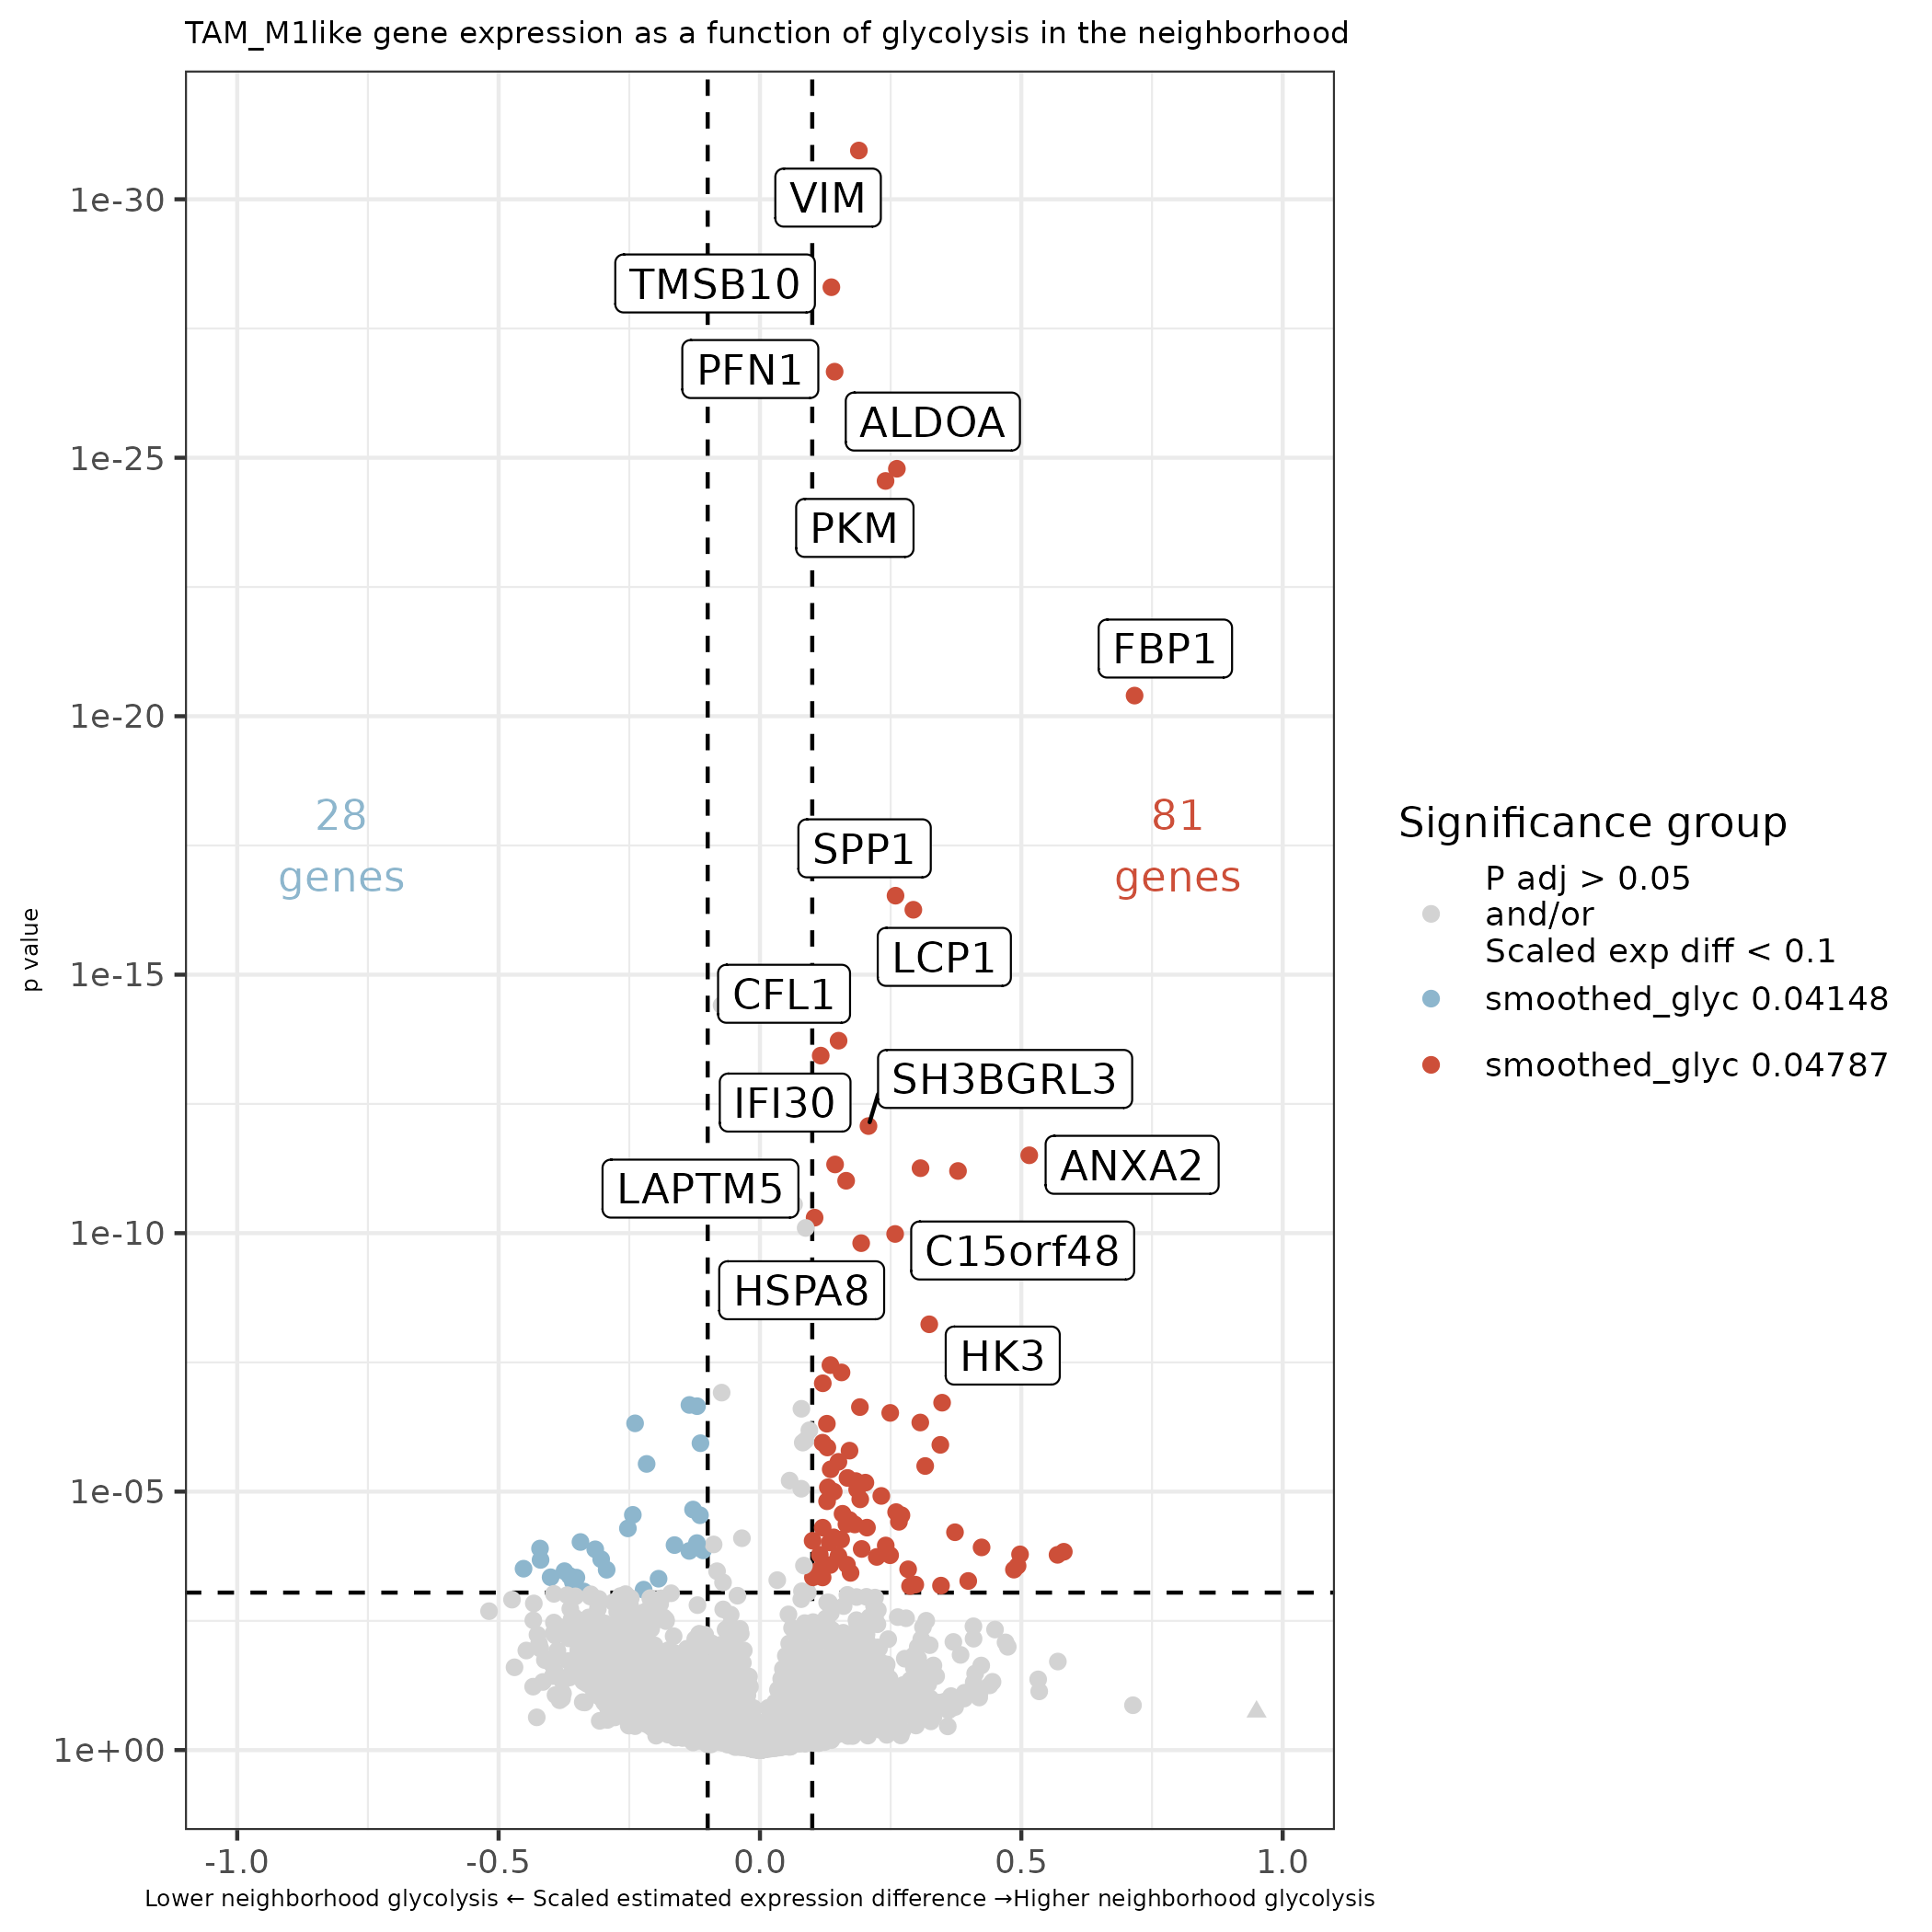
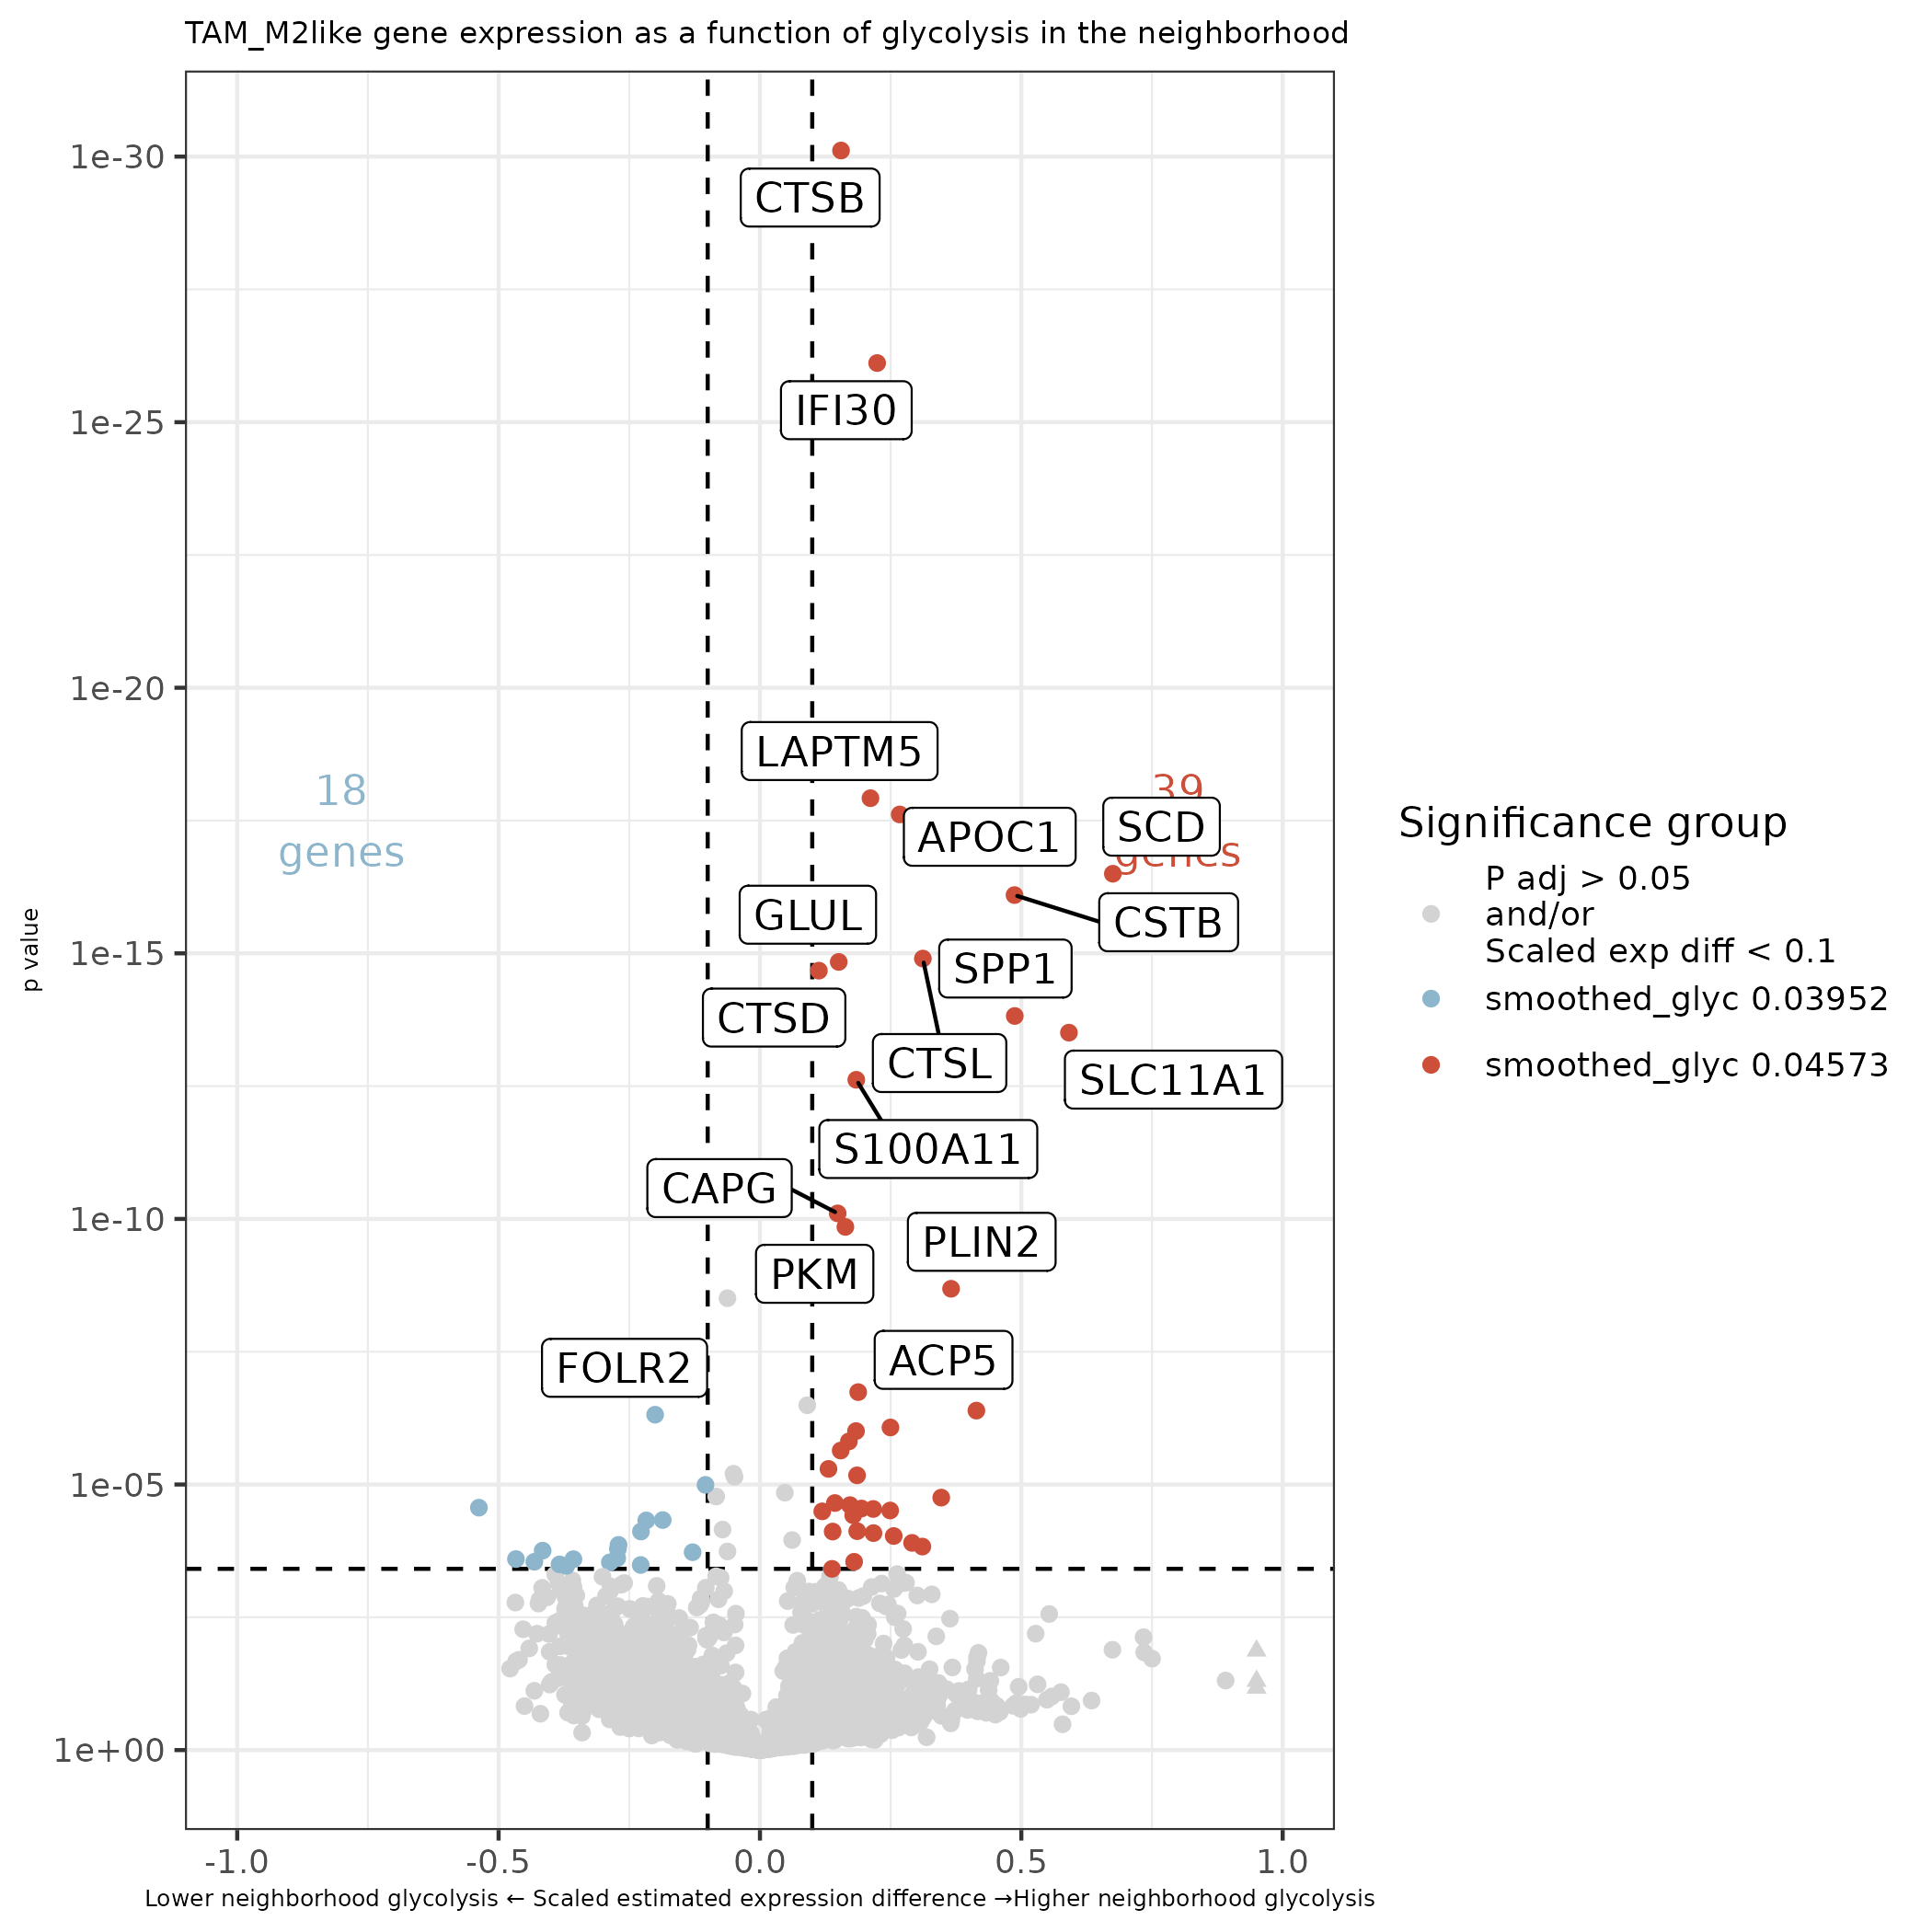
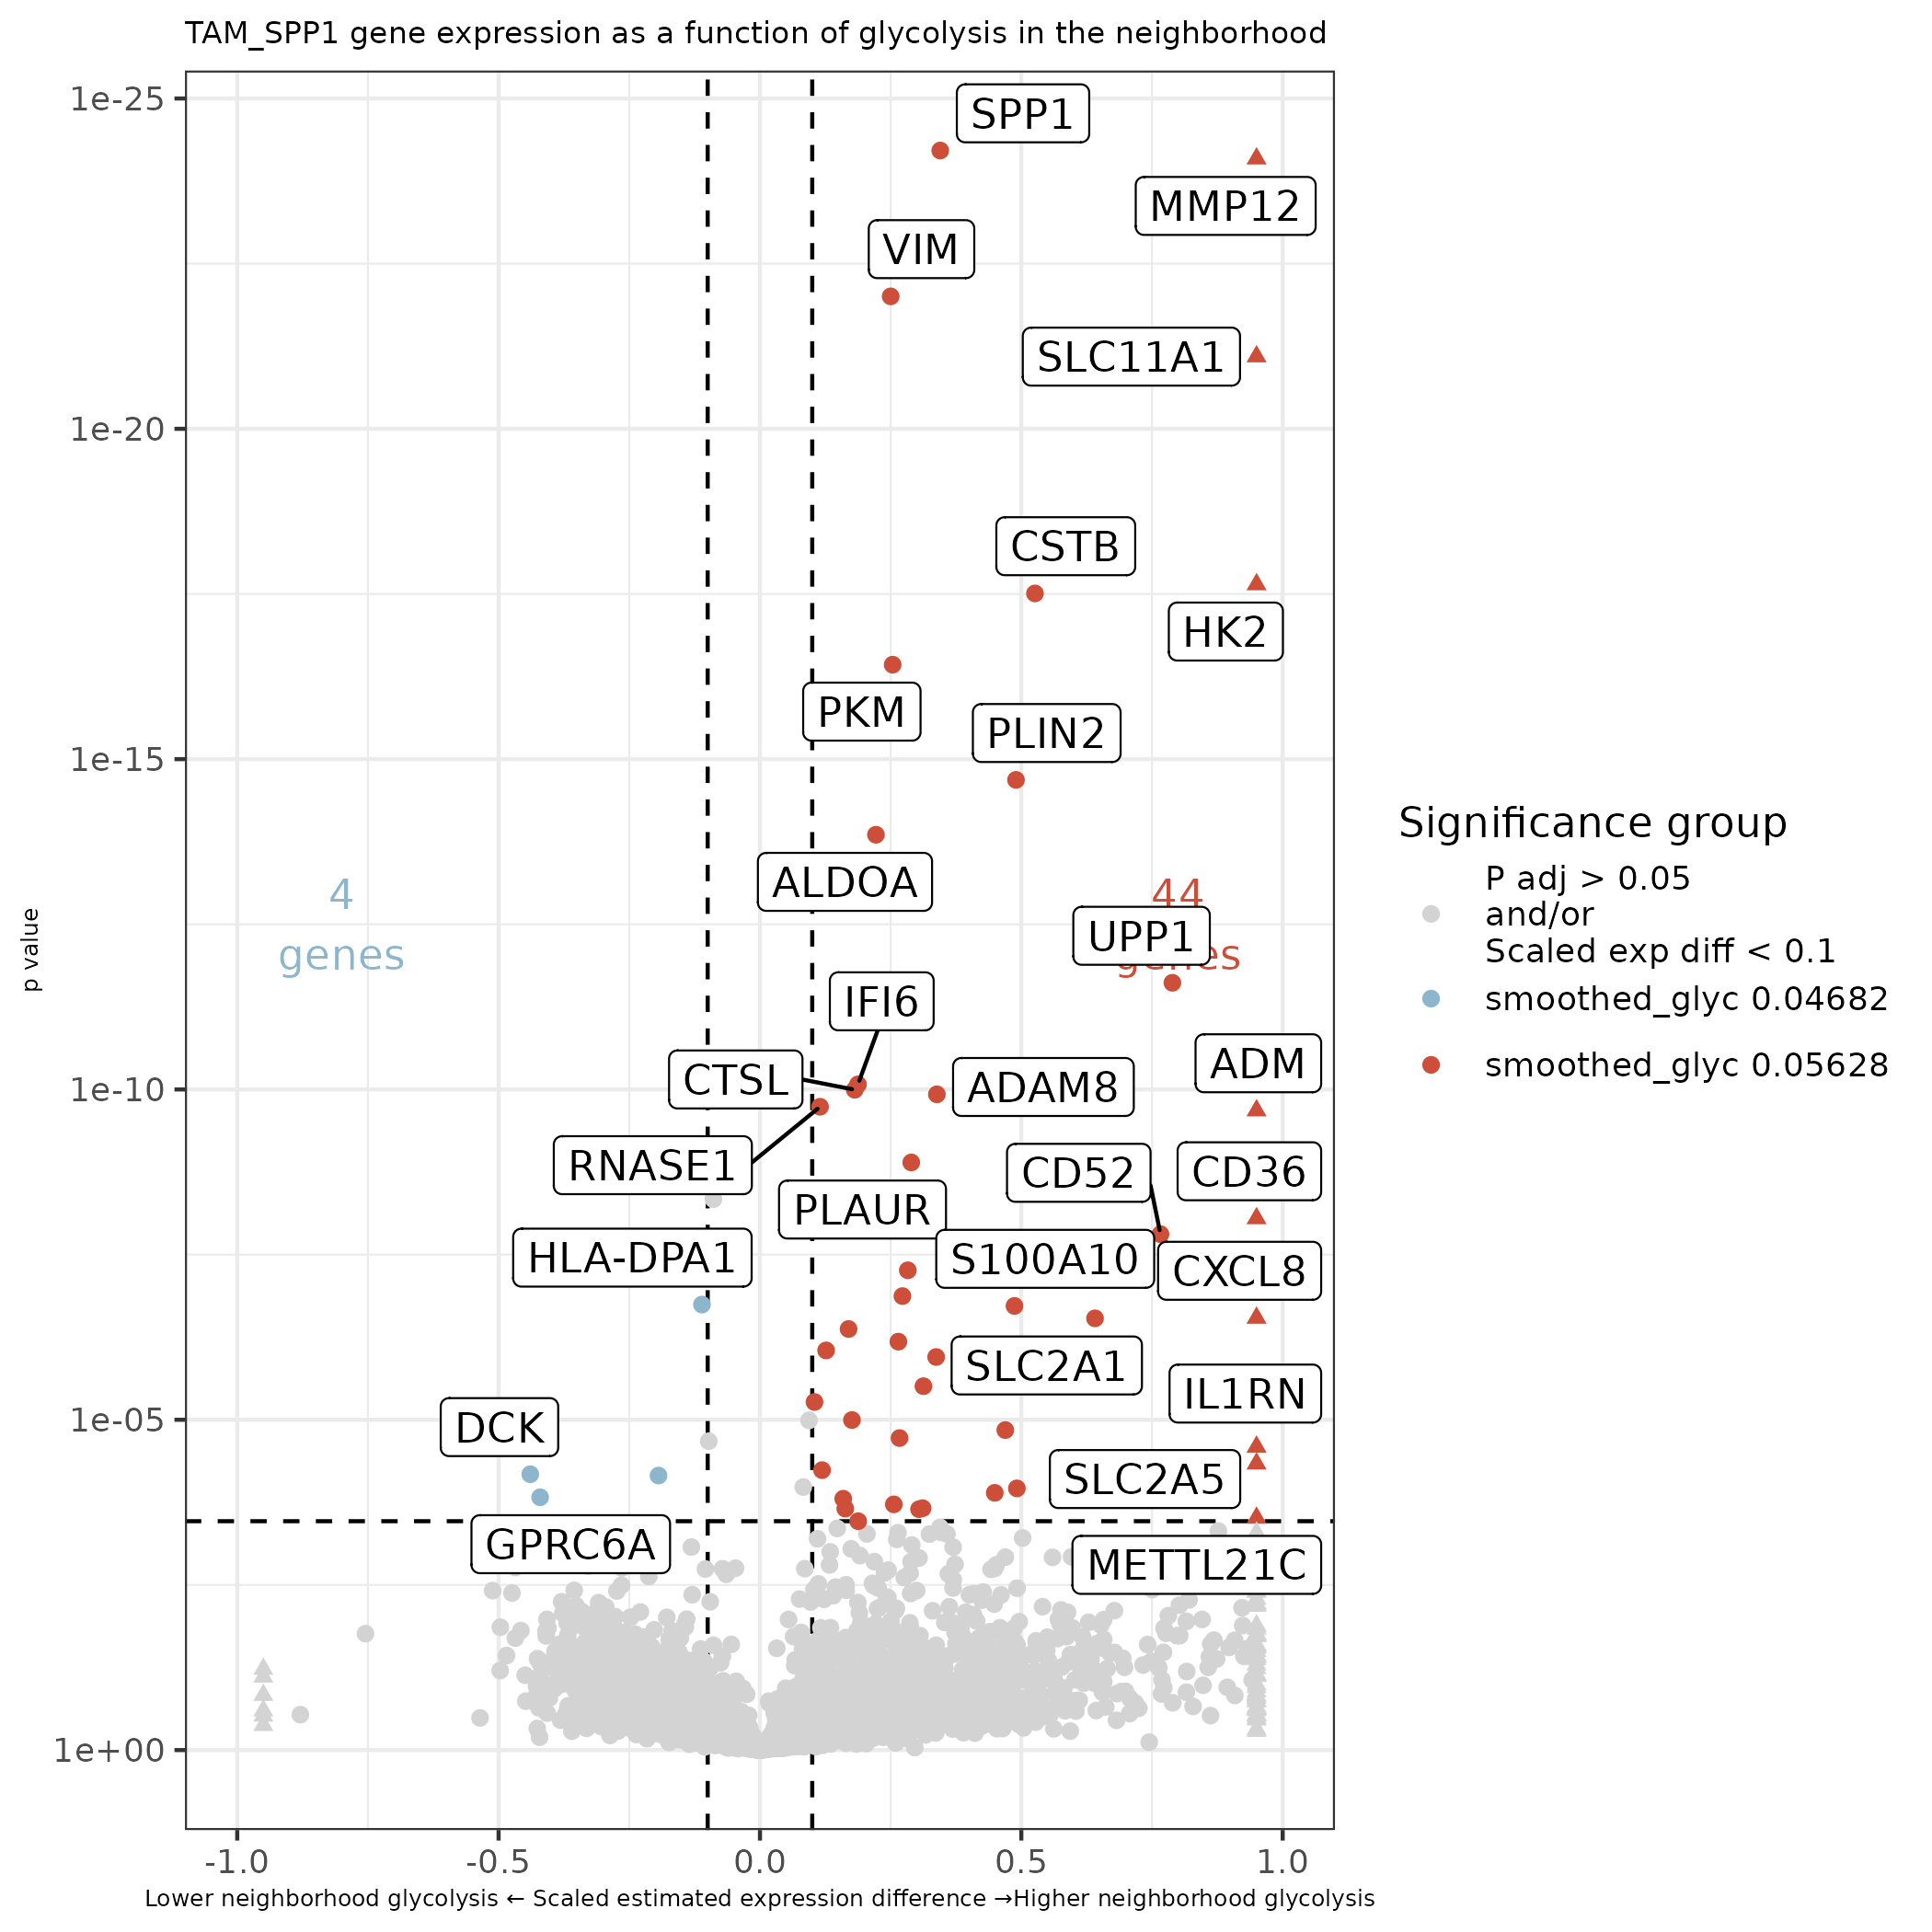
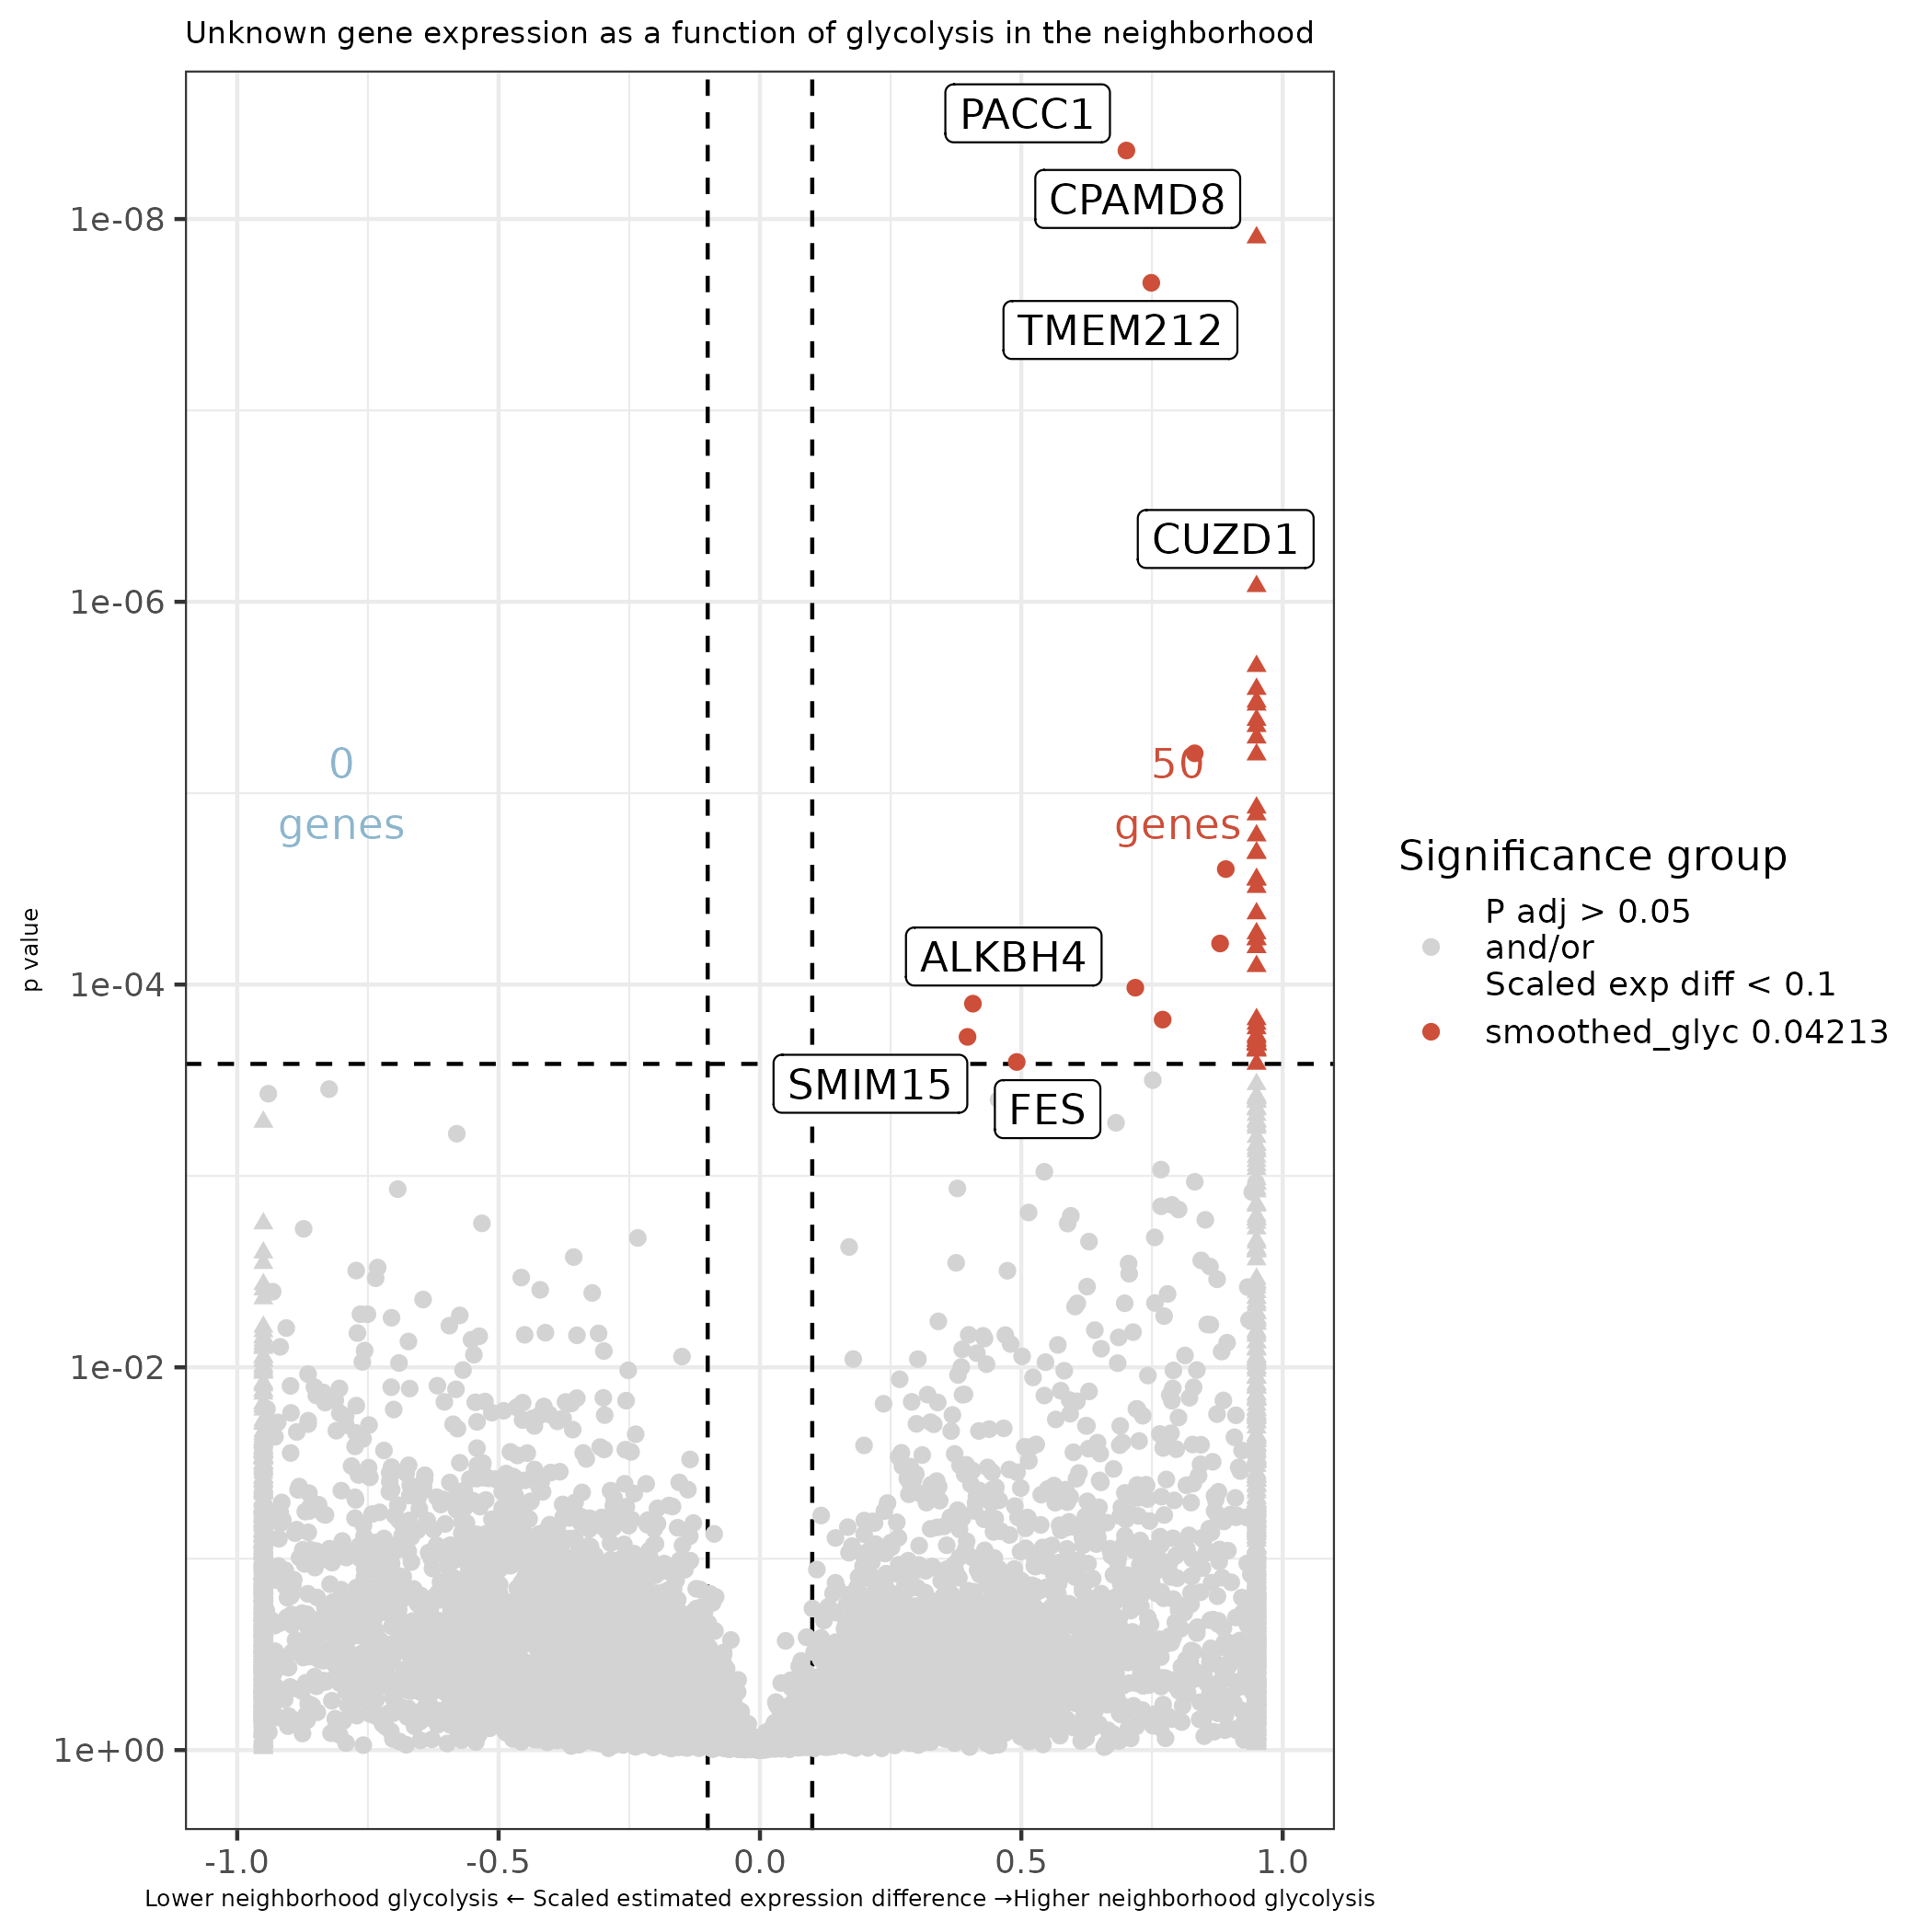
For every cell type, we make a volcano plot showing the estimated difference in expression between high and low glycolysis neighborhoods for each tested gene. Genes whose difference reached significance are colored and a subset are labeled. Also generate a table of DE results to be included as a supplementary table. Print each cell type to a separate sheet.
Show the code
# Generate a list of pairwise DE results filesde_result_files <-dir(paste0(metabolism_dir, "/Data/"), pattern ="^ct_.*smoothedGlycolysis_de_obj_plusNicheNeighborTumor\\.rds$")# Make a list of results to print to tableres_list <-list()#de_res_list <- list()for(de_file in de_result_files){ de_obj <-readRDS(paste0(metabolism_dir, "/Data/", de_file))# Extract cell type ct <-gsub("ct_", "", gsub("_smoothedGlycolysis_de_obj_plusNicheNeighborTumor.rds", "", de_file))# Extract pairwise results, which correspond to difference between mean and 1SD of glycolysis score pairwise.df <-results(de_obj, "pairwise")$pairwise pairwise.df <- pairwise.df %>%filter(term =="smoothed_glyc") # Adjust p-value pairwise.df$p.adj <-p.adjust(pairwise.df$p.value, method ="fdr") # Use fdr for padj res_list[[ct]] <-as.data.frame(pairwise.df)[,c("target", "estimate", "SE", "df", "t.ratio", "p.value","fold_change", "modelest_cpc_1", "modelest_cpc_2","term", "p.adj")]# Plot for each contrast, largely adapting smiDE volcano plot codefor(contrast inunique(pairwise.df$contrast)){ pairwise.df_i <-as.data.frame(pairwise.df)[which(pairwise.df$contrast == contrast),]# Extract comparison cc = pairwise.df_i$contrast[1] compv = compv <-strsplit(as.character(cc), "\\ vs.\\ ")[[1]]if(grepl(" [\\/-]\\ ", cc)) compv <-strsplit(as.character(cc), "\\ [\\/-]\\ ")[[1]]## Plot with scaled estimates to adjust for expression levels# Large estimates disrupt scaling, so cap them and change the shape pairwise.df_i$scaled_estimate <- pairwise.df_i$estimate / pairwise.df_i$modelest_cpc_2 pairwise.df_i$scaled_estimate_capped <-pmax(pmin(pairwise.df_i$scaled_estimate, 0.95), -0.95) pairwise.df_i$capped <-abs(pairwise.df_i$scaled_estimate) >0.95# x labels xrng <-c((max(abs(pairwise.df_i$scaled_estimate_capped)) *-1),max(abs(pairwise.df_i$scaled_estimate_capped))) xrng <-pretty(xrng)# Set up y labels nDigits <-function(x) suppressWarnings(as.integer(strsplit(x =formatC(formatC(x = x, format="e"), format ="s"), split ="e")[[1]][2])) pairwise.df_i <-as.data.table(pairwise.df_i) bonf<- pairwise.df_i[,0.05/(uniqueN(target) *uniqueN(contrast))] max.y <-nDigits(min(pairwise.df_i[,min(p.value)+10^-300], signif(bonf /2, 1))) ybrk <-1*10^pretty( c(-1:(max.y)) ) ylab <- ybrk# Add coloring est_cutoff =0.1 pairwise.df_i$sig_group =paste0("P adj > 0.05\nand/or\nScaled exp diff < ", est_cutoff) pairwise.df_i$sig_group[intersect(which(pairwise.df_i$p.adj <0.05),which((pairwise.df_i$scaled_estimate) > est_cutoff))] <- compv[1] pairwise.df_i$sig_group[intersect(which(pairwise.df_i$p.adj <0.05),which((pairwise.df_i$scaled_estimate) <-est_cutoff))] <- compv[2] my_cols =c("tomato3", "lightskyblue3", "lightgrey")names(my_cols) =c(compv[1], compv[2],paste0("P adj > 0.05\nand/or\nScaled exp diff < ", est_cutoff))# Set up yintercept for pval cutoff pval_cutoff_y <- pairwise.df %>%filter(p.adj <0.05) %>%pull(p.value) %>%max()# Plot with top DE genes labeledggplot(pairwise.df_i,aes(x = scaled_estimate_capped, y = p.value +10^-300)) +geom_hline(yintercept = pval_cutoff_y, linetype =2) +geom_vline(xintercept = est_cutoff, linetype =2) +geom_vline(xintercept =-est_cutoff, linetype =2) +geom_point(aes(color = sig_group, shape = capped)) +scale_shape_manual(values =c(`FALSE`=19, `TRUE`=17)) +scale_color_manual(values = my_cols, name ="Significance group") +scale_y_continuous(trans = smiDE:::change_axis_revlog_trans(base=10),breaks = ybrk,labels =formatC(ylab, format ="e", digits =0)) +scale_x_continuous(breaks = xrng, limits =range(xrng)) +theme_bw() +ylab("p value") +xlab(paste0("Lower neighborhood glycolysis ", sprintf('\u2190')," Scaled estimated expression difference ",sprintf('\u2192'), "Higher neighborhood glycolysis" )) +geom_text(data = pairwise.df[1,],aes(label =paste0(sum(pairwise.df_i$sig_group == compv[1]), "\ngenes"),x =max(xrng)*0.8, y =sqrt(min(ybrk))),color = my_cols[[compv[1]]]) +geom_text(data = pairwise.df[1,],aes(label =paste0(sum(pairwise.df_i$sig_group == compv[2]), "\ngenes"),x =min(xrng)*0.8, y =sqrt(min(ybrk))),color = my_cols[[compv[2]]]) +ggtitle(paste0(ct," gene expression as a function of glycolysis in the neighborhood")) +theme(plot.title =element_text(size =8)) +theme(axis.title.x =element_text(size =6)) +theme(axis.title.y =element_text(size =6)) +geom_label_repel(data = pairwise.df_i %>%filter(!grepl("P adj", sig_group)),aes(x = scaled_estimate_capped, y = p.value +10^-300,label = target)) +guides(shape ="none")ggsave(filename =paste0(metabolism_dir, "/Plots/", gsub("+", "", ct), "_volcano_GLYCneighborhoodDifferences_scaledEstDiff_", compv[1], "vs", compv[2], "_withGeneLabels_v2.png")) }}# Print tables of results to excel filexlsx_path <-file.path(metabolism_dir, "Data", "GlycolysisDE_by_celltype.xlsx")writexl::write_xlsx(res_list, path = xlsx_path)
Volcano plot showing expression difference as a function of neighborhood glycolysis for all cell types:
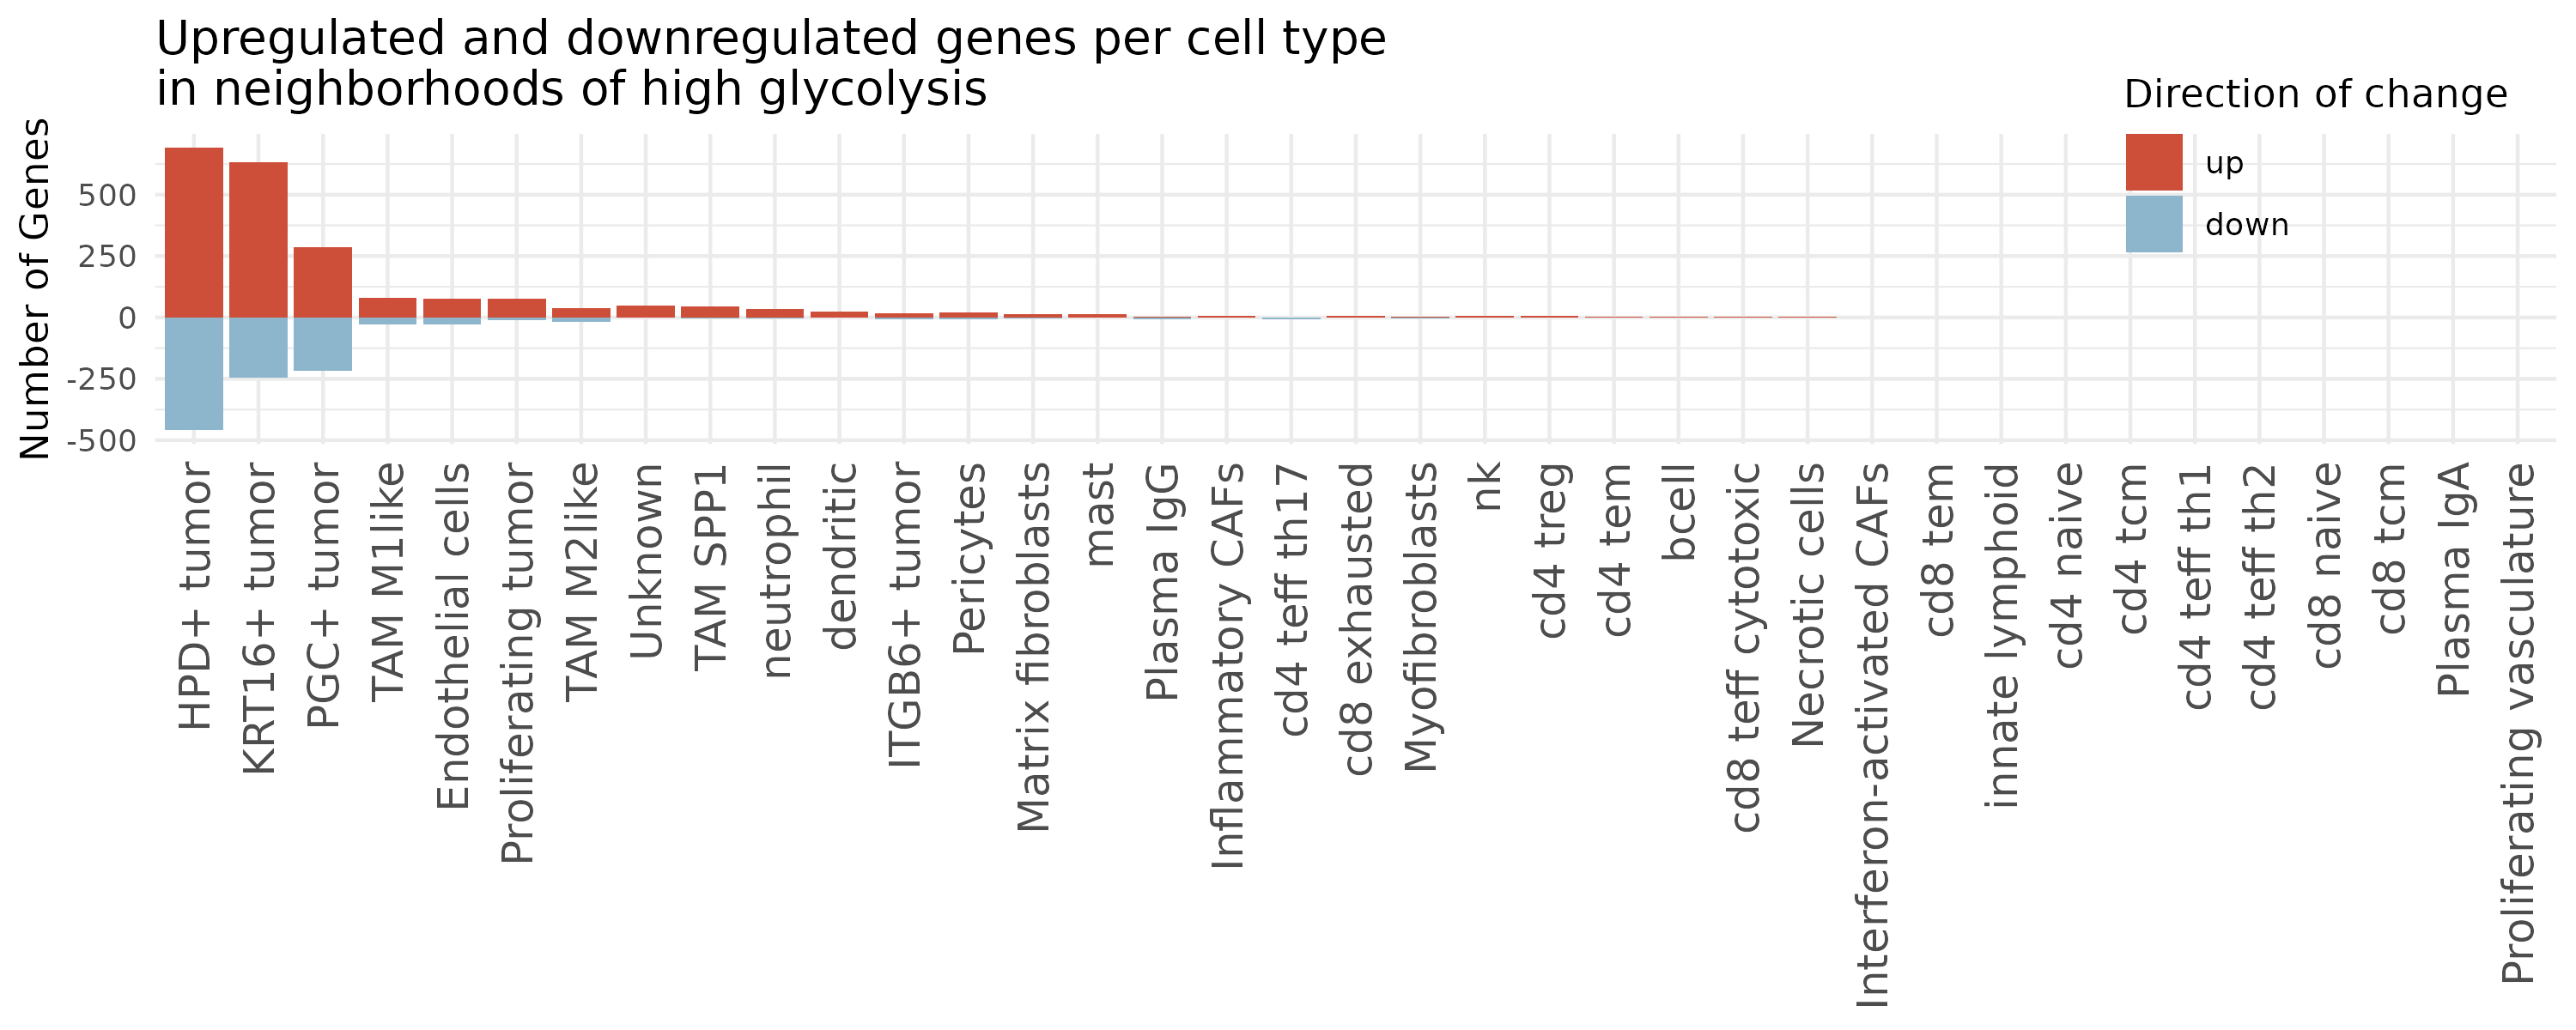
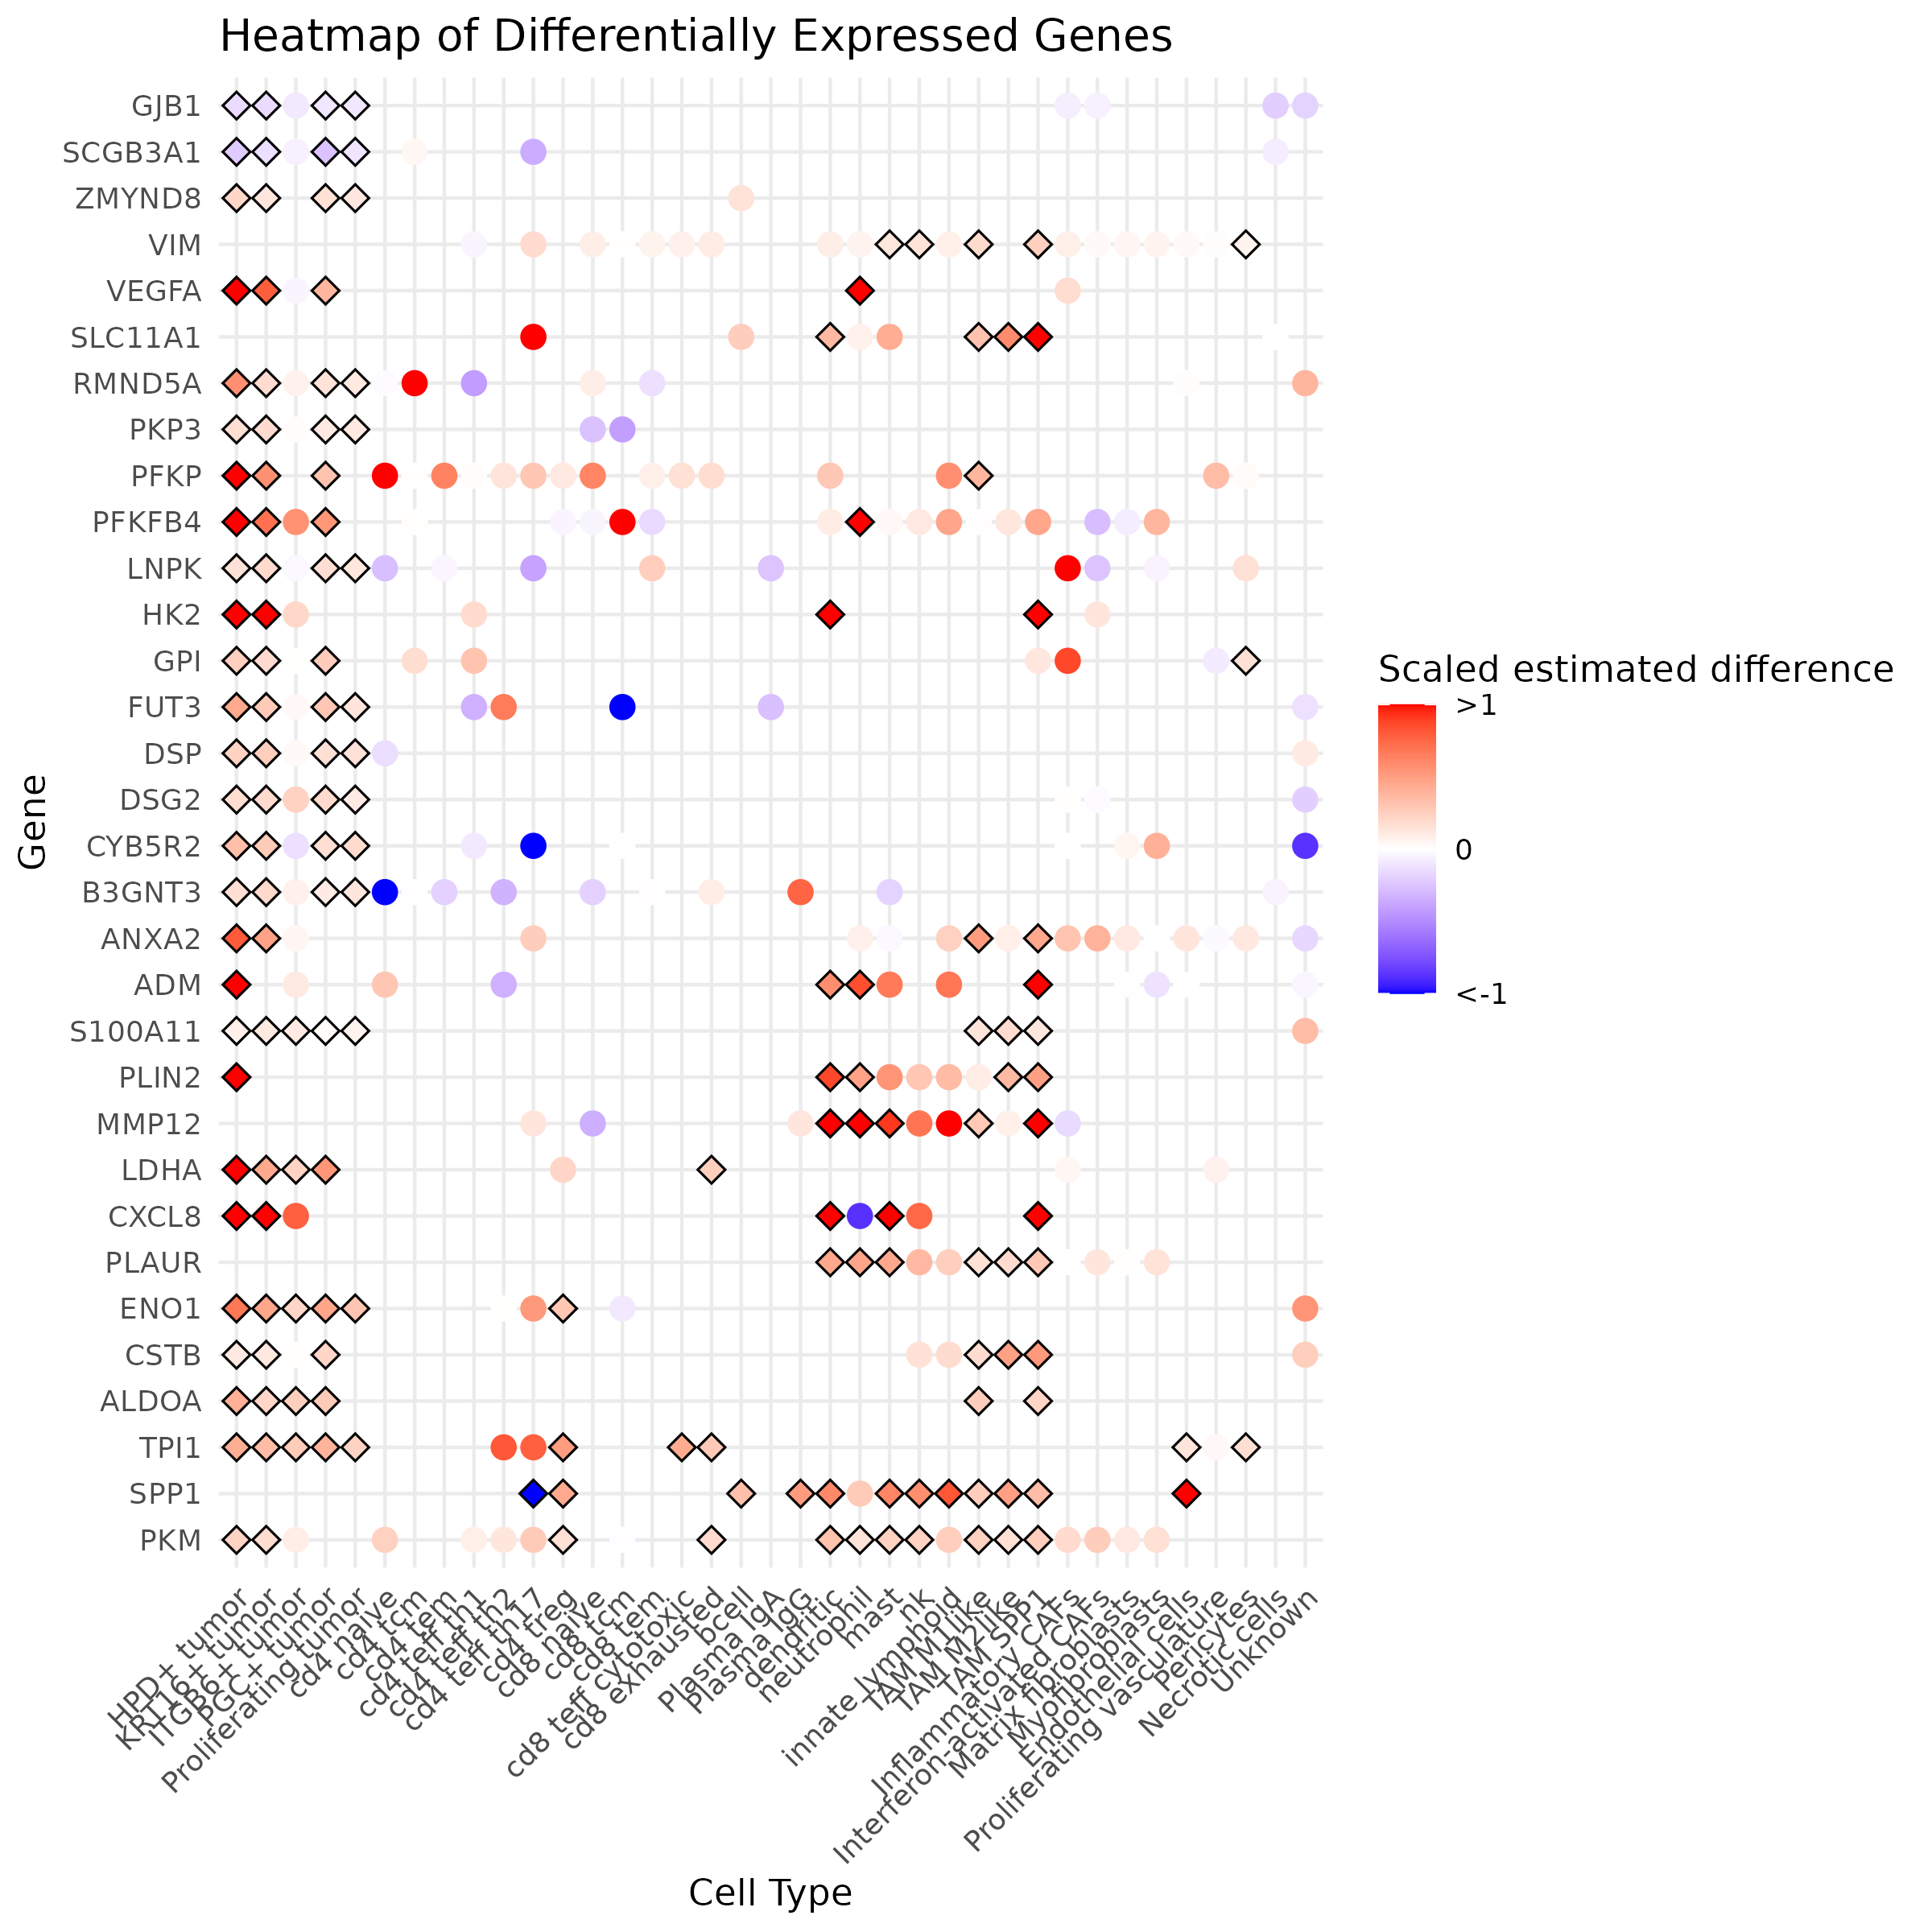
Additionally, we make summary plots to show results across all cell types. We generate a bar plot showing the number of genes called as significantly different across cell types and a heatmap showing most consistent genes across cell types.
Show the code
# Generate a list of pairwise DE resultsde_result_files <-dir(paste0(metabolism_dir, "/Data/"), pattern ="^ct_.*smoothedGlycolysis_de_obj_plusNicheNeighborTumor\\.rds$")de_res_list <-list()for(de_file in de_result_files){ res <-readRDS(paste0(metabolism_dir, "/Data/", de_file)) pairwise.df <-results(res)$pairwise pairwise.df <- pairwise.df %>%filter(term =="smoothed_glyc")# Extract cell type ct <-gsub("ct_", "", gsub("_smoothedGlycolysis_de_obj_plusNicheNeighborTumor.rds", "", de_file))# Convert underscore to space ct <-gsub("_", " ", ct)# Add a + for tumor cells except proliferating ct <-gsub(" tumor", "+ tumor", ct) ct <-gsub("Proliferating\\+", "Proliferating", ct) de_res_list[[ct]] <- pairwise.df}# Define a function to add the adjusted p-valuesadd_p_adj <-function(df) { df$p.adj <-p.adjust(df$p.value, method ="fdr") # Note the method used herereturn(df)}# Apply the function to each data frame in the listde_res_list <-lapply(de_res_list, add_p_adj)## Barplot showing the number of genes that are up or down regulated per cell type# count significant genessig_genes <-list()# Iterate through each data frame in the listfor (ct_name innames(de_res_list)) { df <- de_res_list[[ct_name]]# Filter for significant genes significant_genes <- df %>%filter(p.adj <0.05) %>%filter(abs(estimate/modelest_cpc_2) >0.1)# Count upregulated genes upregulated <-sum(significant_genes$estimate/significant_genes$modelest_cpc_2 >0.1)# Count downregulated genes downregulated <-sum(significant_genes$estimate/significant_genes$modelest_cpc_2 <-0.1)# Count total genes evaluated tot_genes <-nrow(df)# Store the results in a data frame sig_genes[[ct_name]] <-data.frame(ct = ct_name,direction =c("up", "down"),nGenes =c(upregulated, downregulated),totGenes = tot_genes )}# Combine all results into a single data framesig_genes <-do.call(rbind, sig_genes)# Order cell types by total genes changestot_genes_changed <-aggregate(sig_genes$nGenes ~ sig_genes$ct, FUN ="sum")ct_order <- tot_genes_changed[order(tot_genes_changed[,2], decreasing = T),1]sig_genes$ct <-factor(sig_genes$ct, levels = ct_order)# Order direction for legend plottingsig_genes$direction <-factor(sig_genes$direction, levels =c("up", "down"))ggplot(sig_genes, aes(x = ct, y =ifelse(direction =="up", nGenes, -nGenes), fill = direction)) +geom_bar(stat ="identity") +scale_fill_manual(values =c("up"="tomato3", "down"="lightskyblue3")) +theme_minimal() +labs(title ="Upregulated and downregulated genes per cell type\nin neighborhoods of high glycolysis",#x = "Cell Type",y ="Number of Genes",fill ="Direction of change") +theme(axis.text.x =element_text(angle =90, hjust =1, vjust =0.5, size =12),axis.title.x =element_blank(),legend.position =c(0.9, 0.9))ggsave(paste0(metabolism_dir, "/Plots/Barplot_sigGenes_glycolysisNeighborhood_byCT_scaledEstDiff_v2.png"),width =10, height =4, units ="in")# Heatmap showing differences across multiple cell types## Choose genes to show# Initialize lists to store upregulated and downregulated genesupregulated_genes <-list()downregulated_genes <-list()# Iterate through each data frame in the listfor (ct_name innames(de_res_list)) { df <- de_res_list[[ct_name]]# Filter for significant upregulated genes significant_upregulated <- df %>%filter(p.adj <0.05) %>%filter(estimate/modelest_cpc_2 >0.1) upregulated_genes[[ct_name]] <- significant_upregulated$target# Filter for significant downregulated genes significant_downregulated <- df %>%filter(p.adj <0.05) %>%filter(estimate/modelest_cpc_2 <-0.1) downregulated_genes[[ct_name]] <- significant_downregulated$target}# Combine all upregulated and downregulated genes into single vectorsall_upregulated_genes <-unlist(upregulated_genes)all_downregulated_genes <-unlist(downregulated_genes)# Count the occurrences of each geneup_gene_counts <-table(all_upregulated_genes)down_gene_counts <-table(all_downregulated_genes)# Sort genes by their counts in descending ordersorted_up_genes <-sort(up_gene_counts, decreasing =TRUE)sorted_down_genes <-sort(down_gene_counts, decreasing =TRUE)# Select genes that are significant in at least 4 cell types in a consistent directiontop_up_genes <-names(sorted_up_genes)[which(sorted_up_genes >3)]top_down_genes <-names(sorted_down_genes)[which(sorted_down_genes >3)]# Combine the top genestop_genes <-unique(c(top_up_genes, rev(top_down_genes)))## Make df of genes to show# Initialize an empty data frame to store the heatmap dataheatmap_data <-data.frame()# Iterate through each data frame in the listfor (ct_name innames(de_res_list)) { df <- de_res_list[[ct_name]]# Filter for the top genes df_top_genes <- df %>%filter(target %in% top_genes)# Add cell type information df_top_genes$ct <- ct_name# Append to the heatmap data frame heatmap_data <-rbind(heatmap_data, df_top_genes)}# Add a column for significanceheatmap_data$significant <- heatmap_data$p.adj <0.05# Set order of genes to have most consistently up -> most consistently downheatmap_data$target <-factor(heatmap_data$target, levels = top_genes)# Set order of cell types to align with other figures and be grouped by major typeheatmap_data$ct <-factor(heatmap_data$ct,levels =gsub("_", " ", names(results_list$minor_cell_type_color_pal_manual)))## Plot it# Create the dot plot heatmapggplot(heatmap_data, aes(x = ct, y = target)) +geom_point(size =0) +geom_point(data = heatmap_data %>%filter(significant ==TRUE),aes(x = ct, y = target), color ="black", size =4, shape =18) +geom_point(data = heatmap_data, aes(x = ct, y = target, color = estimate/modelest_cpc_2, shape = significant),size =3) +scale_color_gradient2(low ="blue", mid ="white", high ="red", midpoint =0,limits =c(-1, 1),oob = squish,breaks =c(-1, 0, 1),labels =c("<-1", "0", ">1")) +scale_size_manual(values =c(2,3), guide ="none") +scale_shape_manual(values =c('TRUE'=18, 'FALSE'=19), guide ="none") +theme_minimal() +labs(title ="Heatmap of Differentially Expressed Genes",x ="Cell Type",y ="Gene",color ="Scaled estimated difference") +theme(axis.text.x =element_text(angle =45, hjust =1))ggsave(paste0(metabolism_dir, "/Plots/heatmap_ct_x_gene_mostDE_glycolysisNeighborhood_scaledEstDiff_v2.png"),width =8, height =8, units ="in")
Bar plot of the number of genes that are up / down regulated in each cell type as neighborhood glycolysis increases.