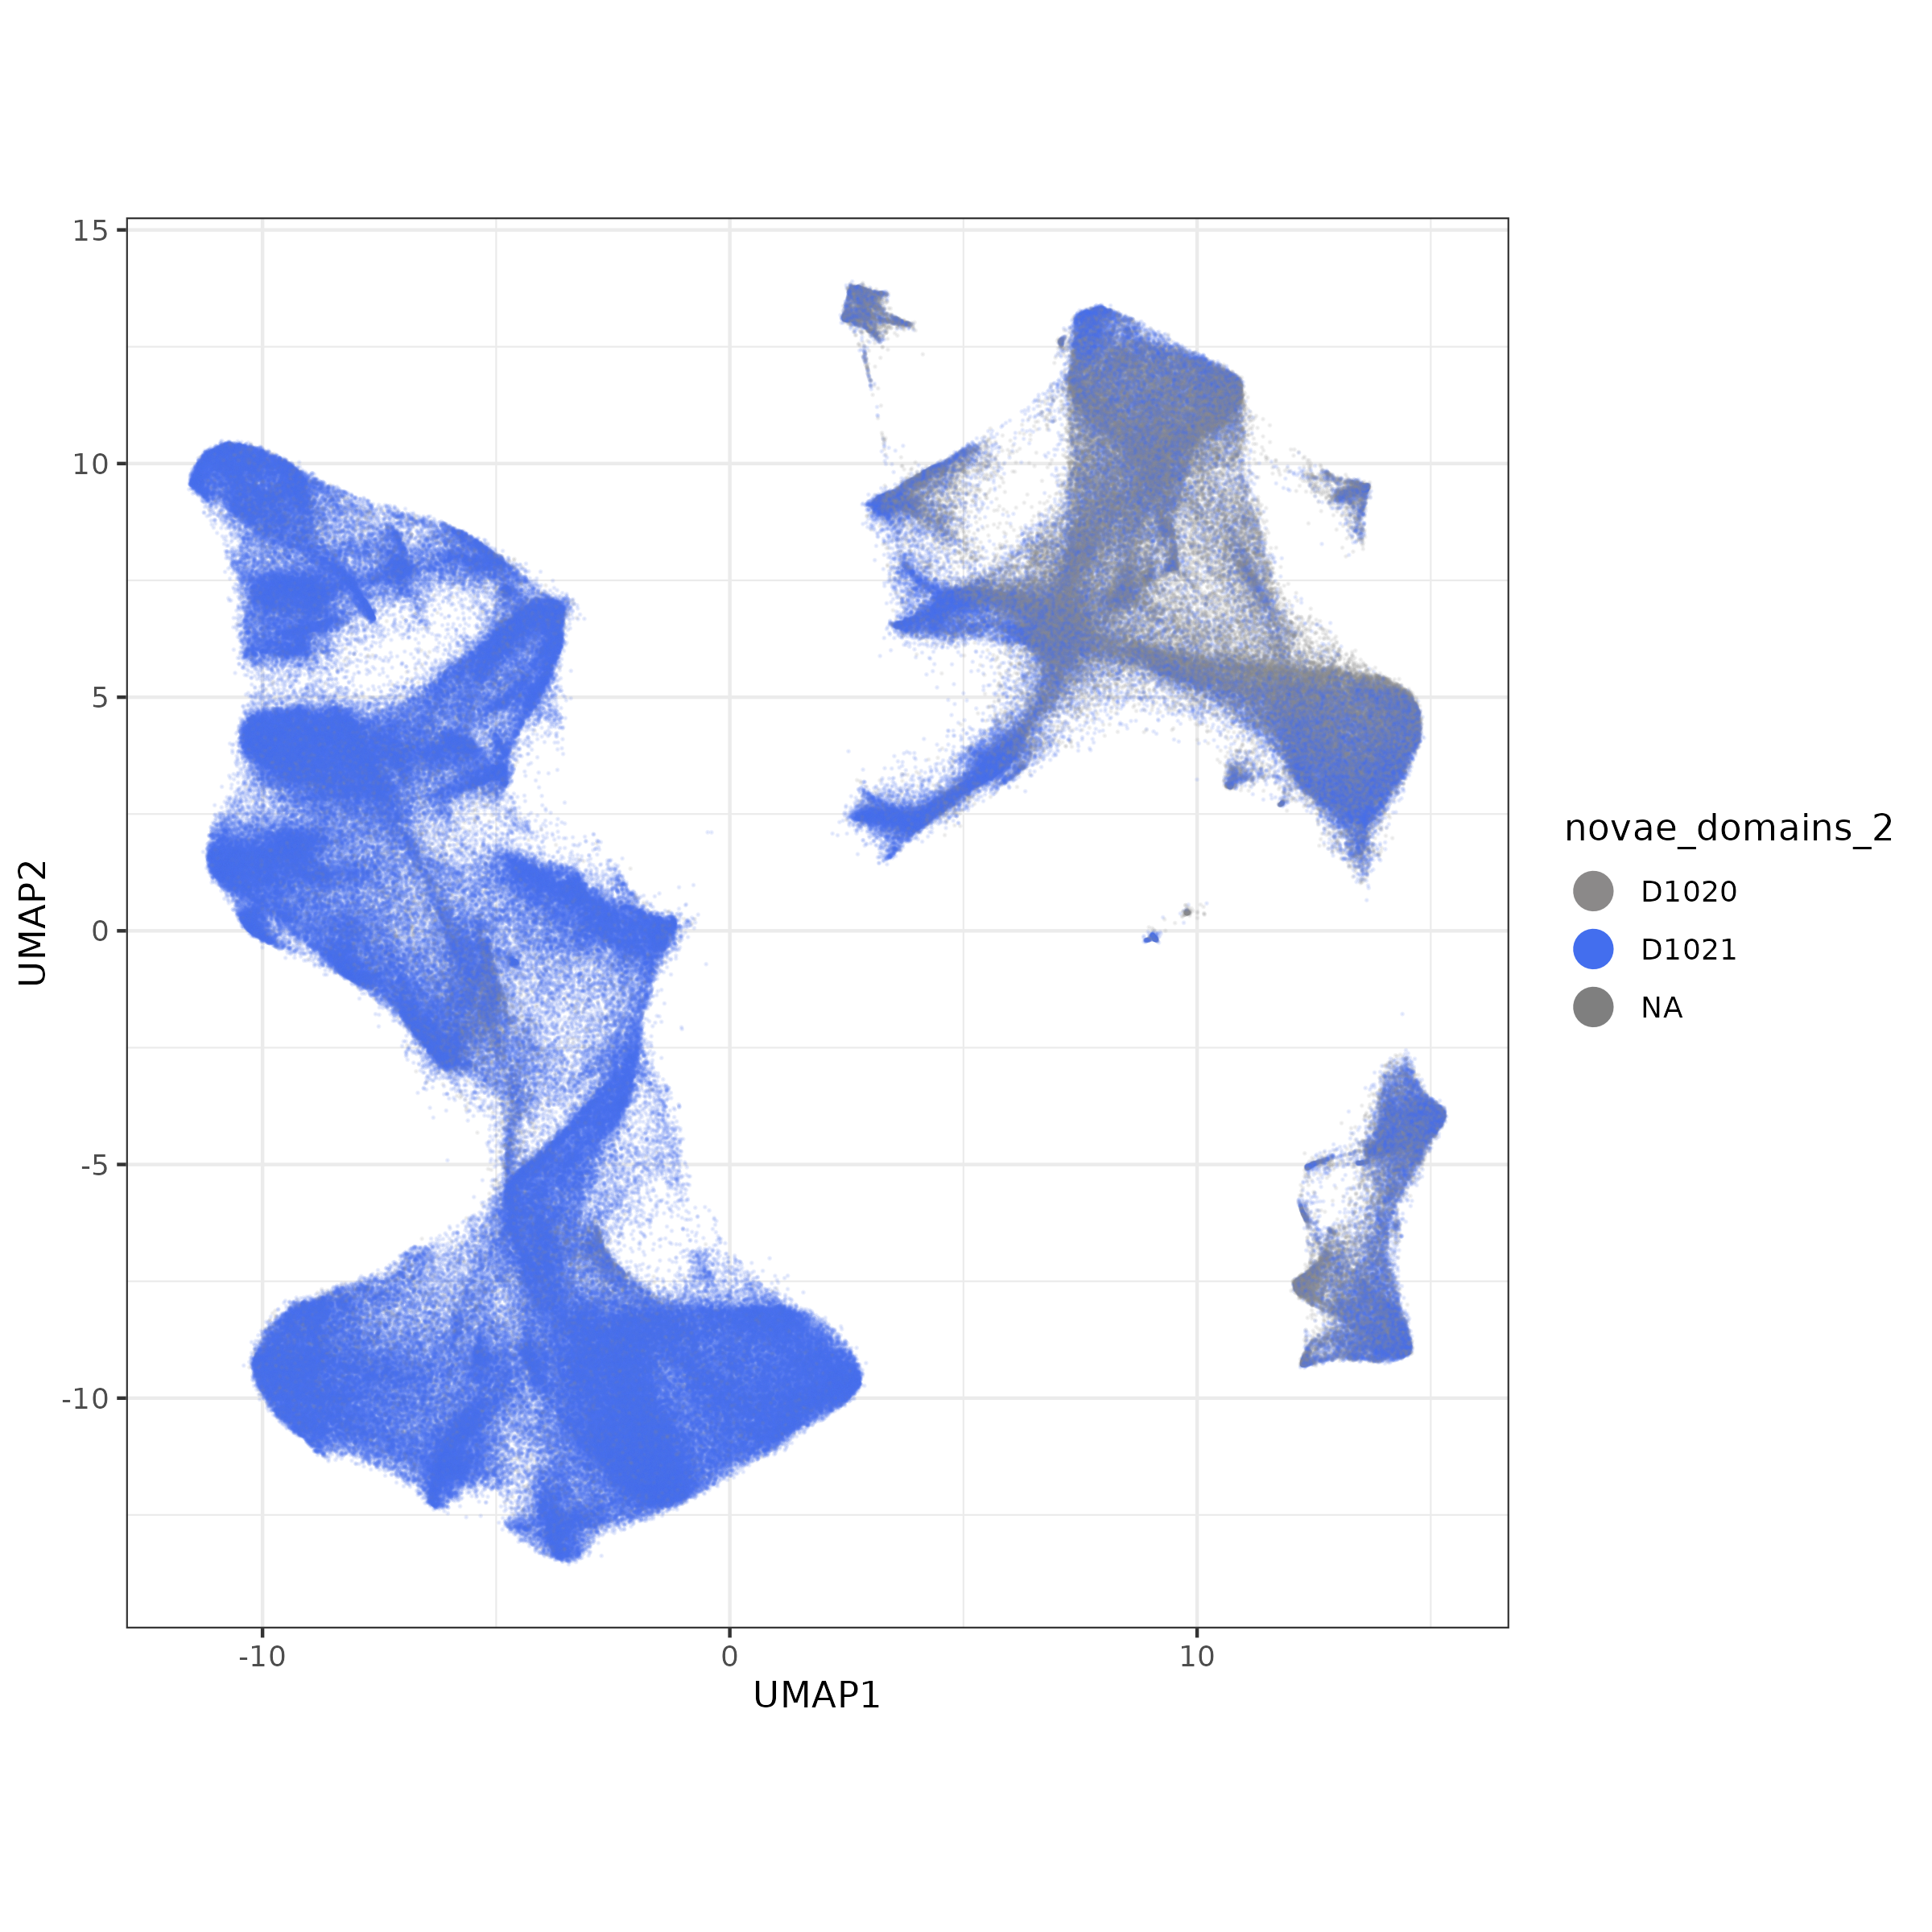
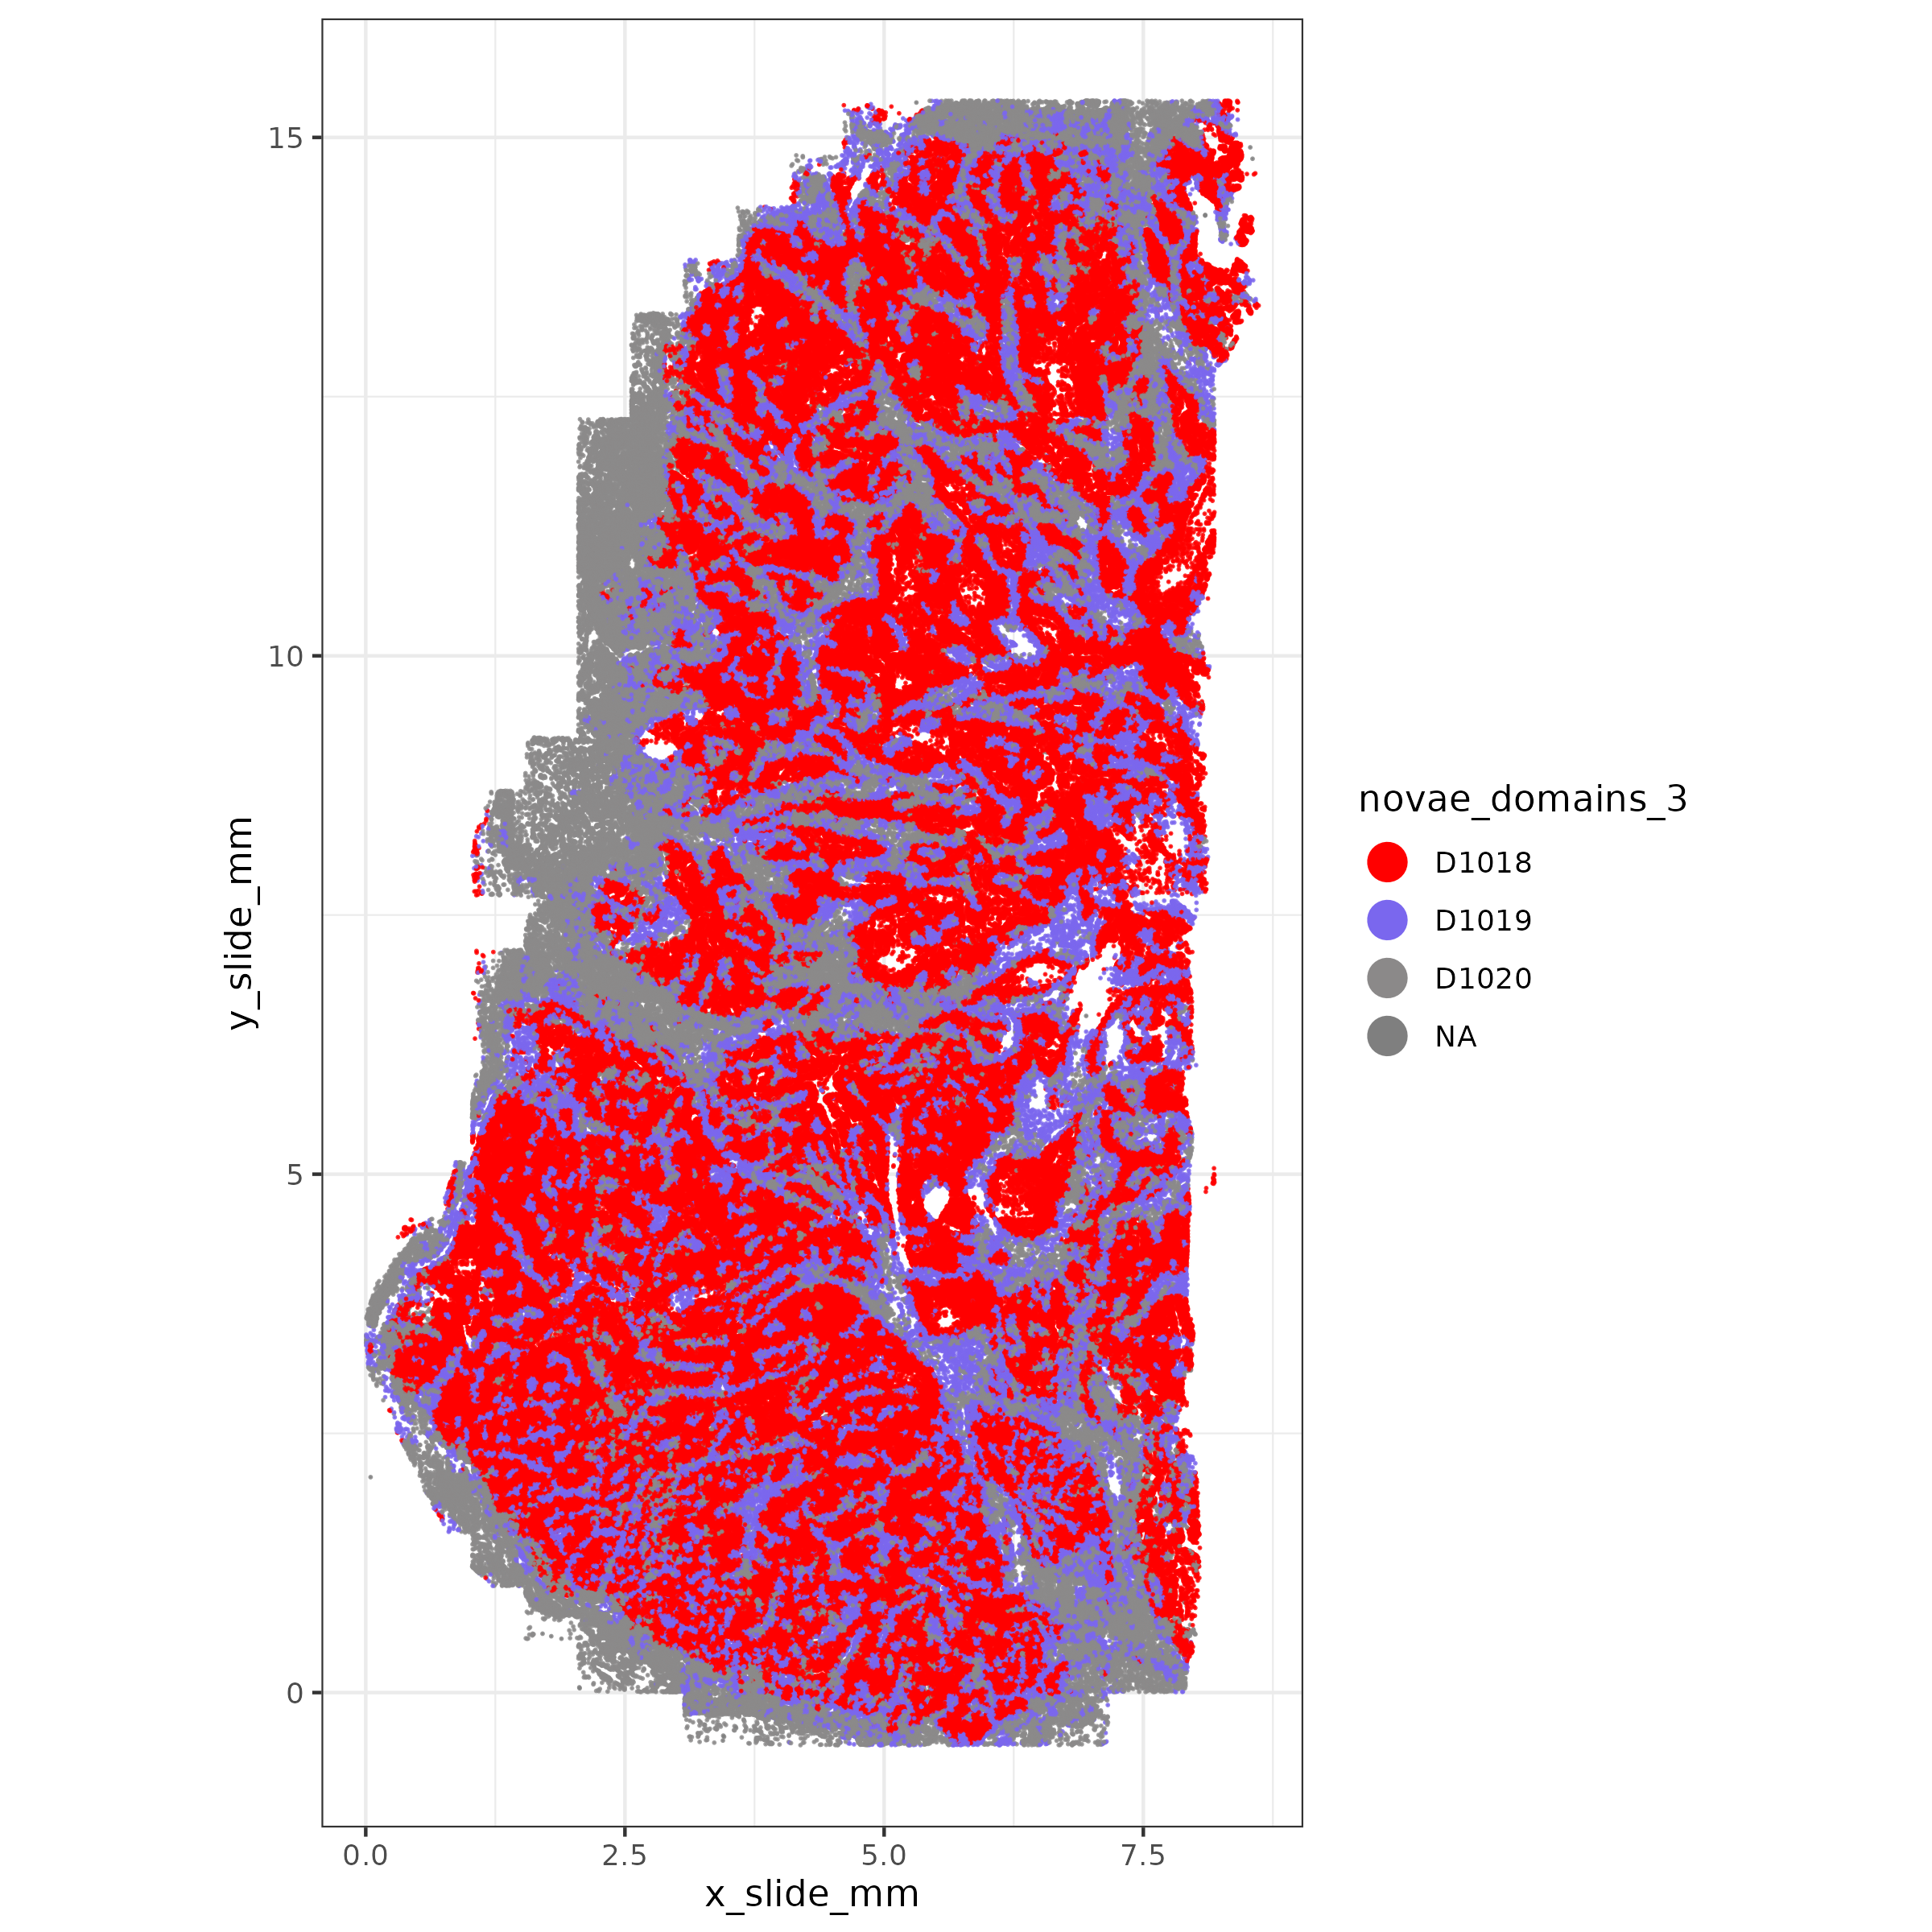
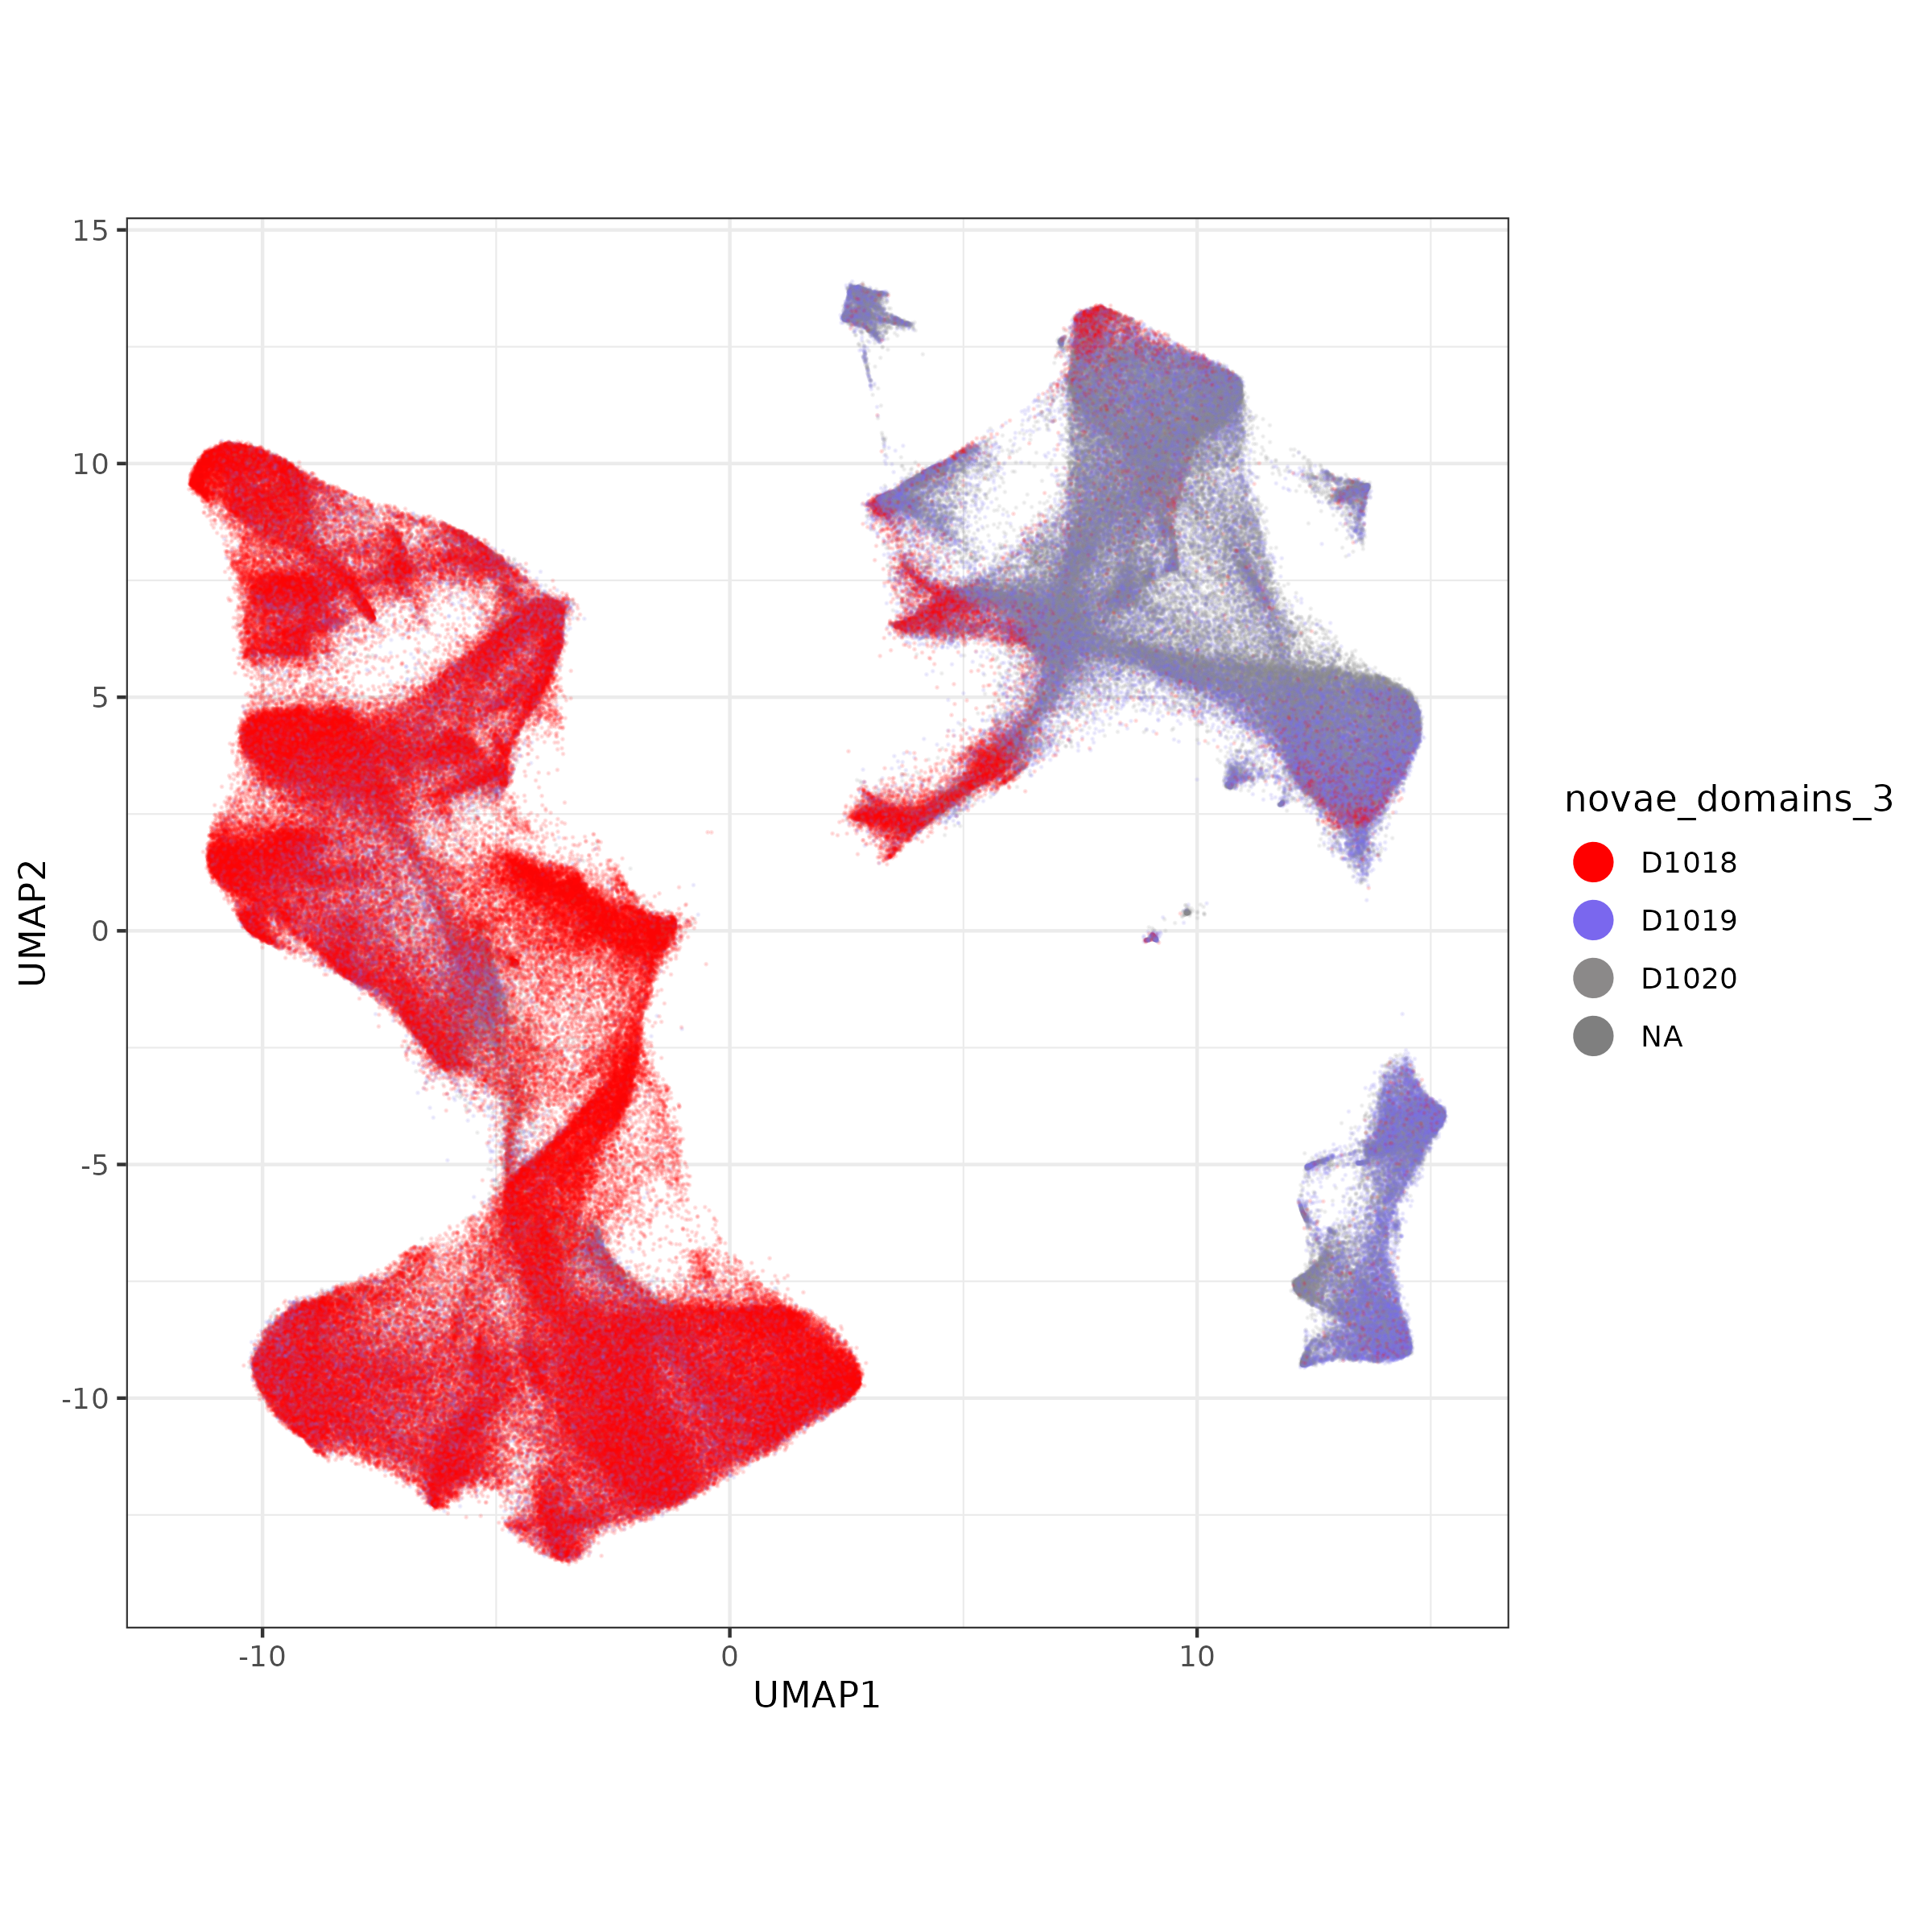
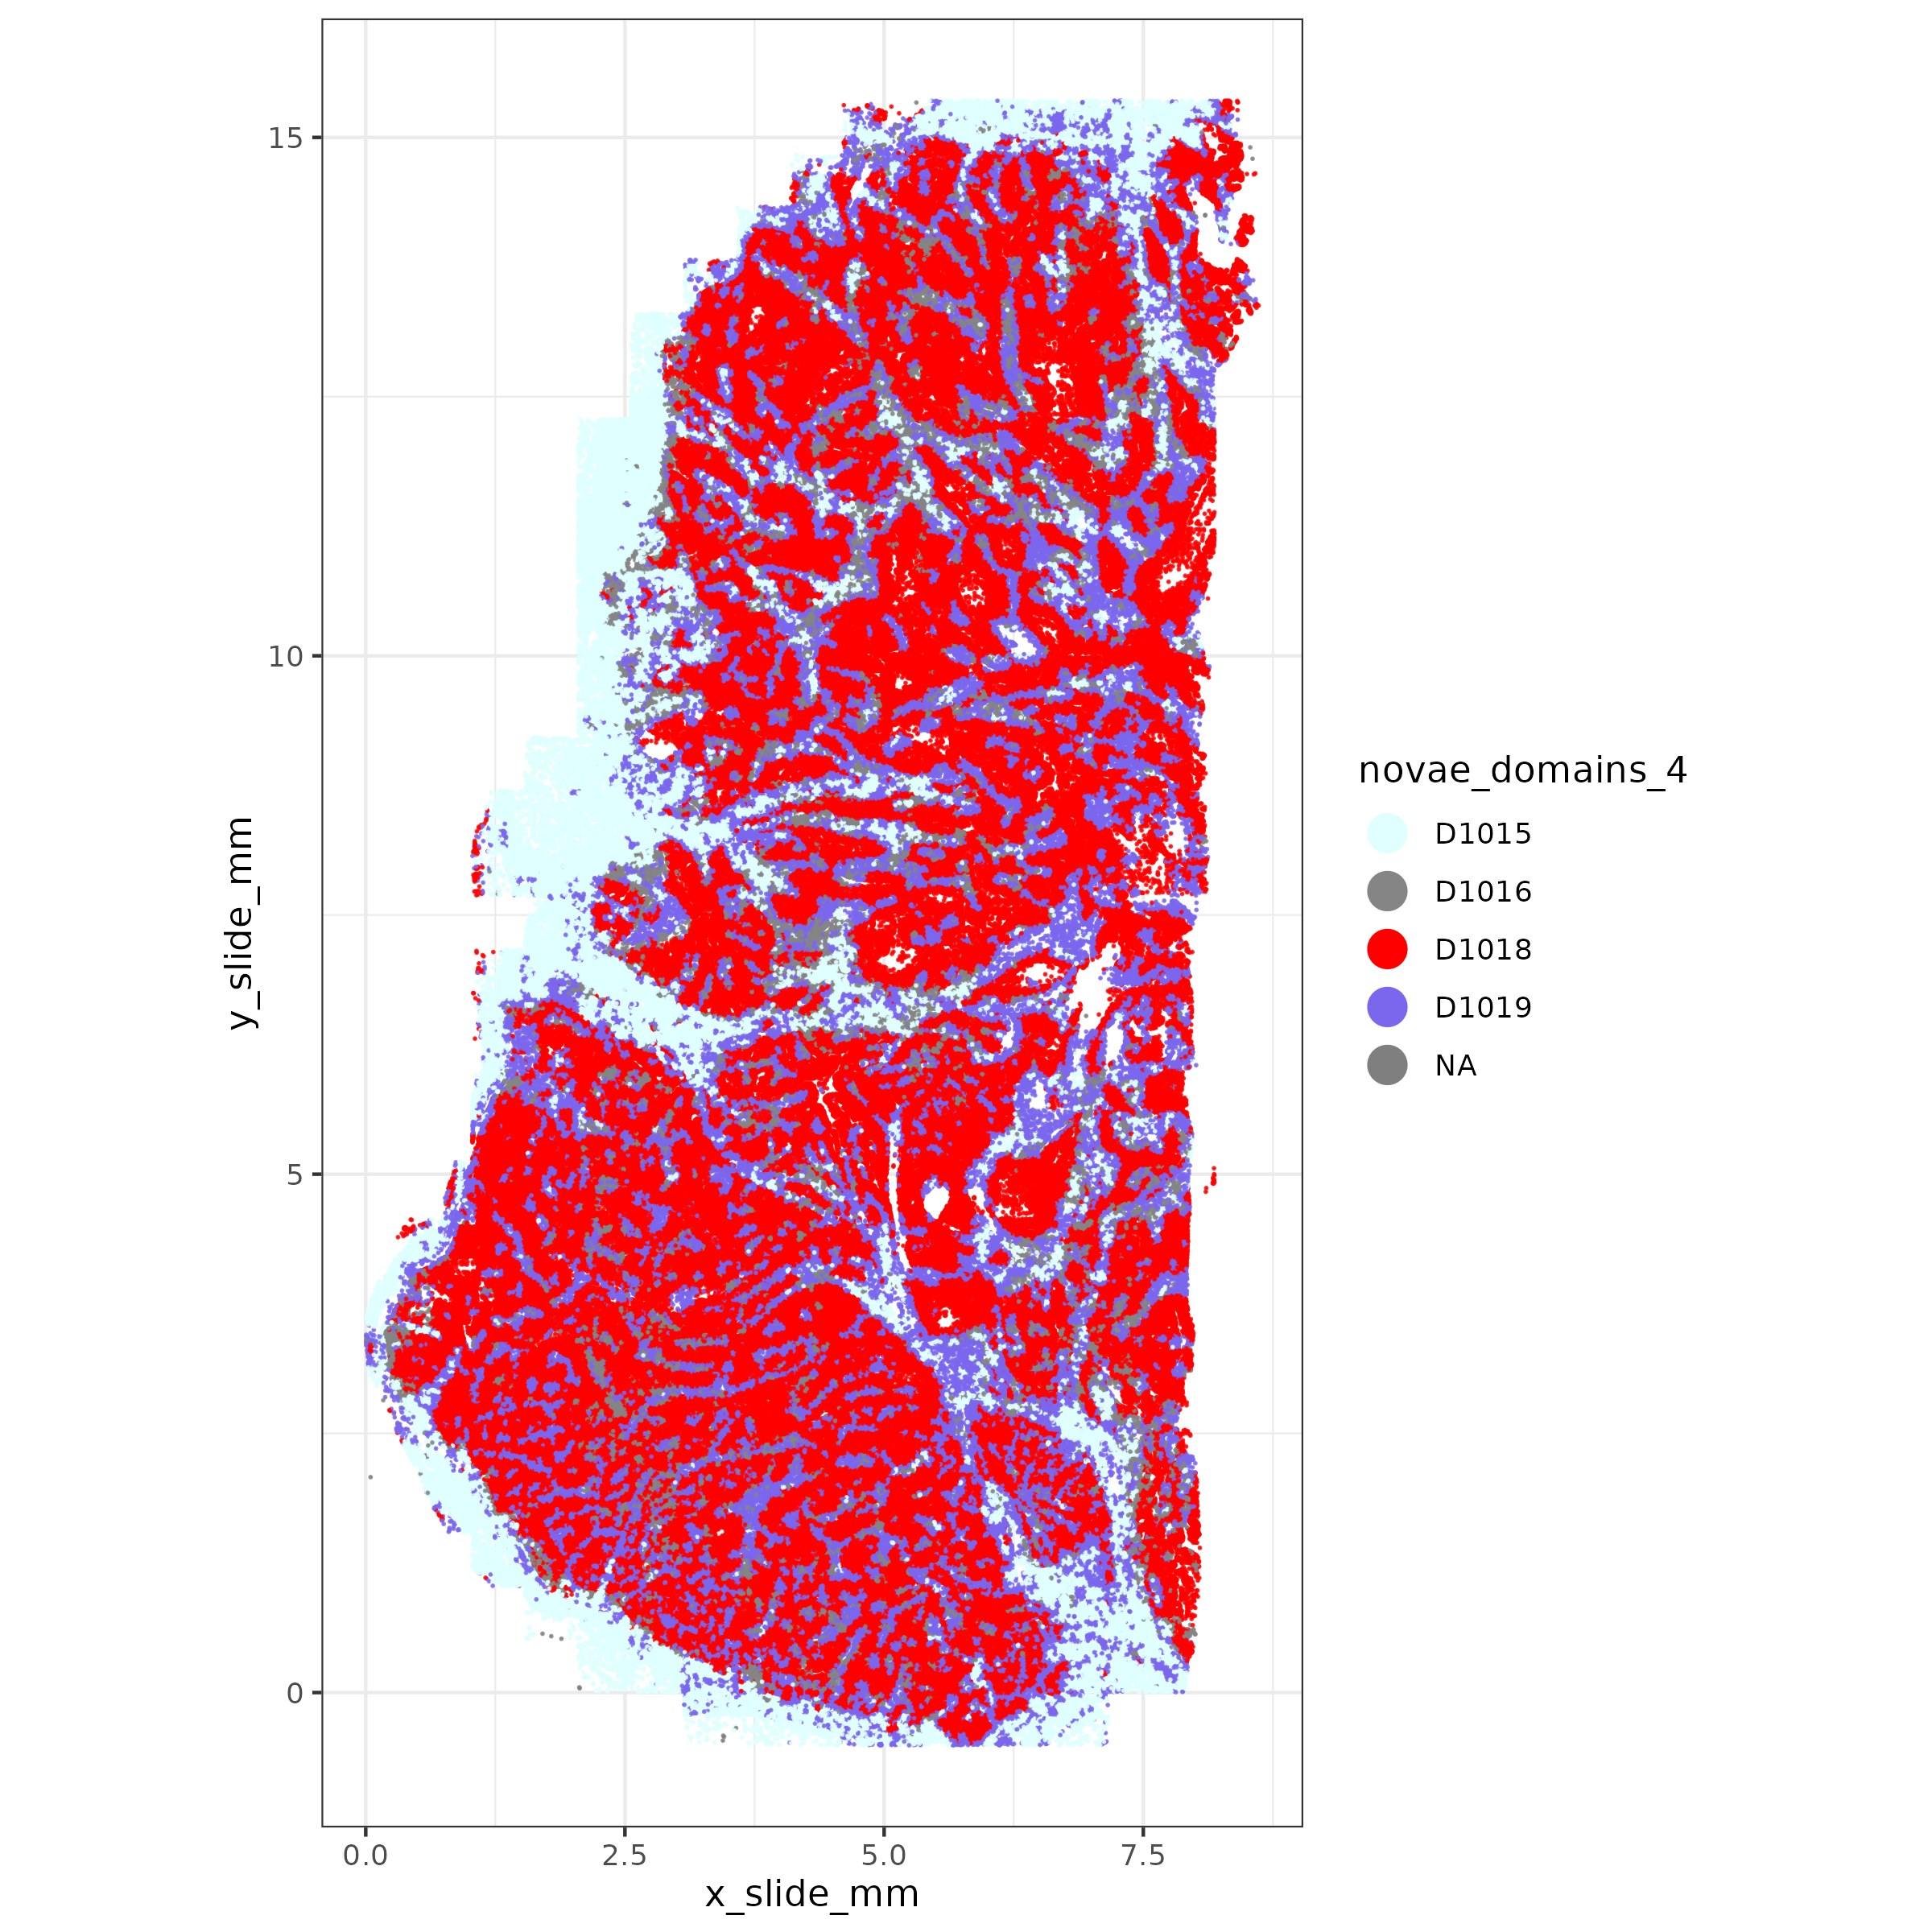
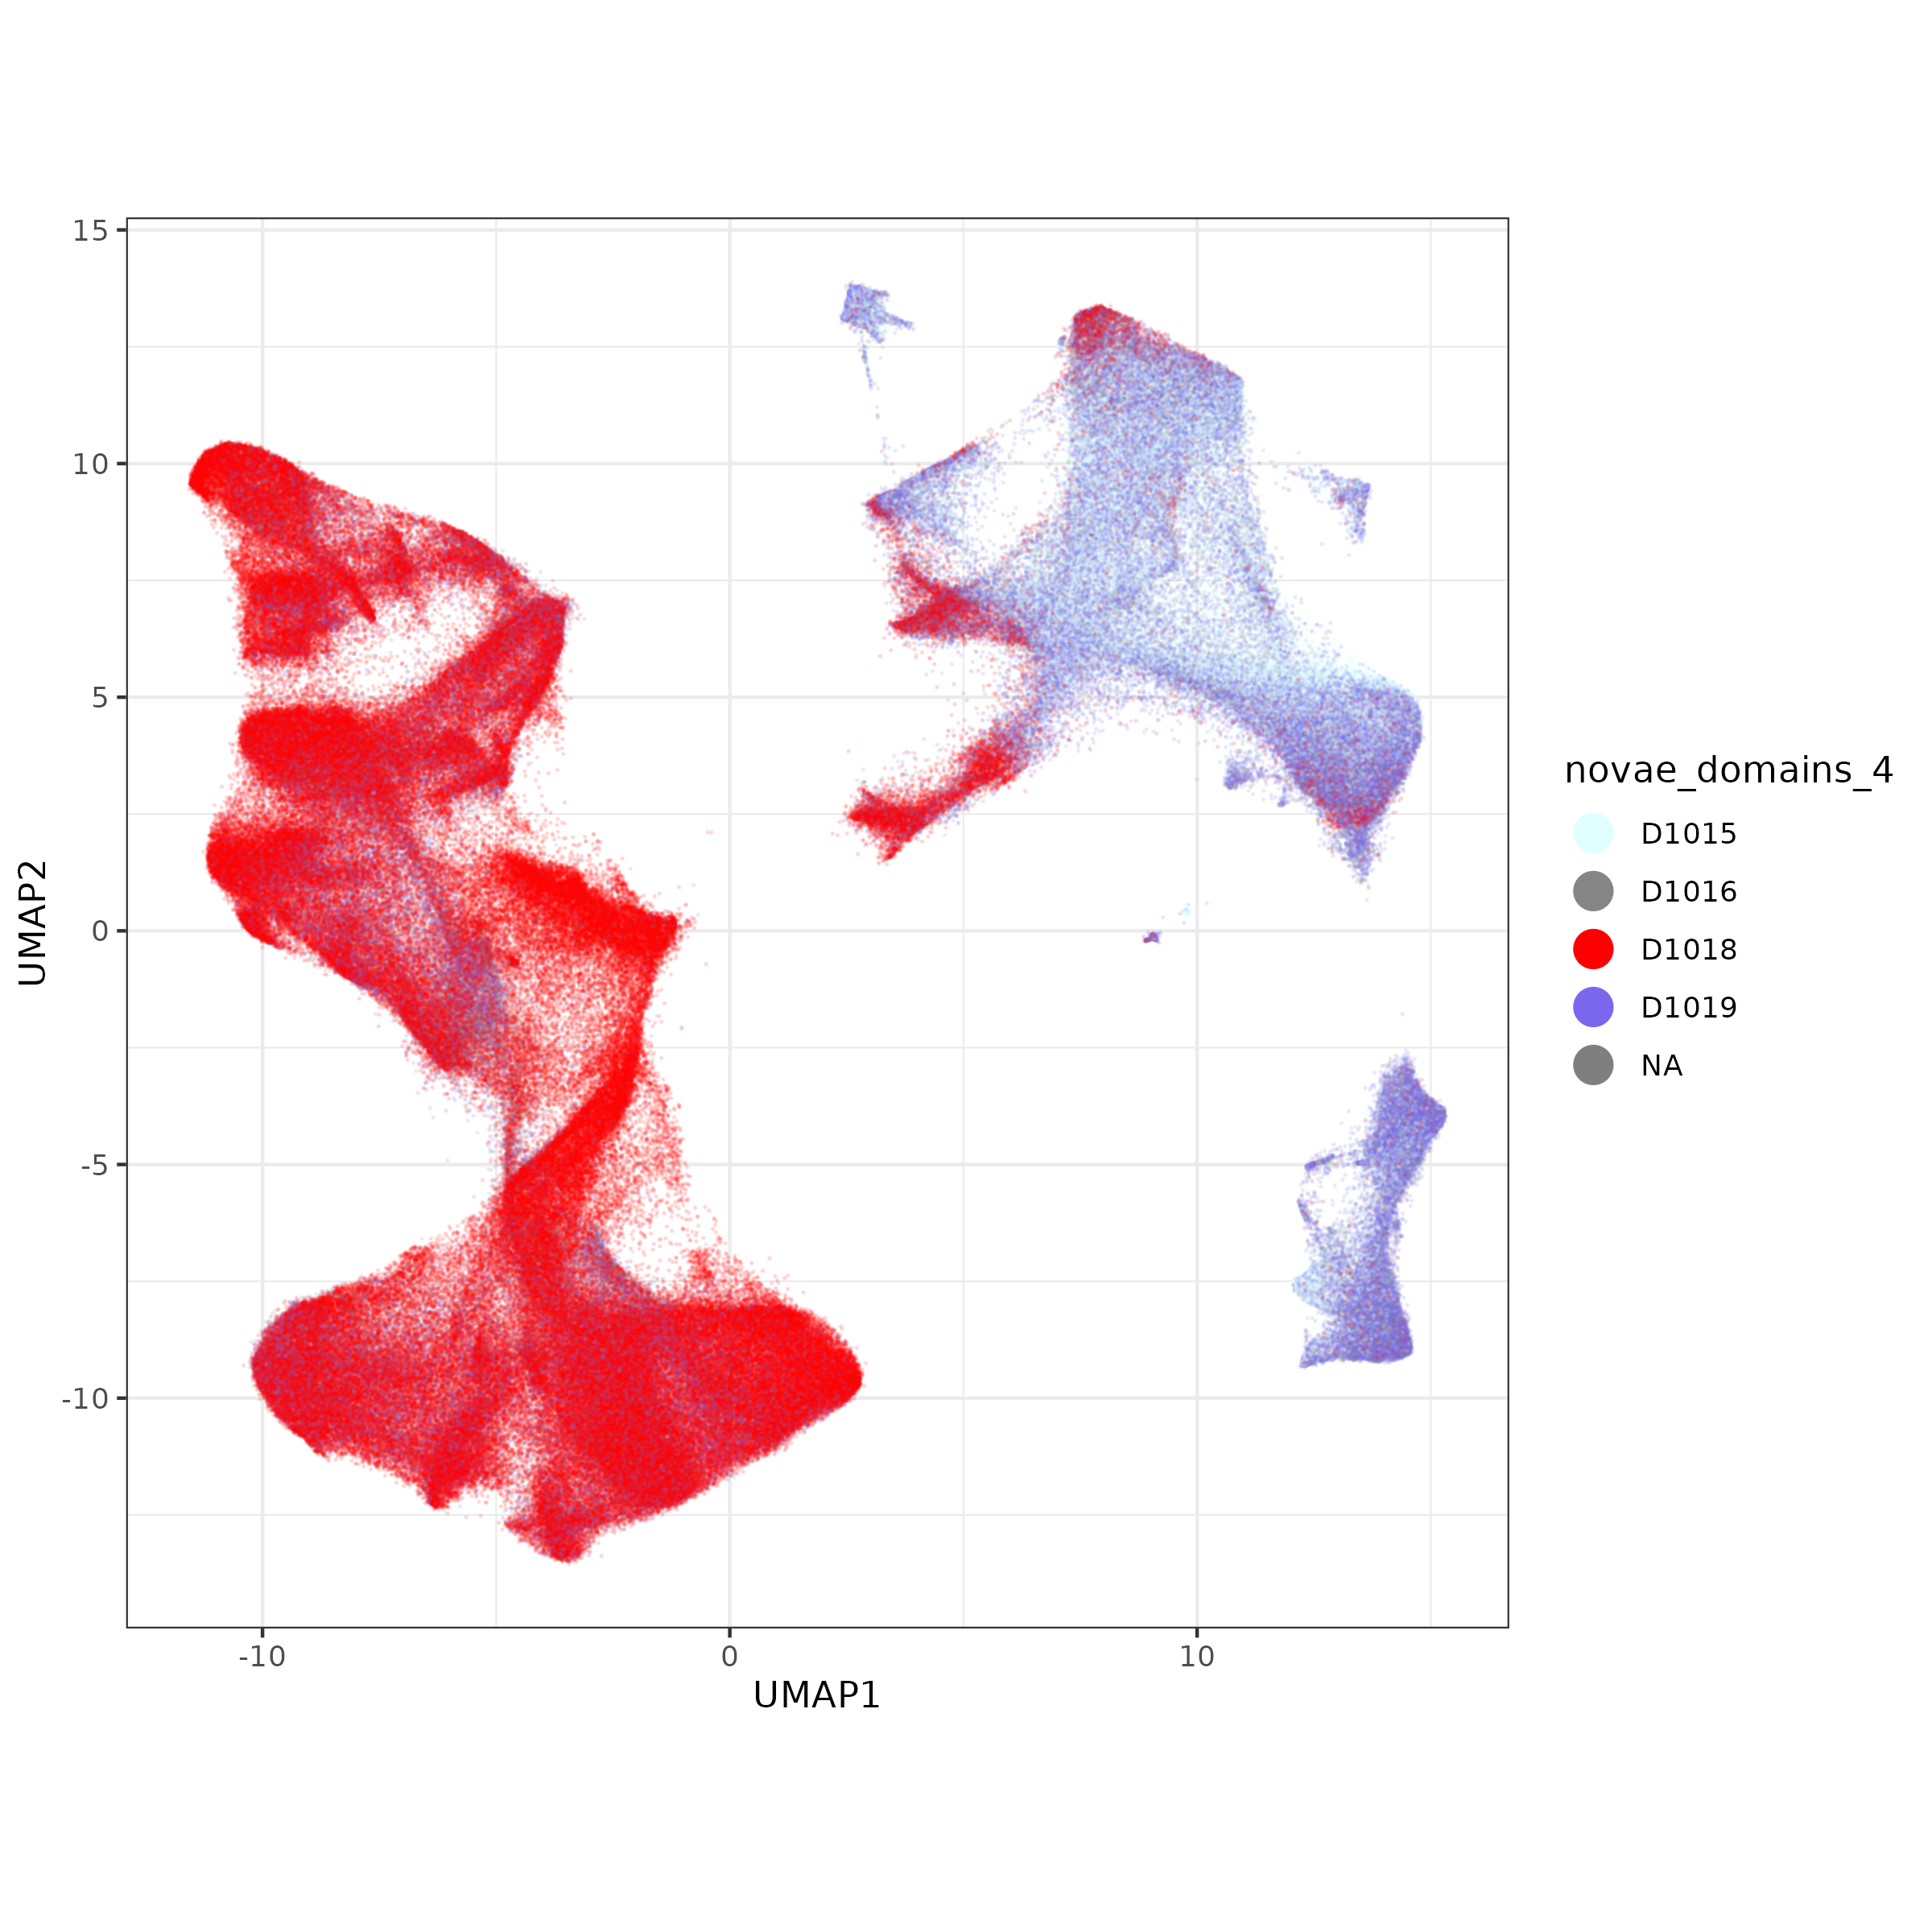
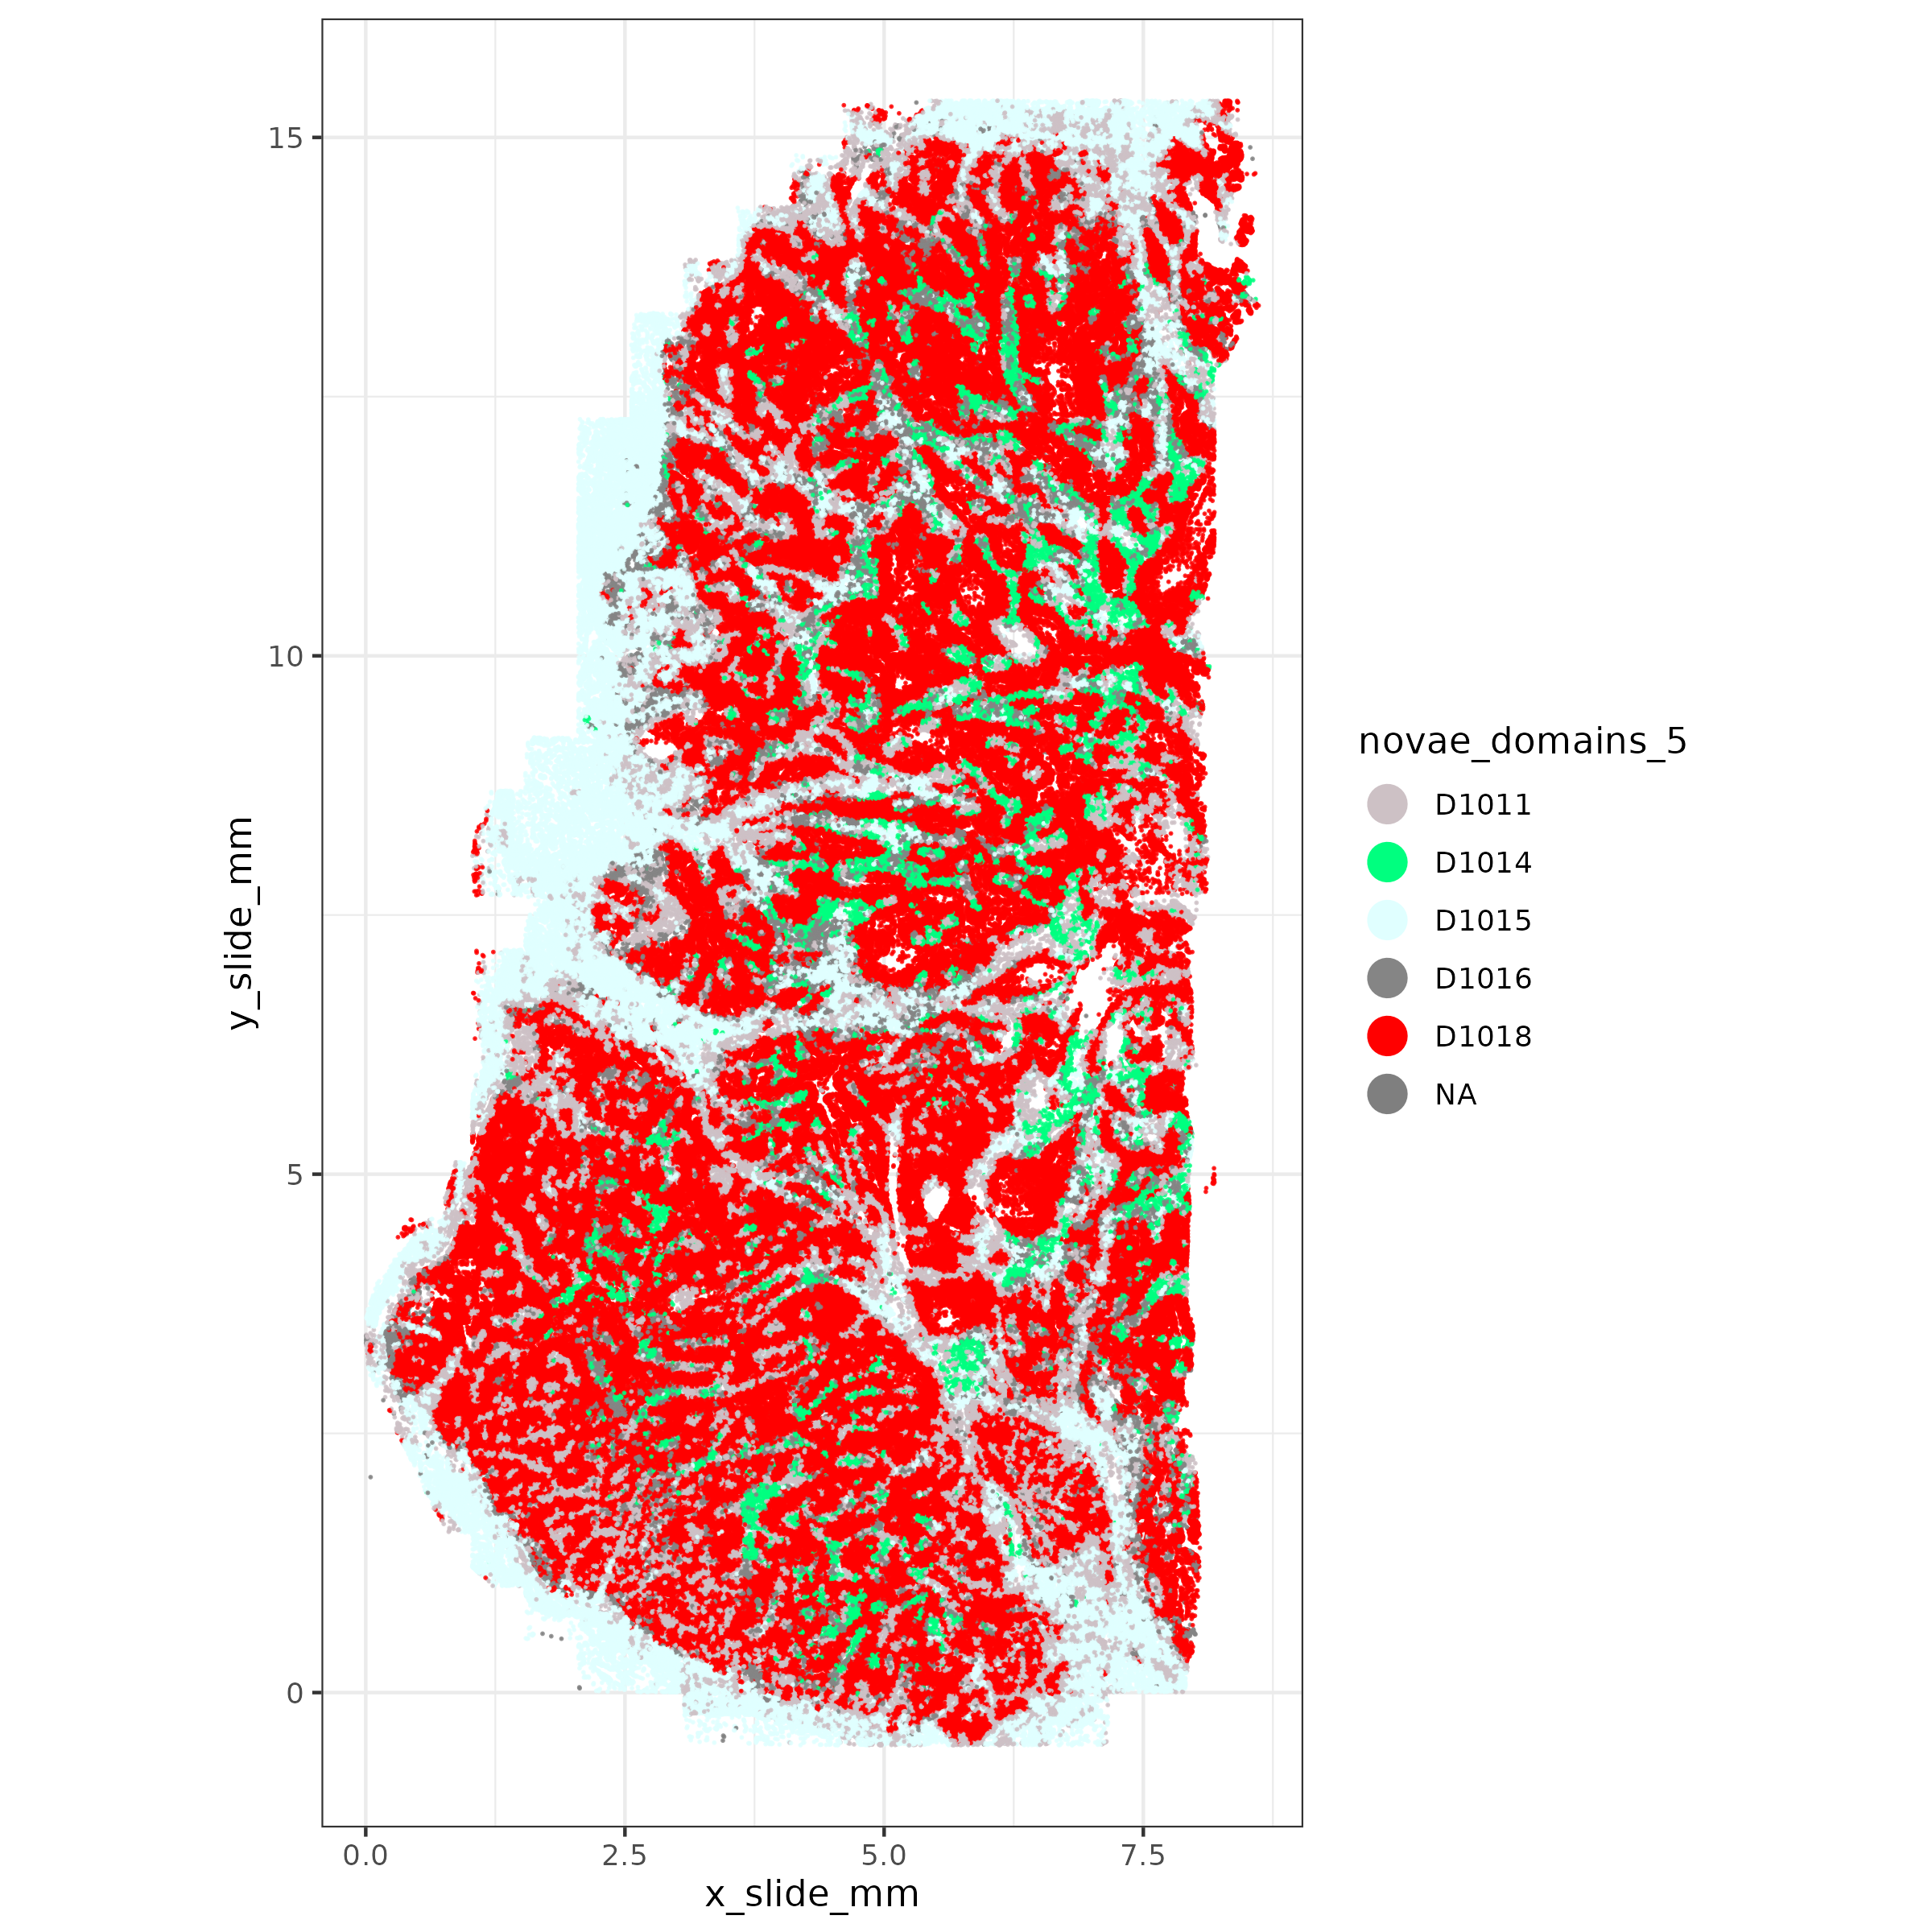
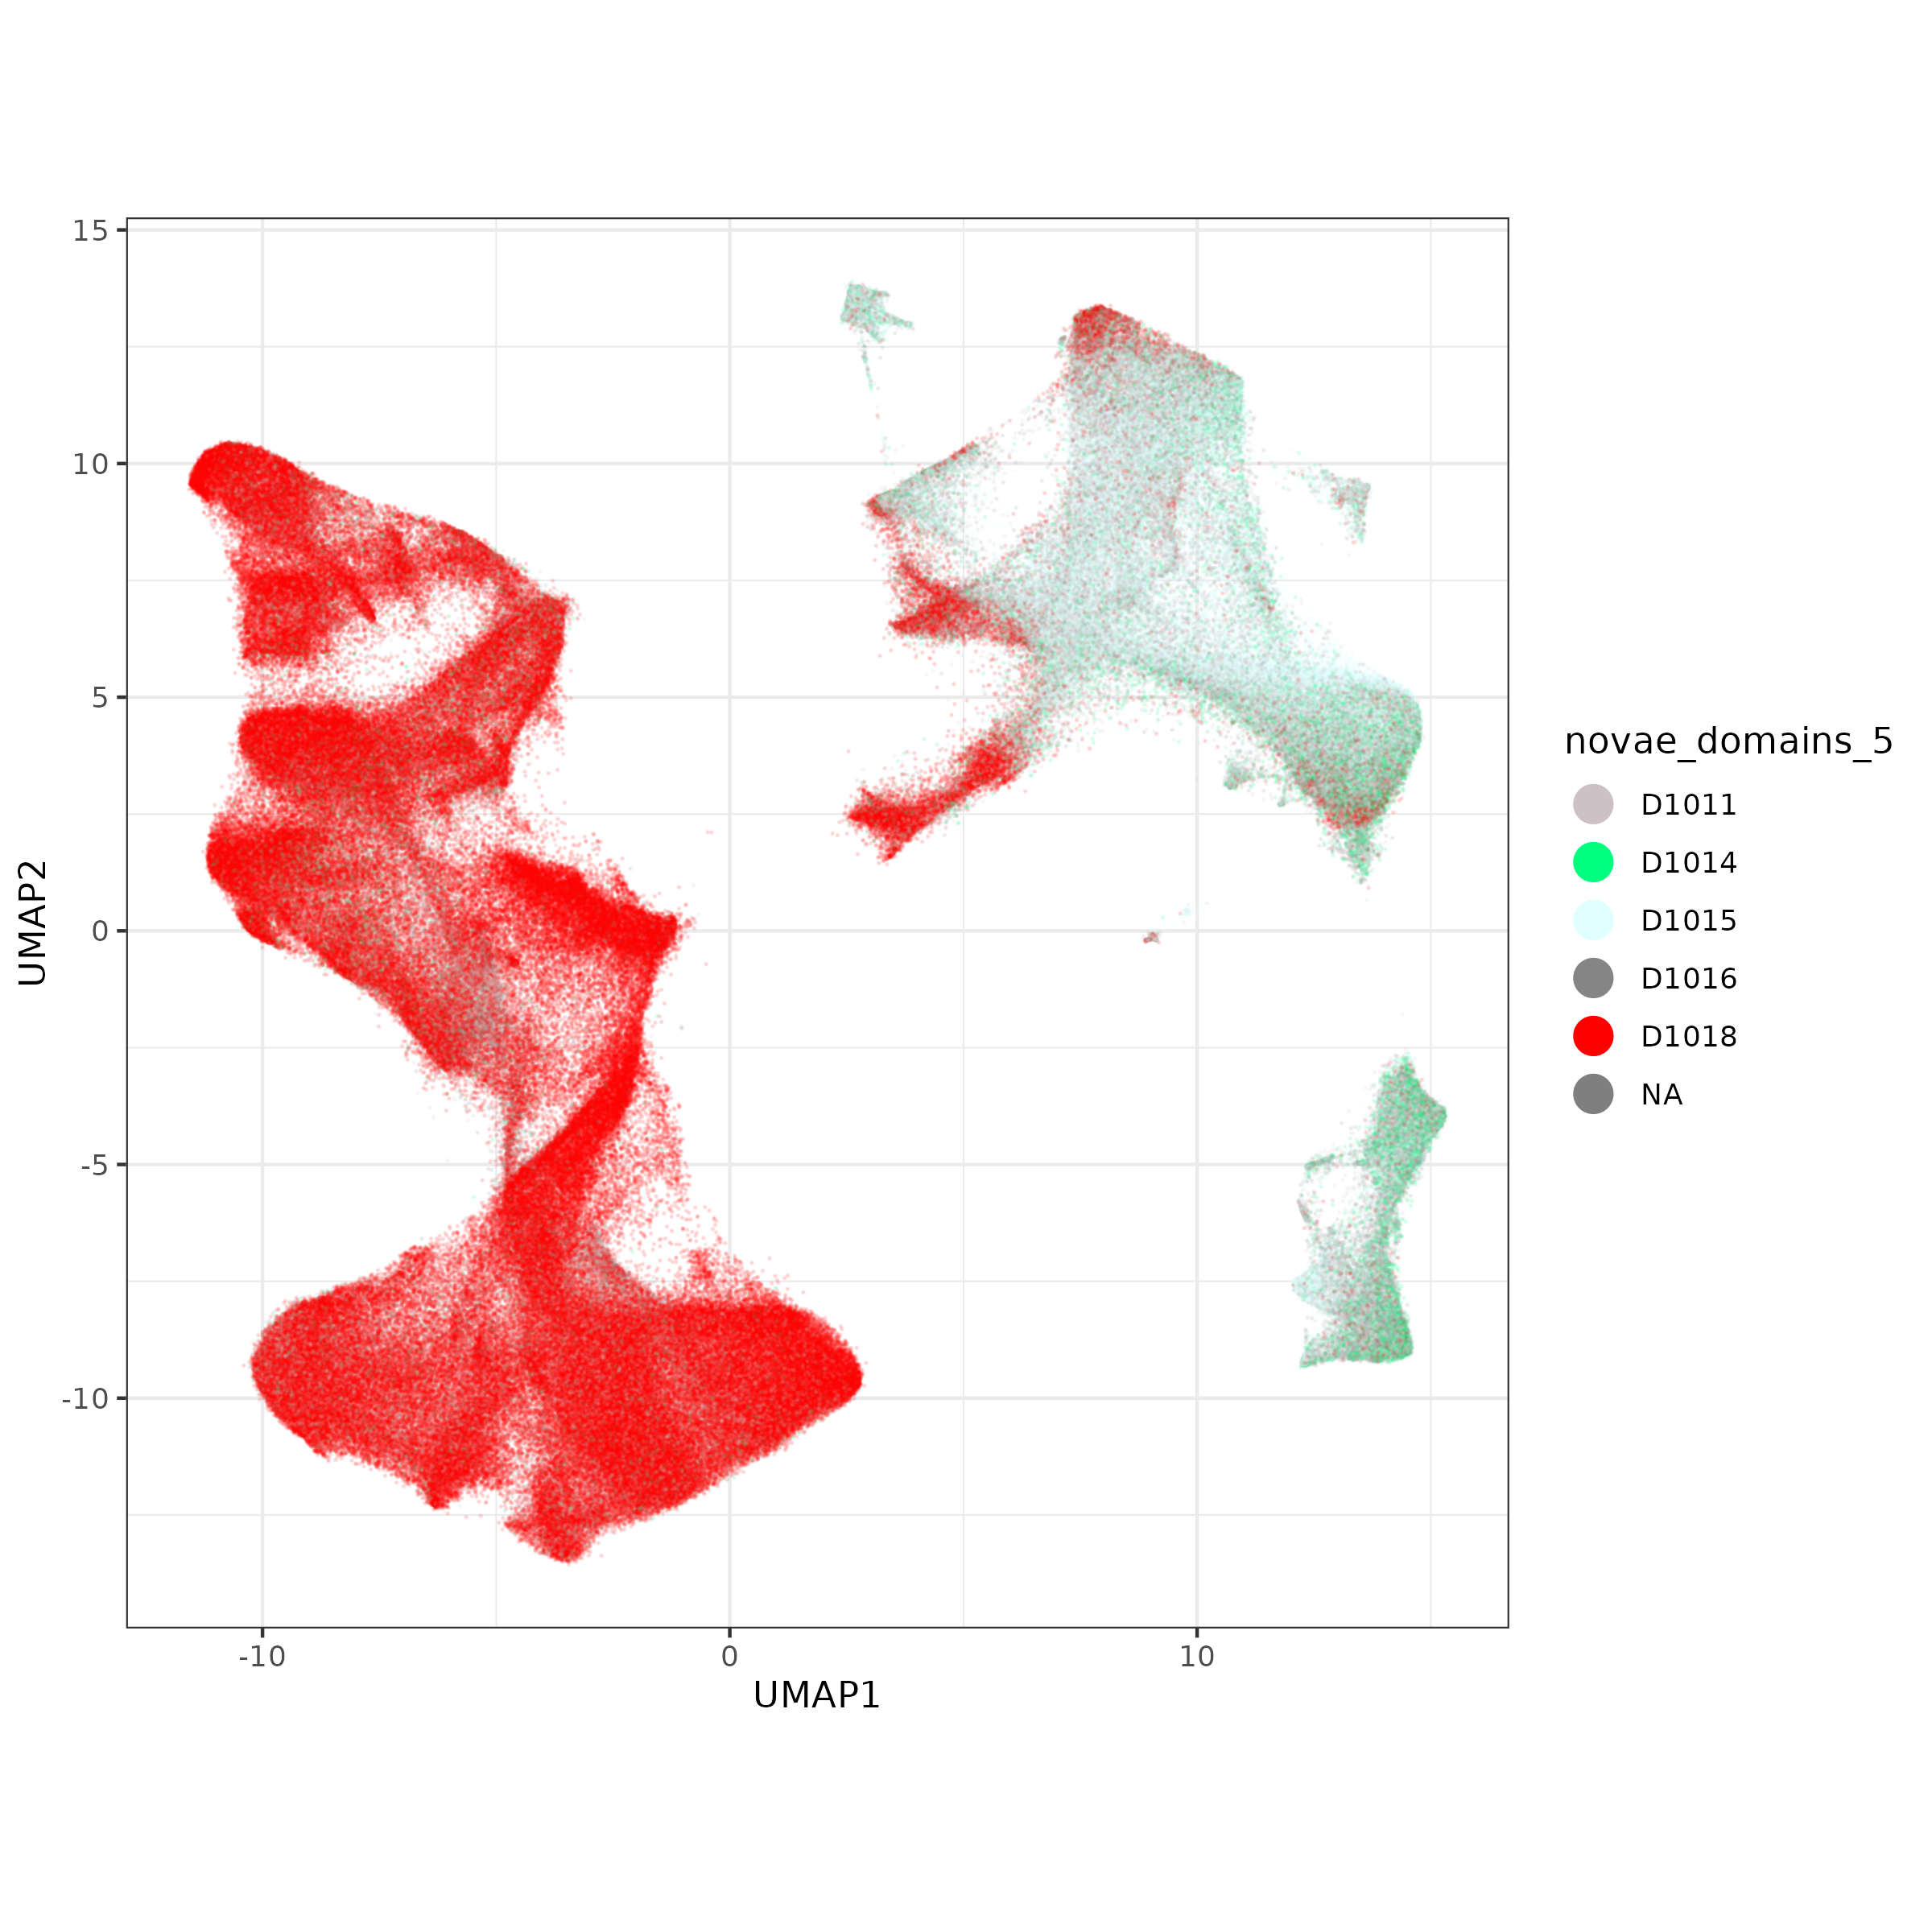
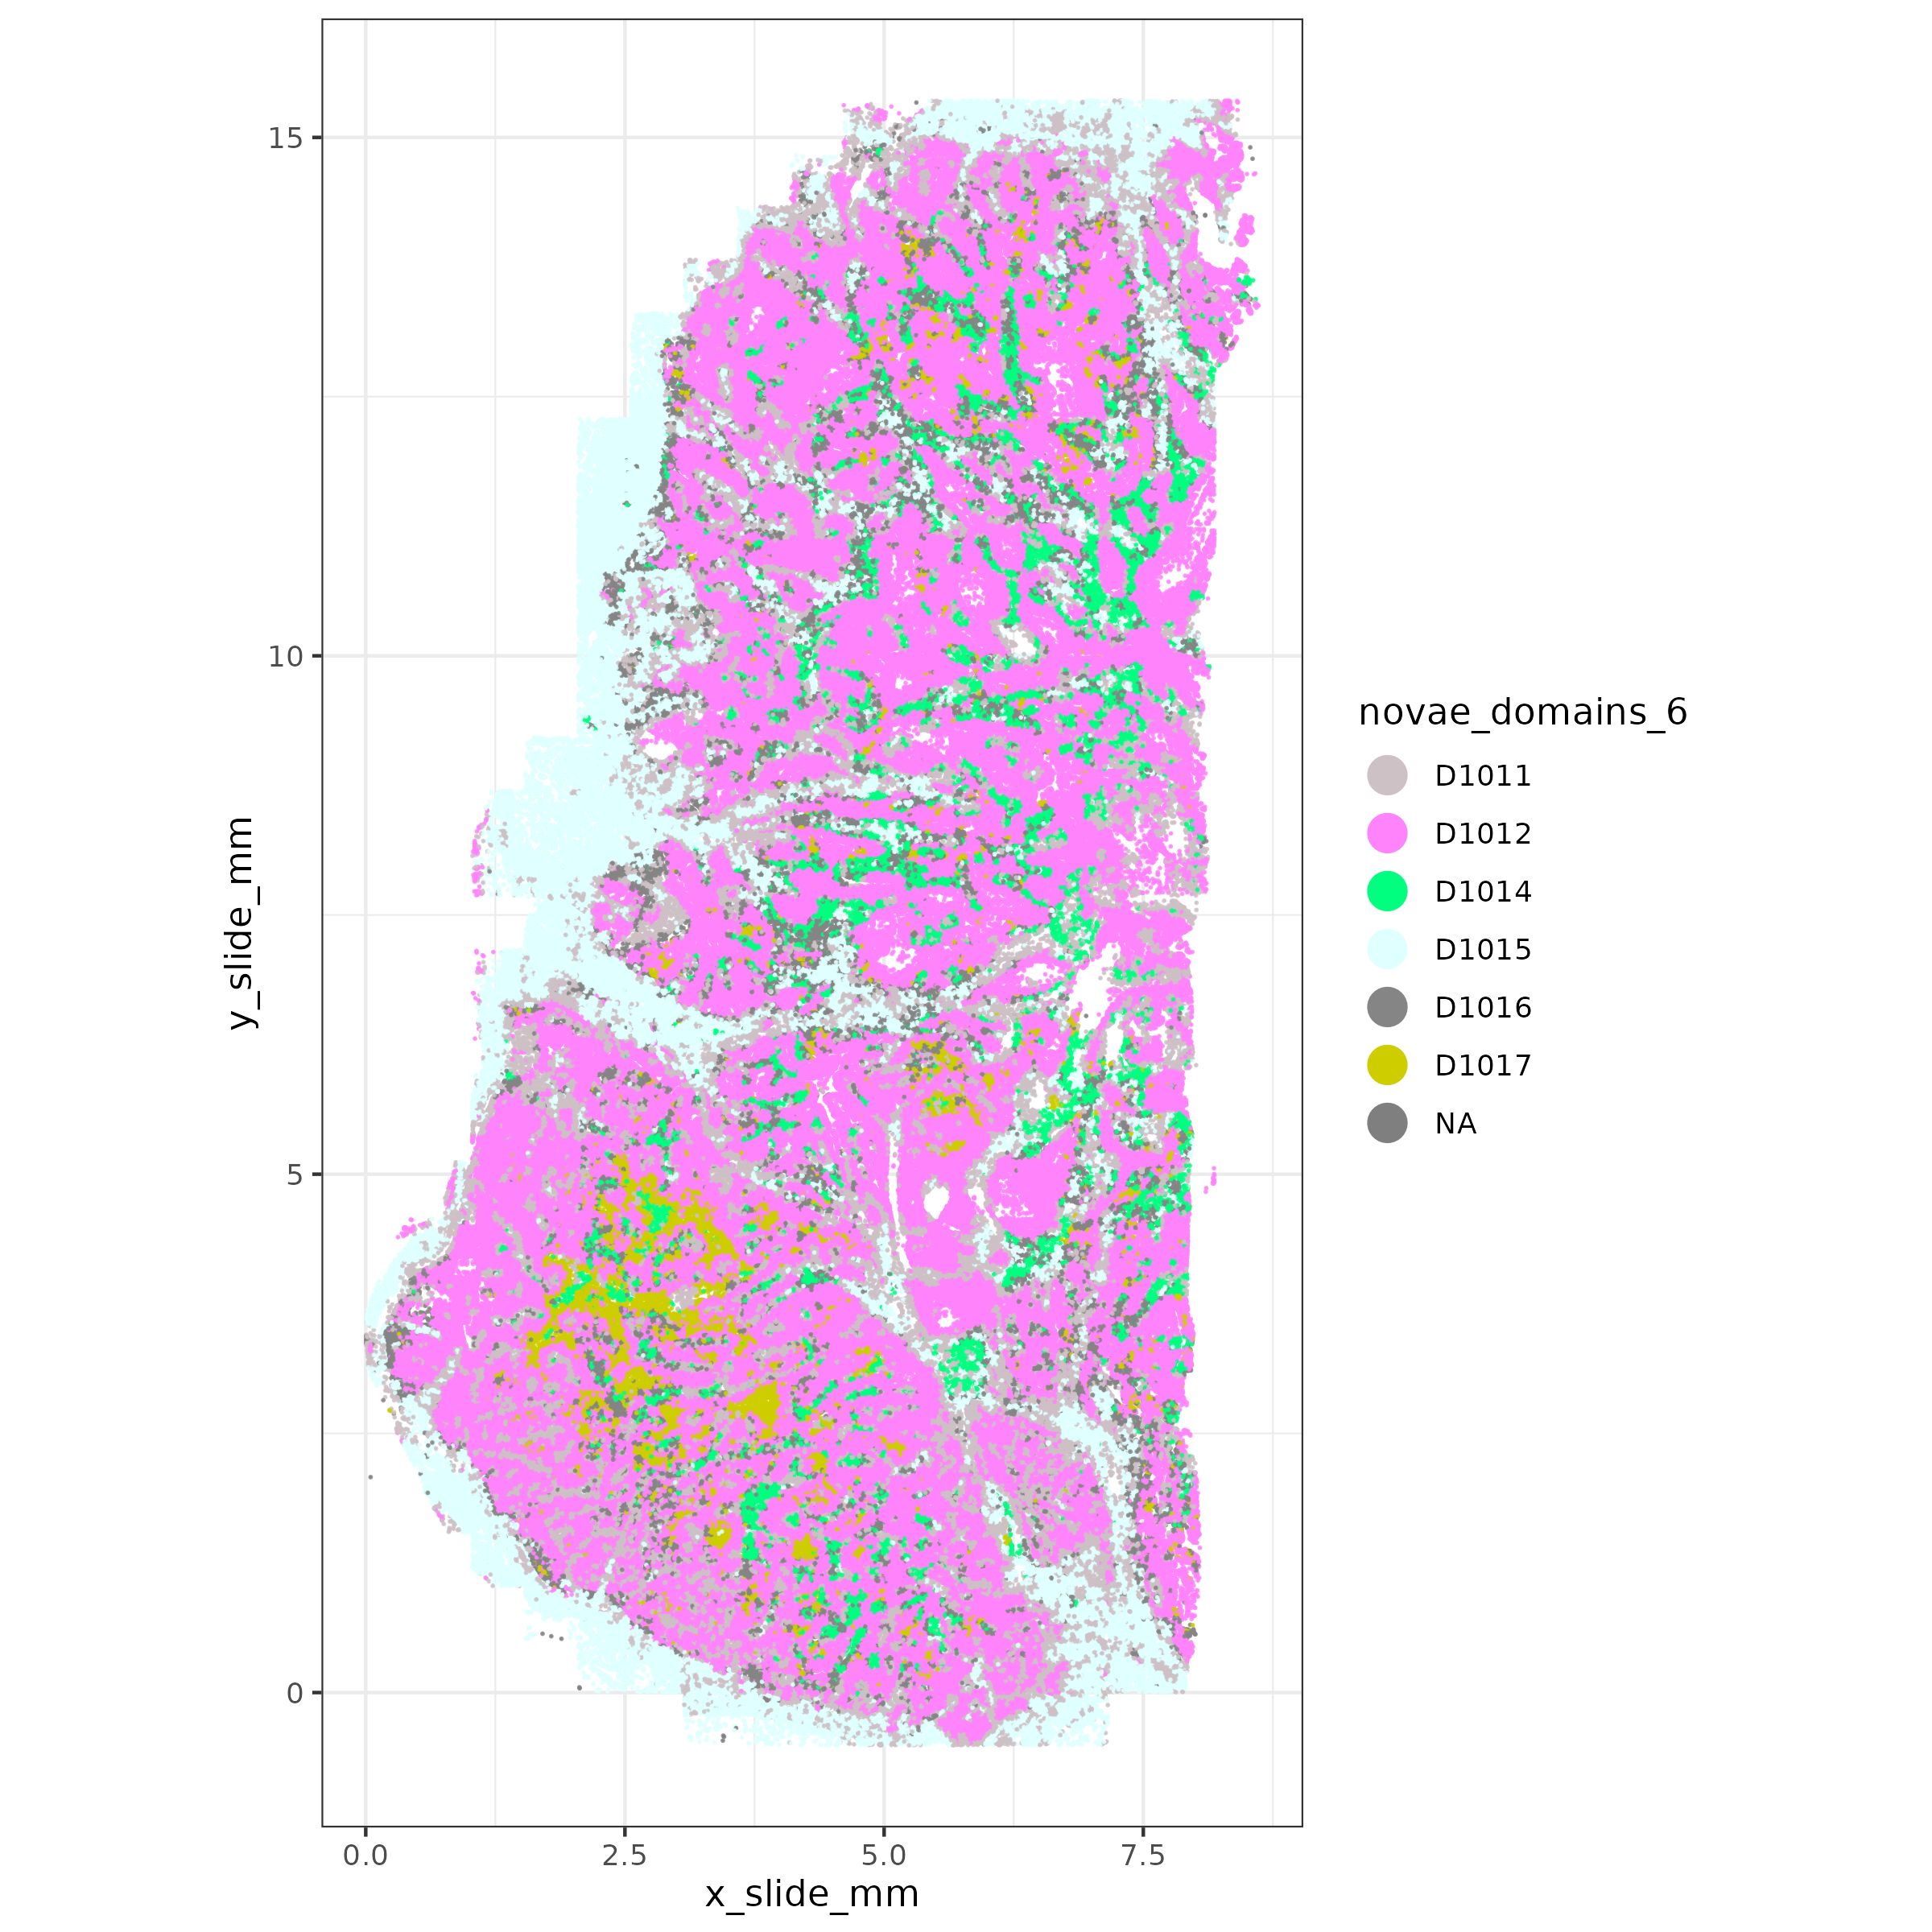
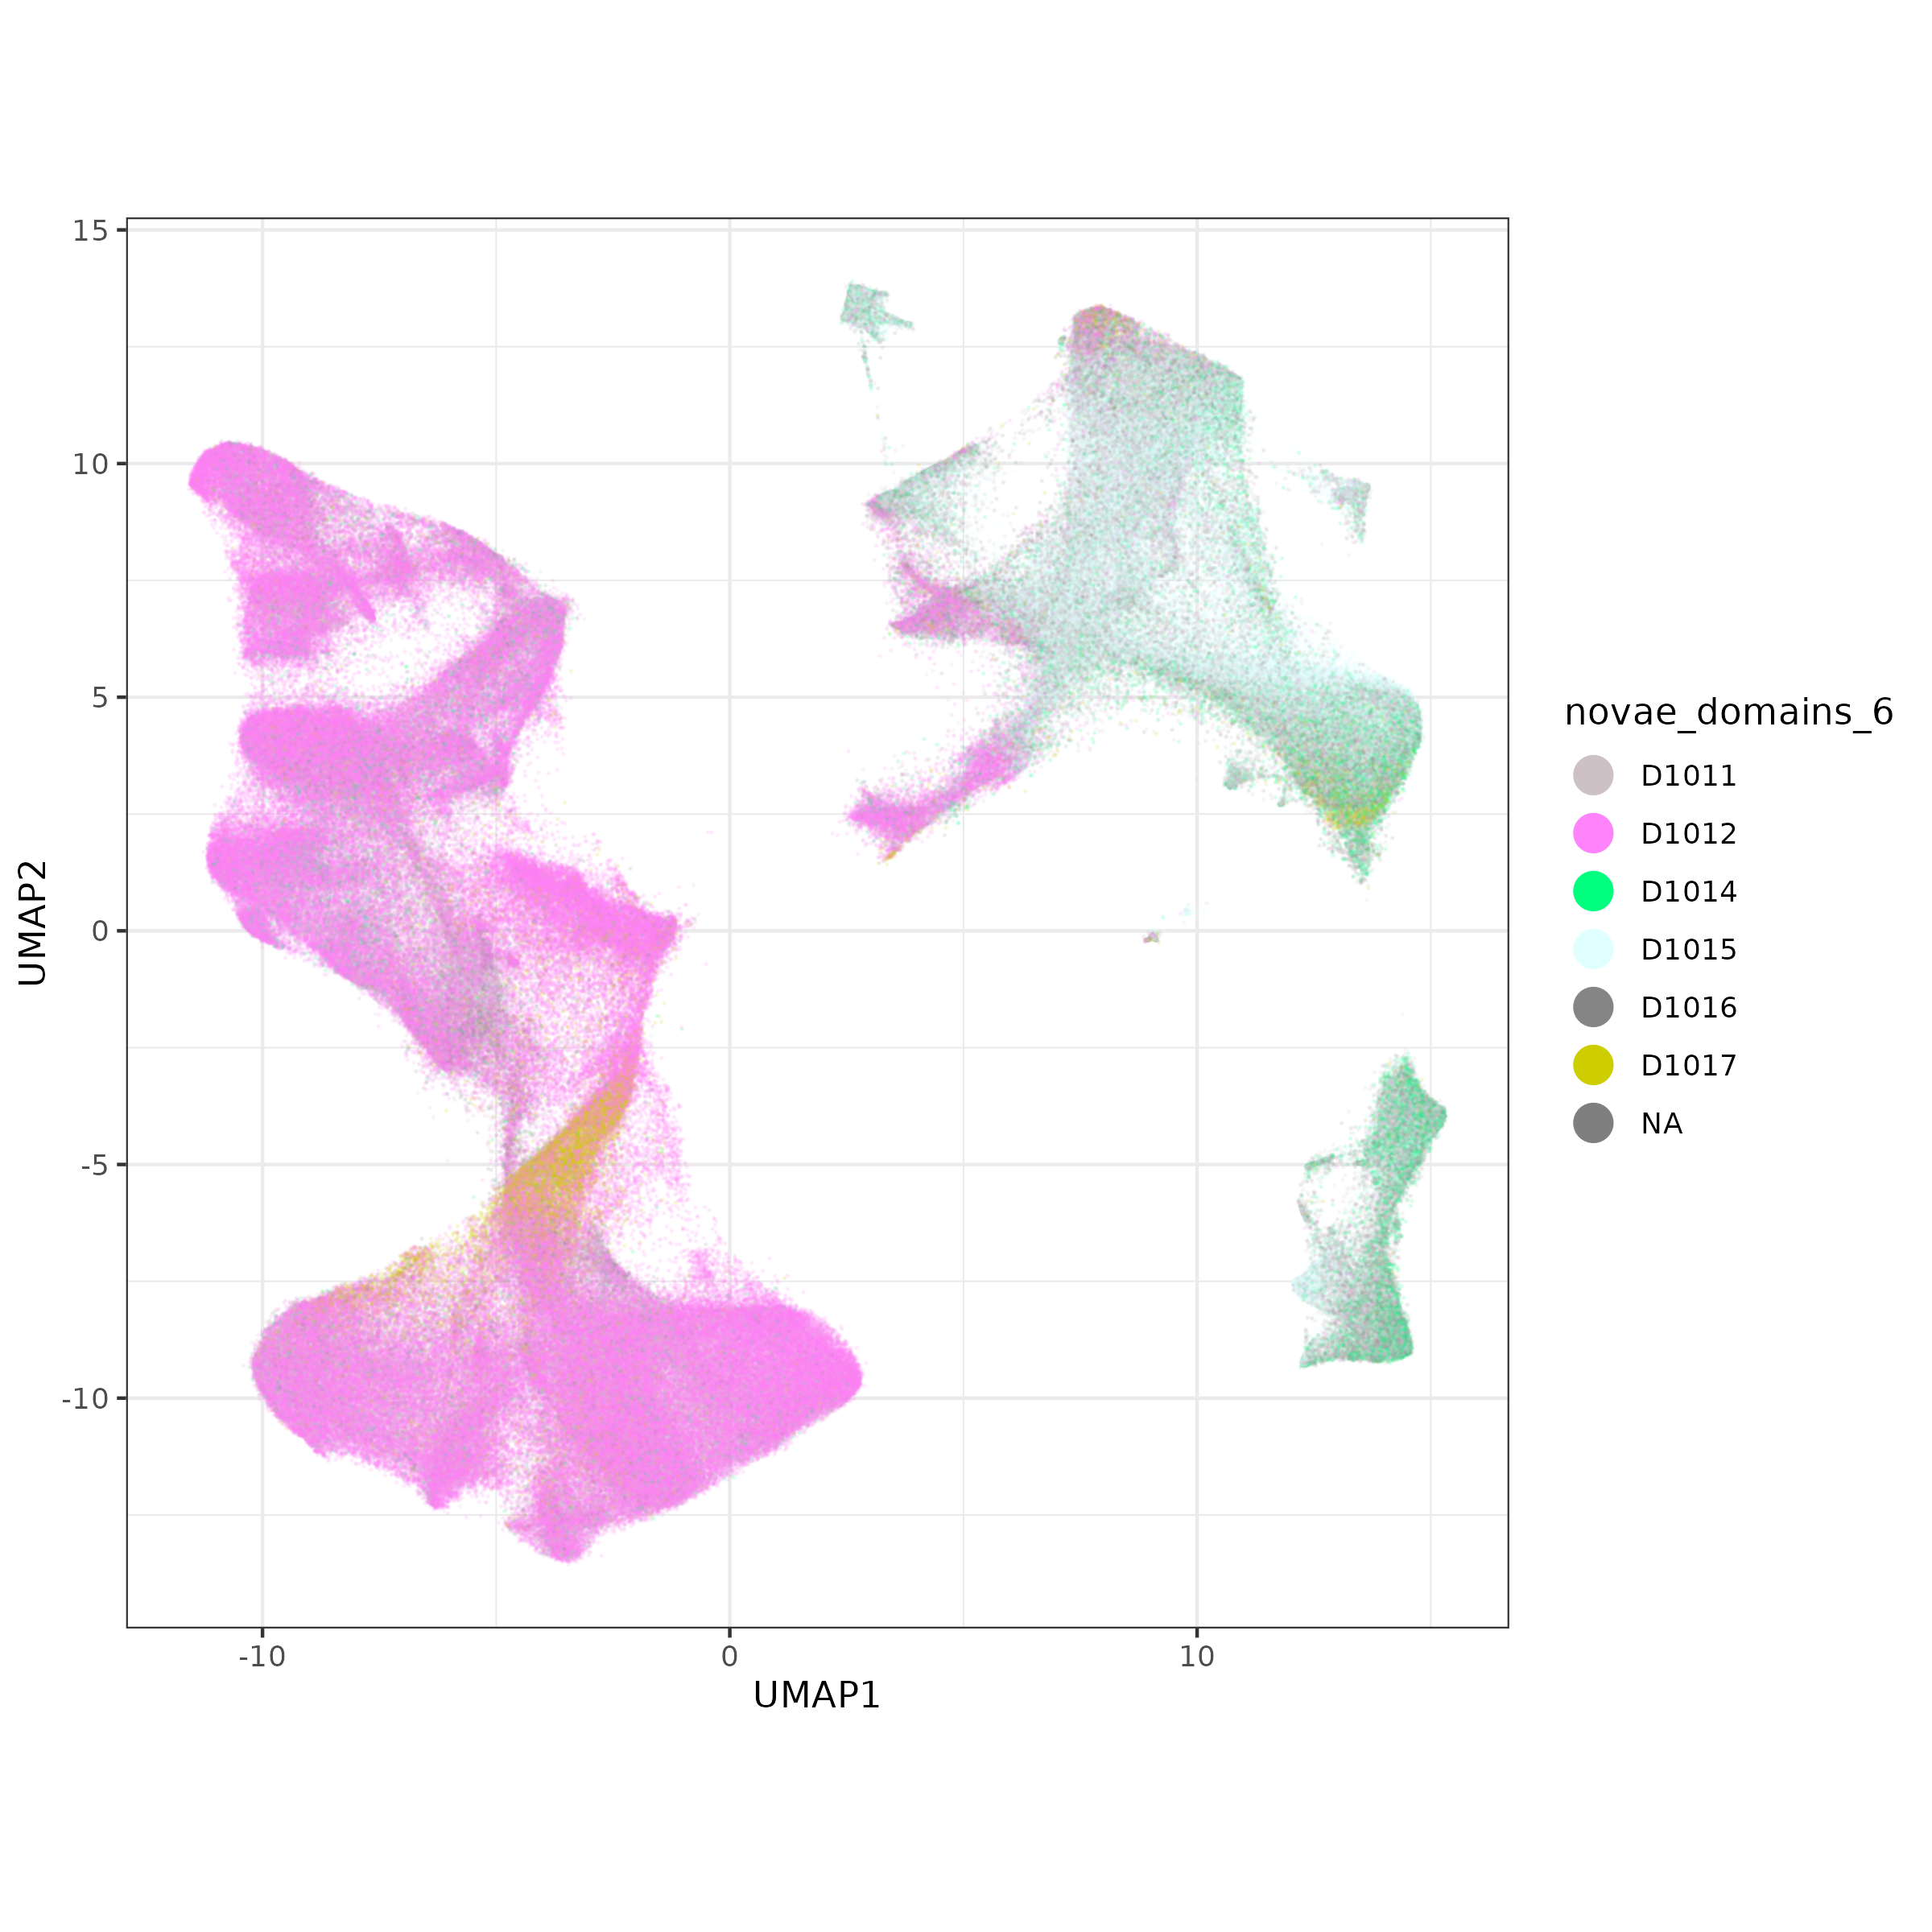
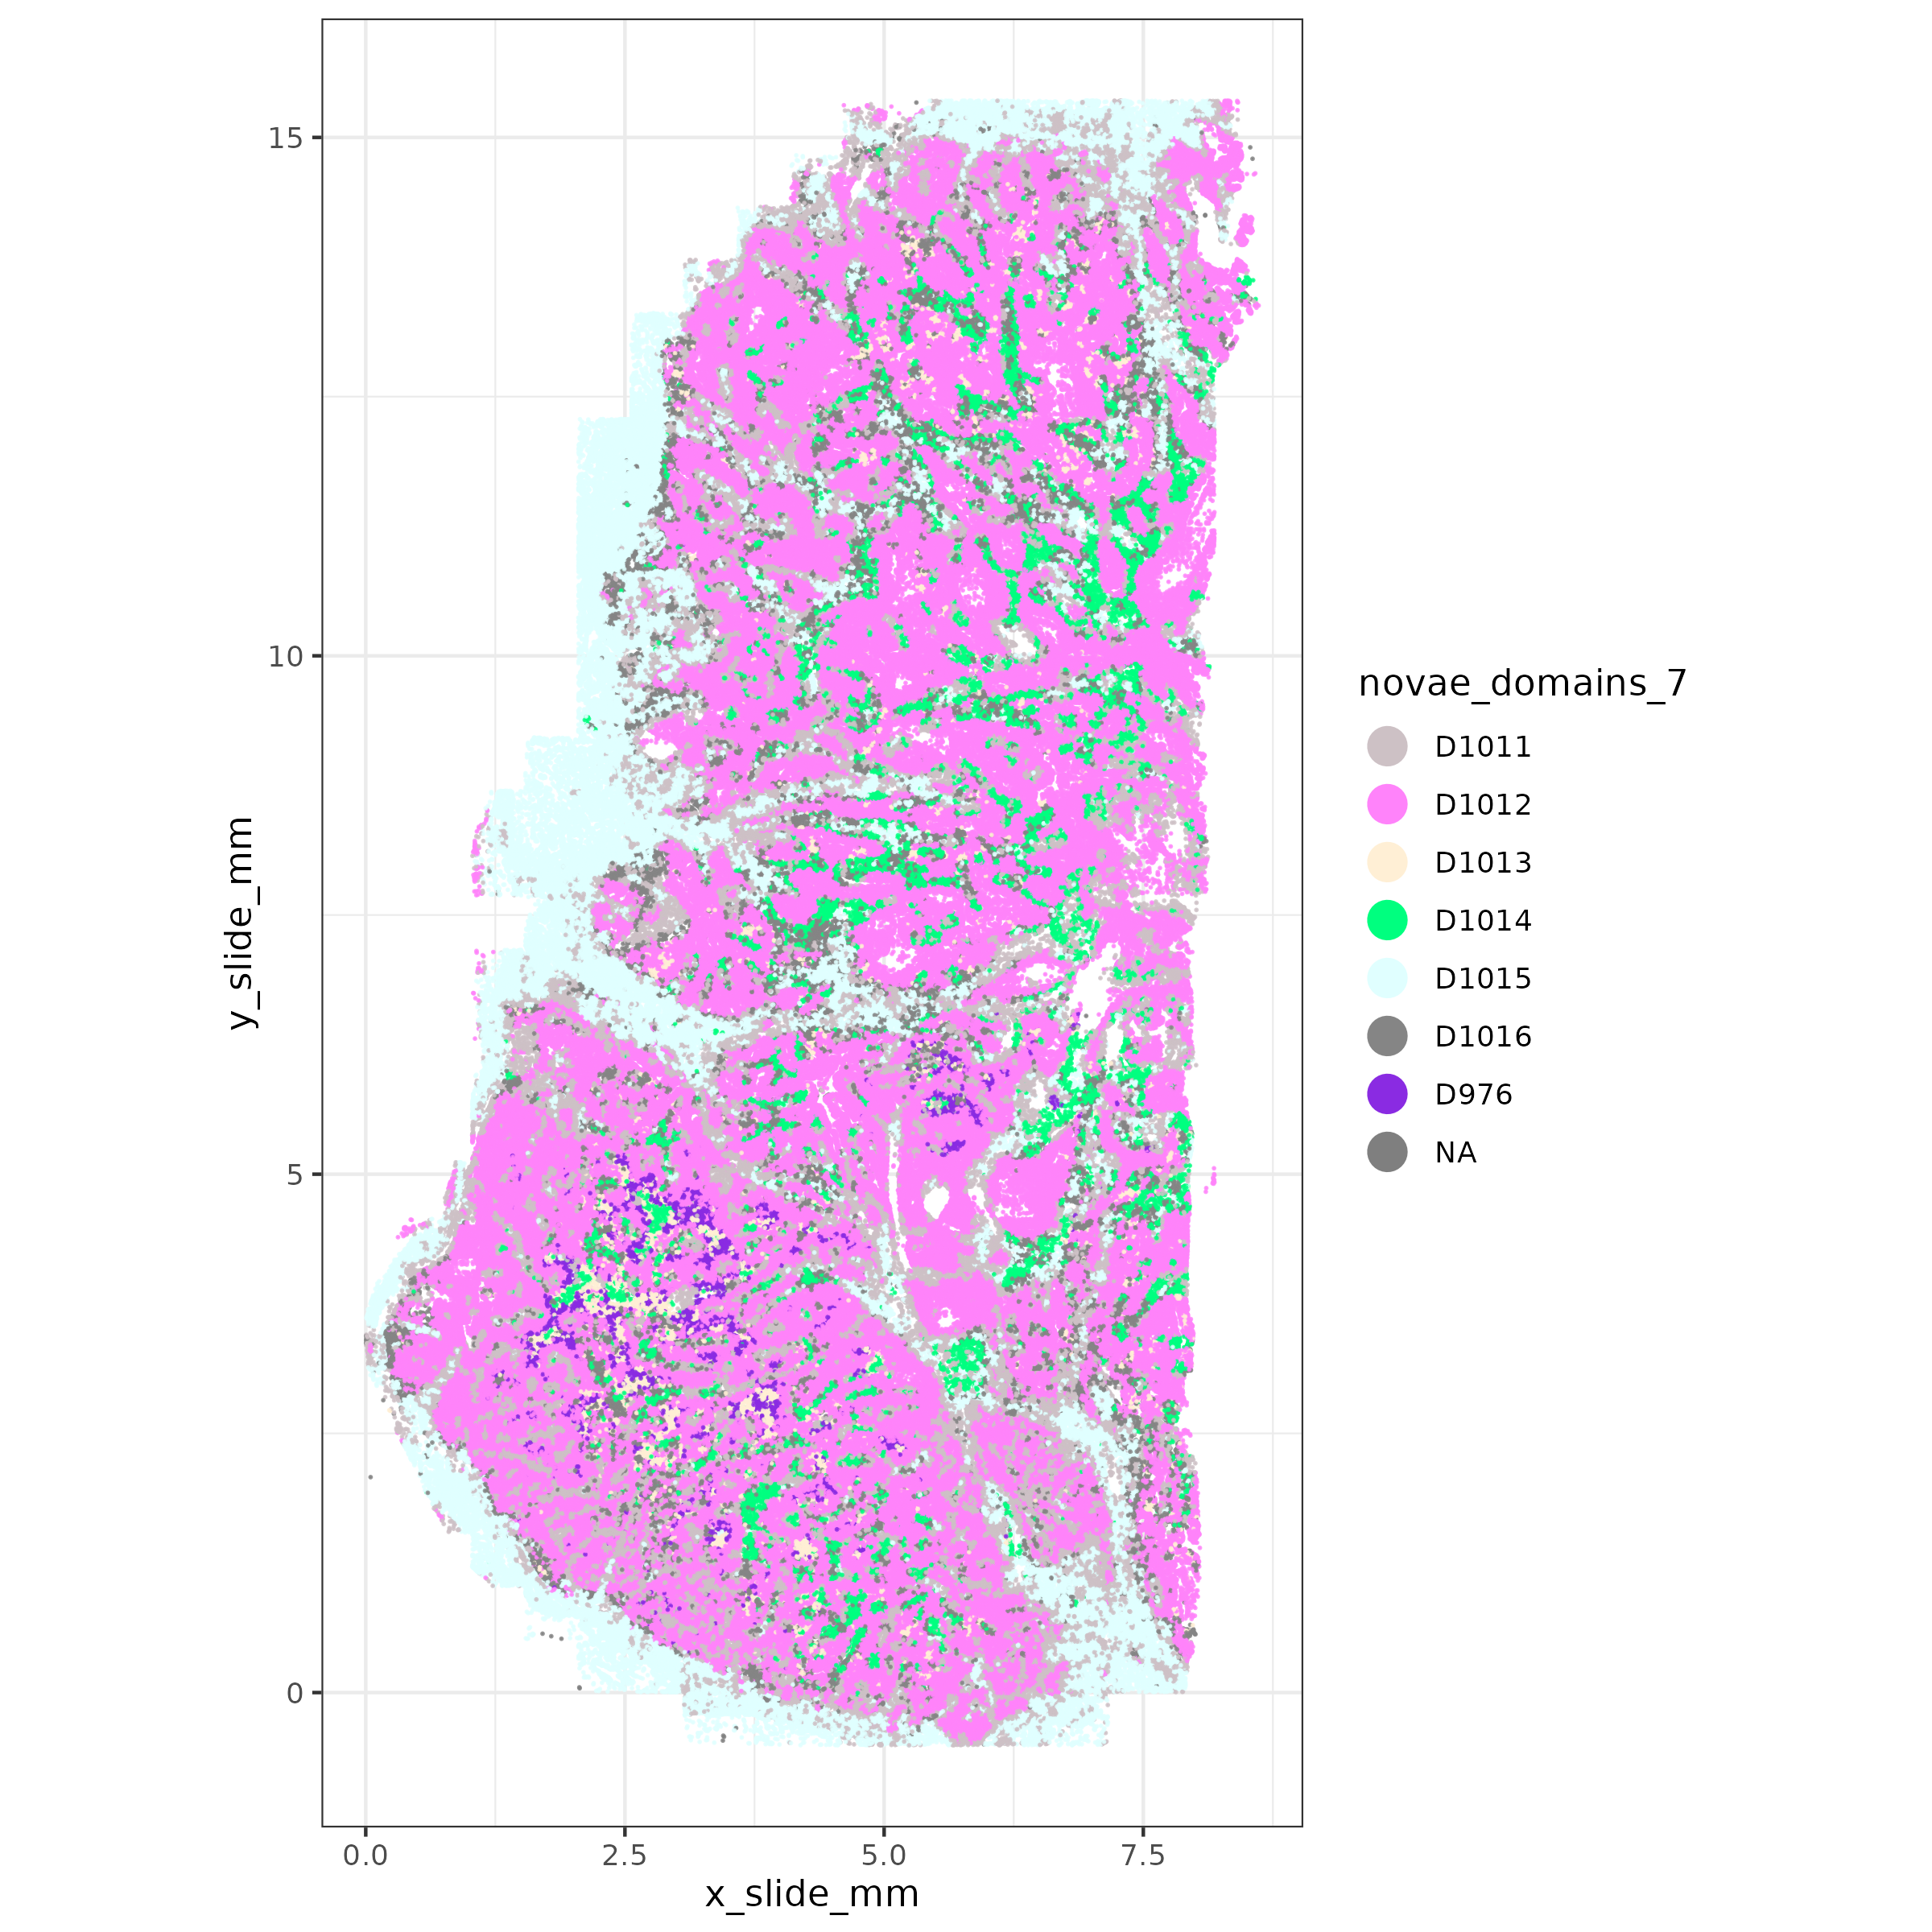
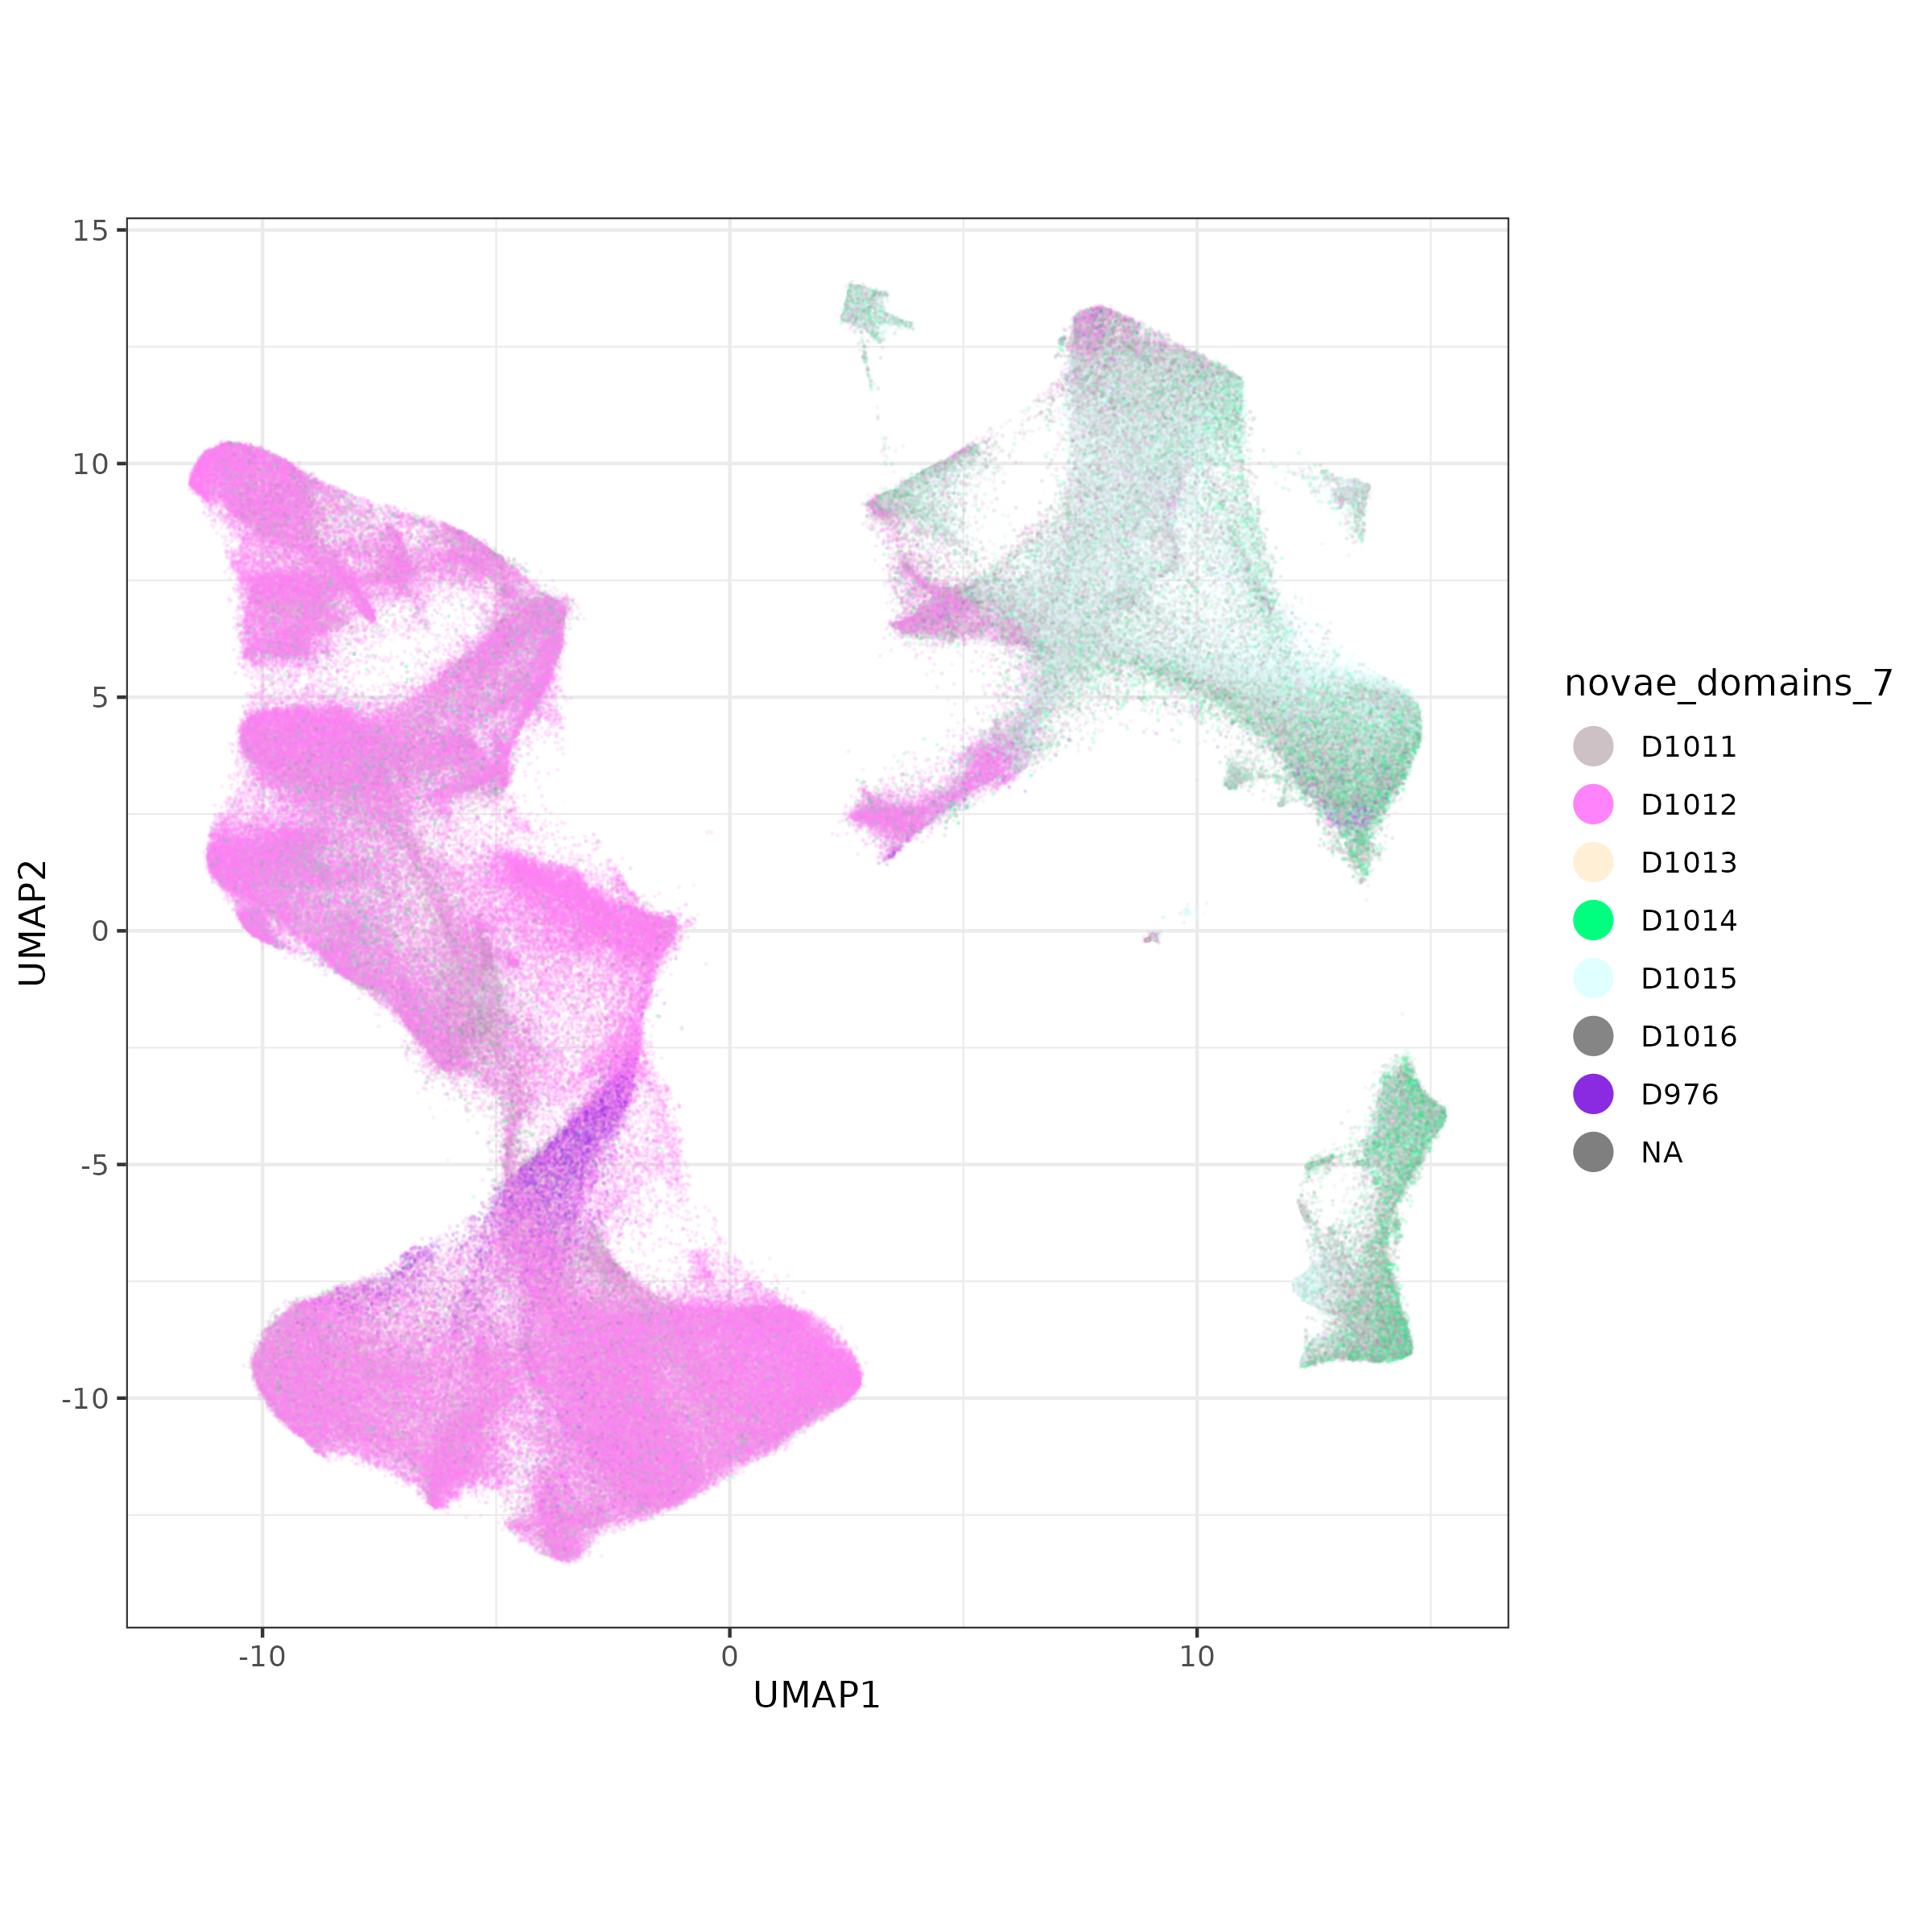
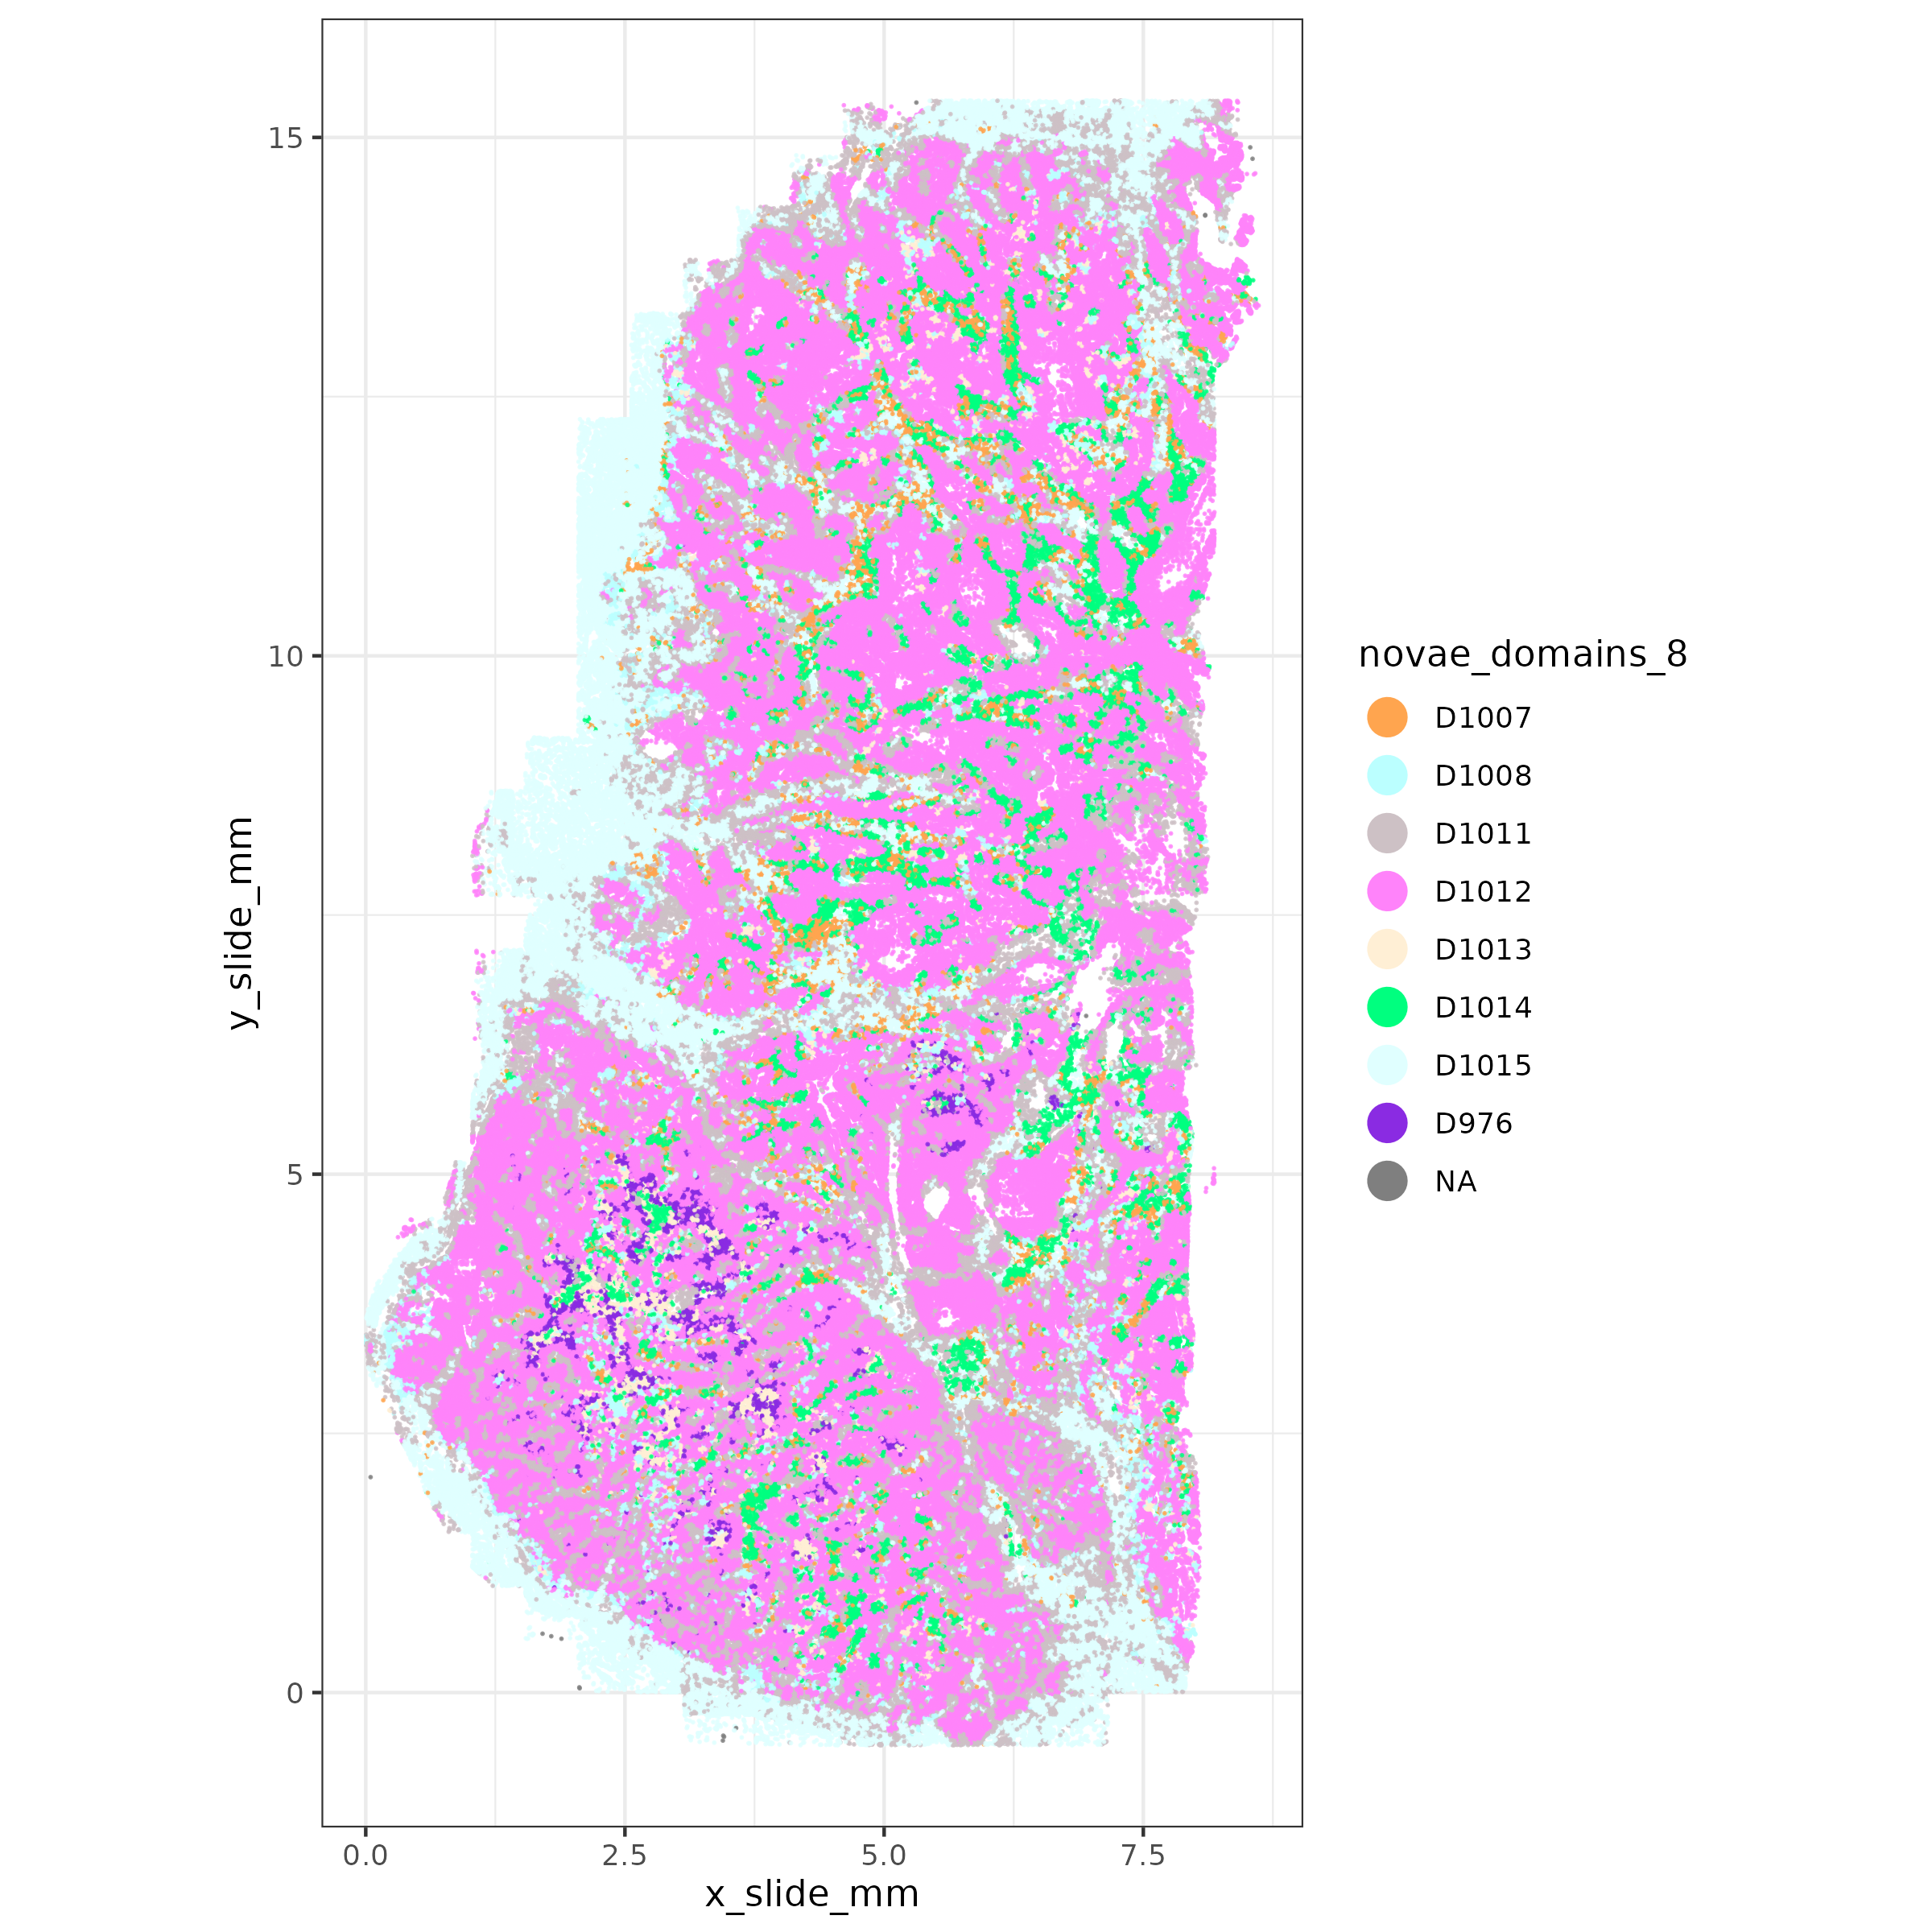
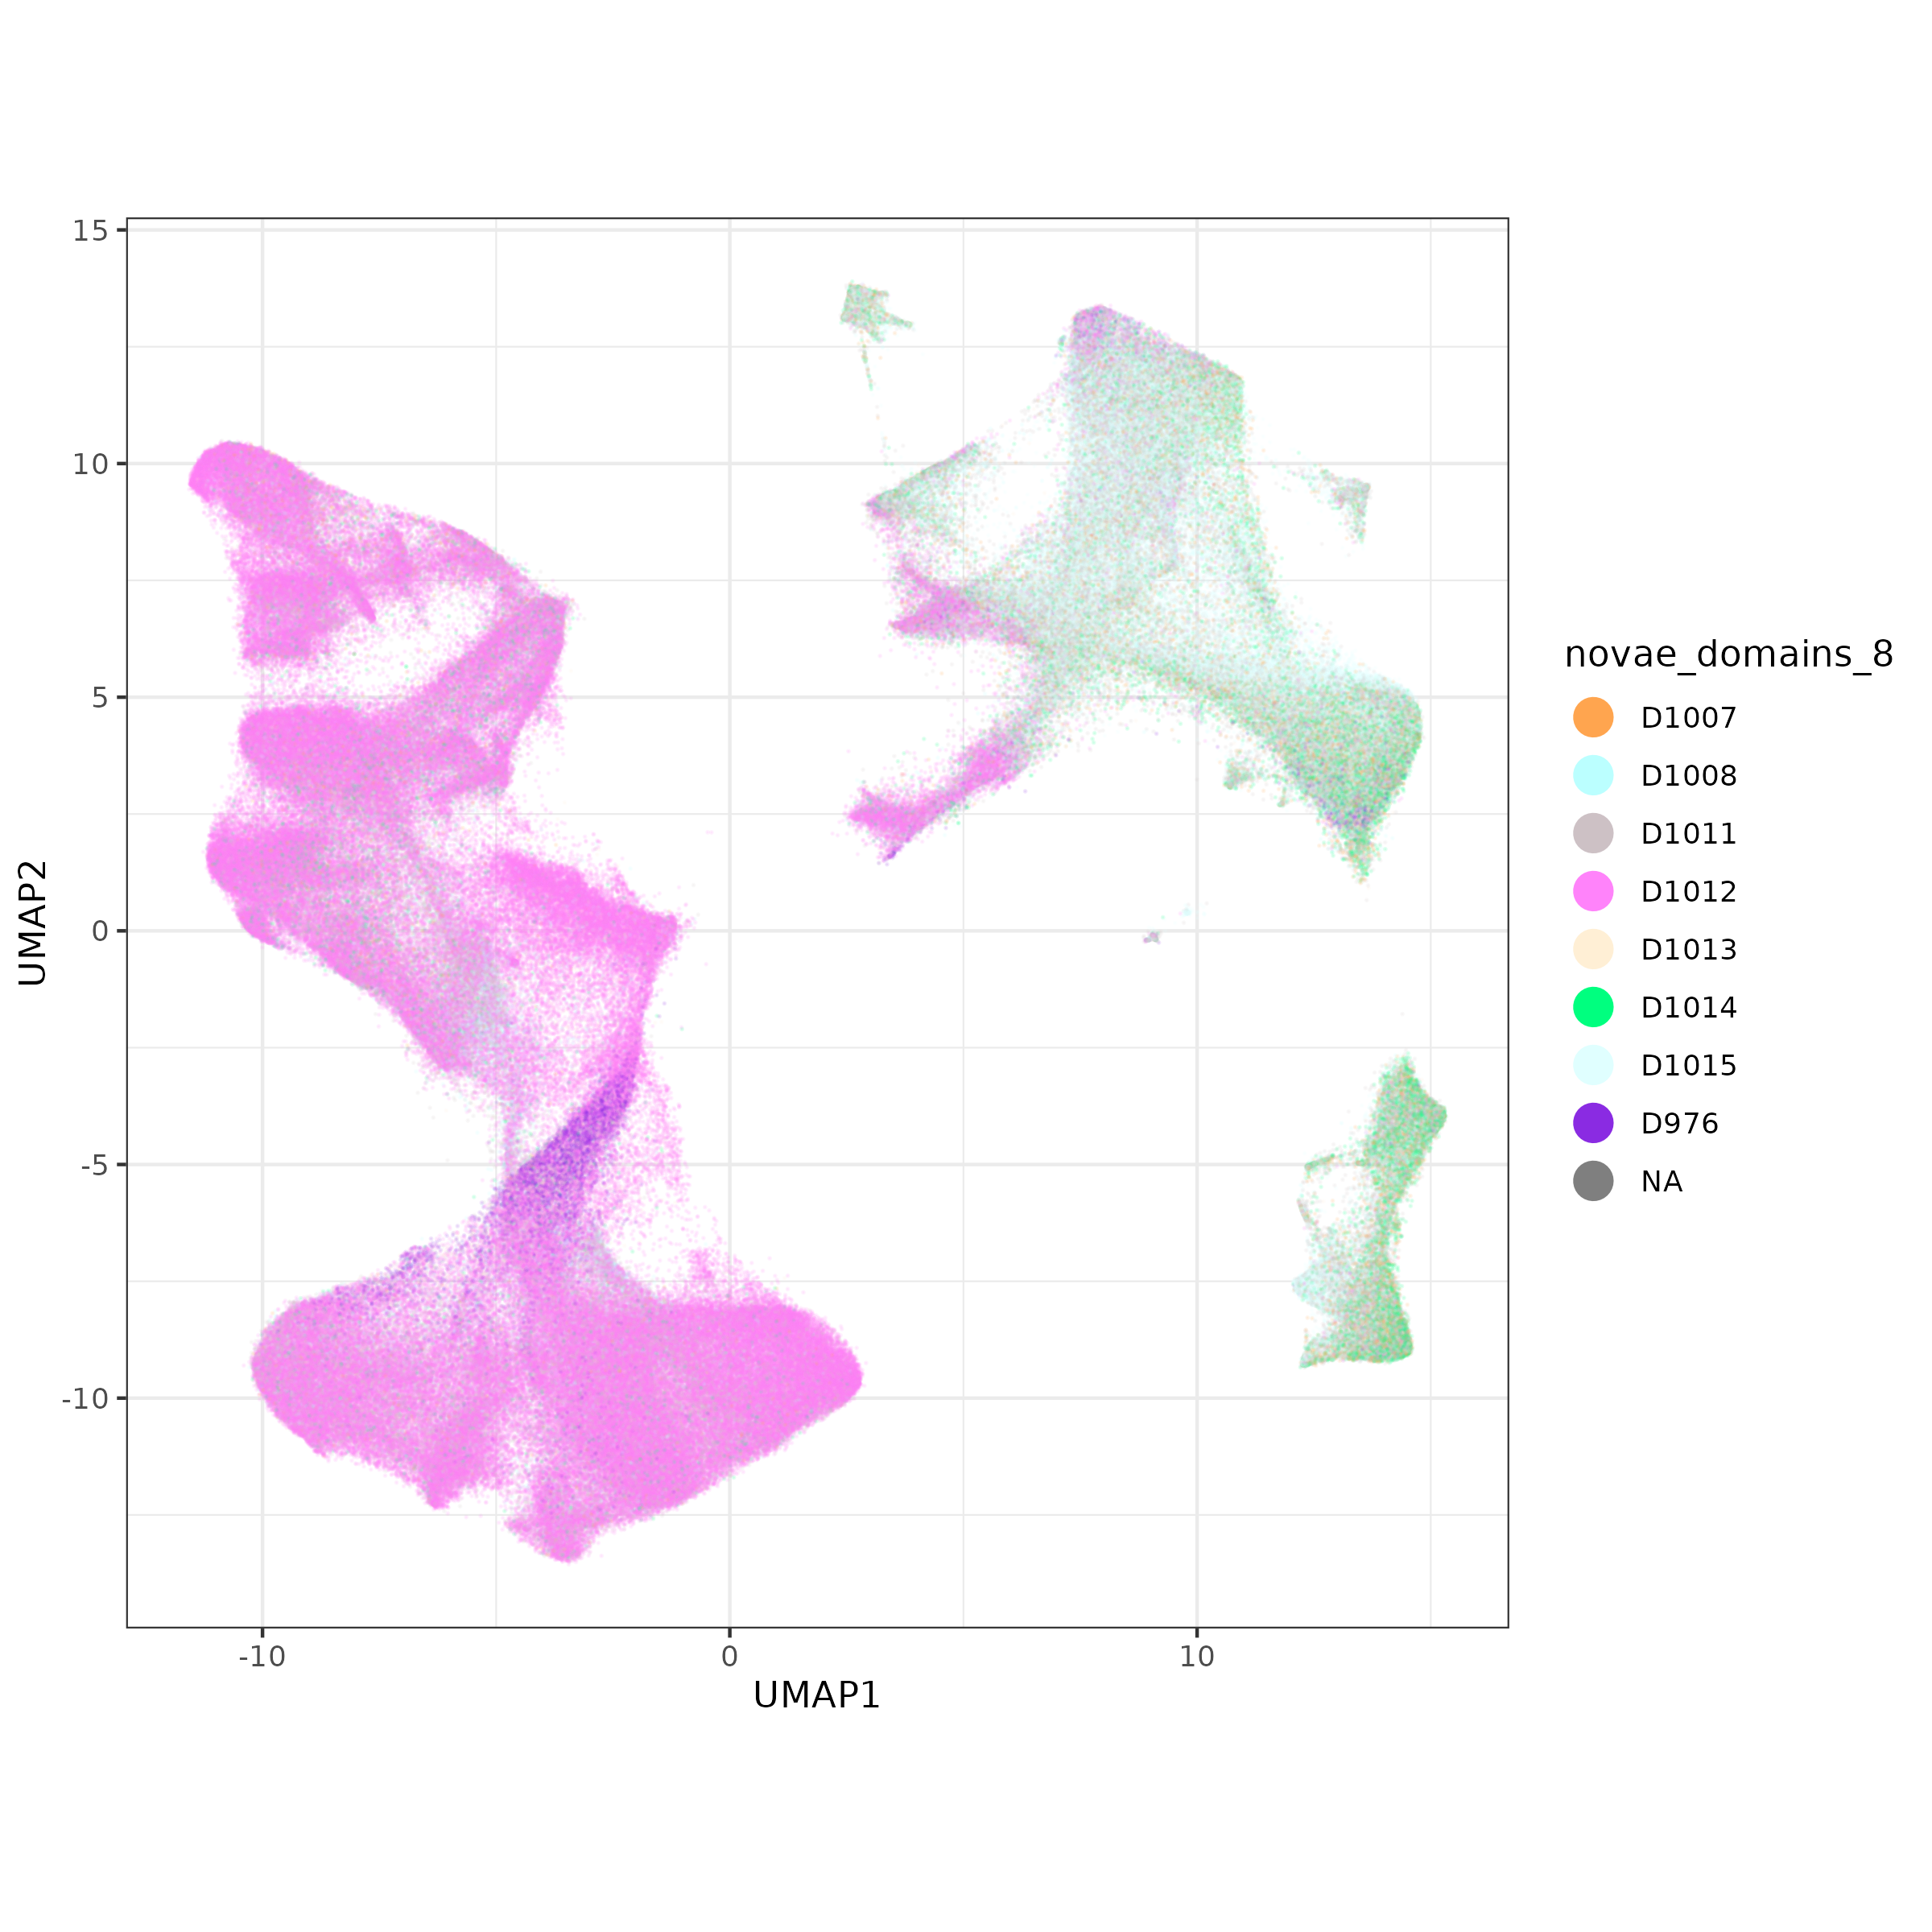
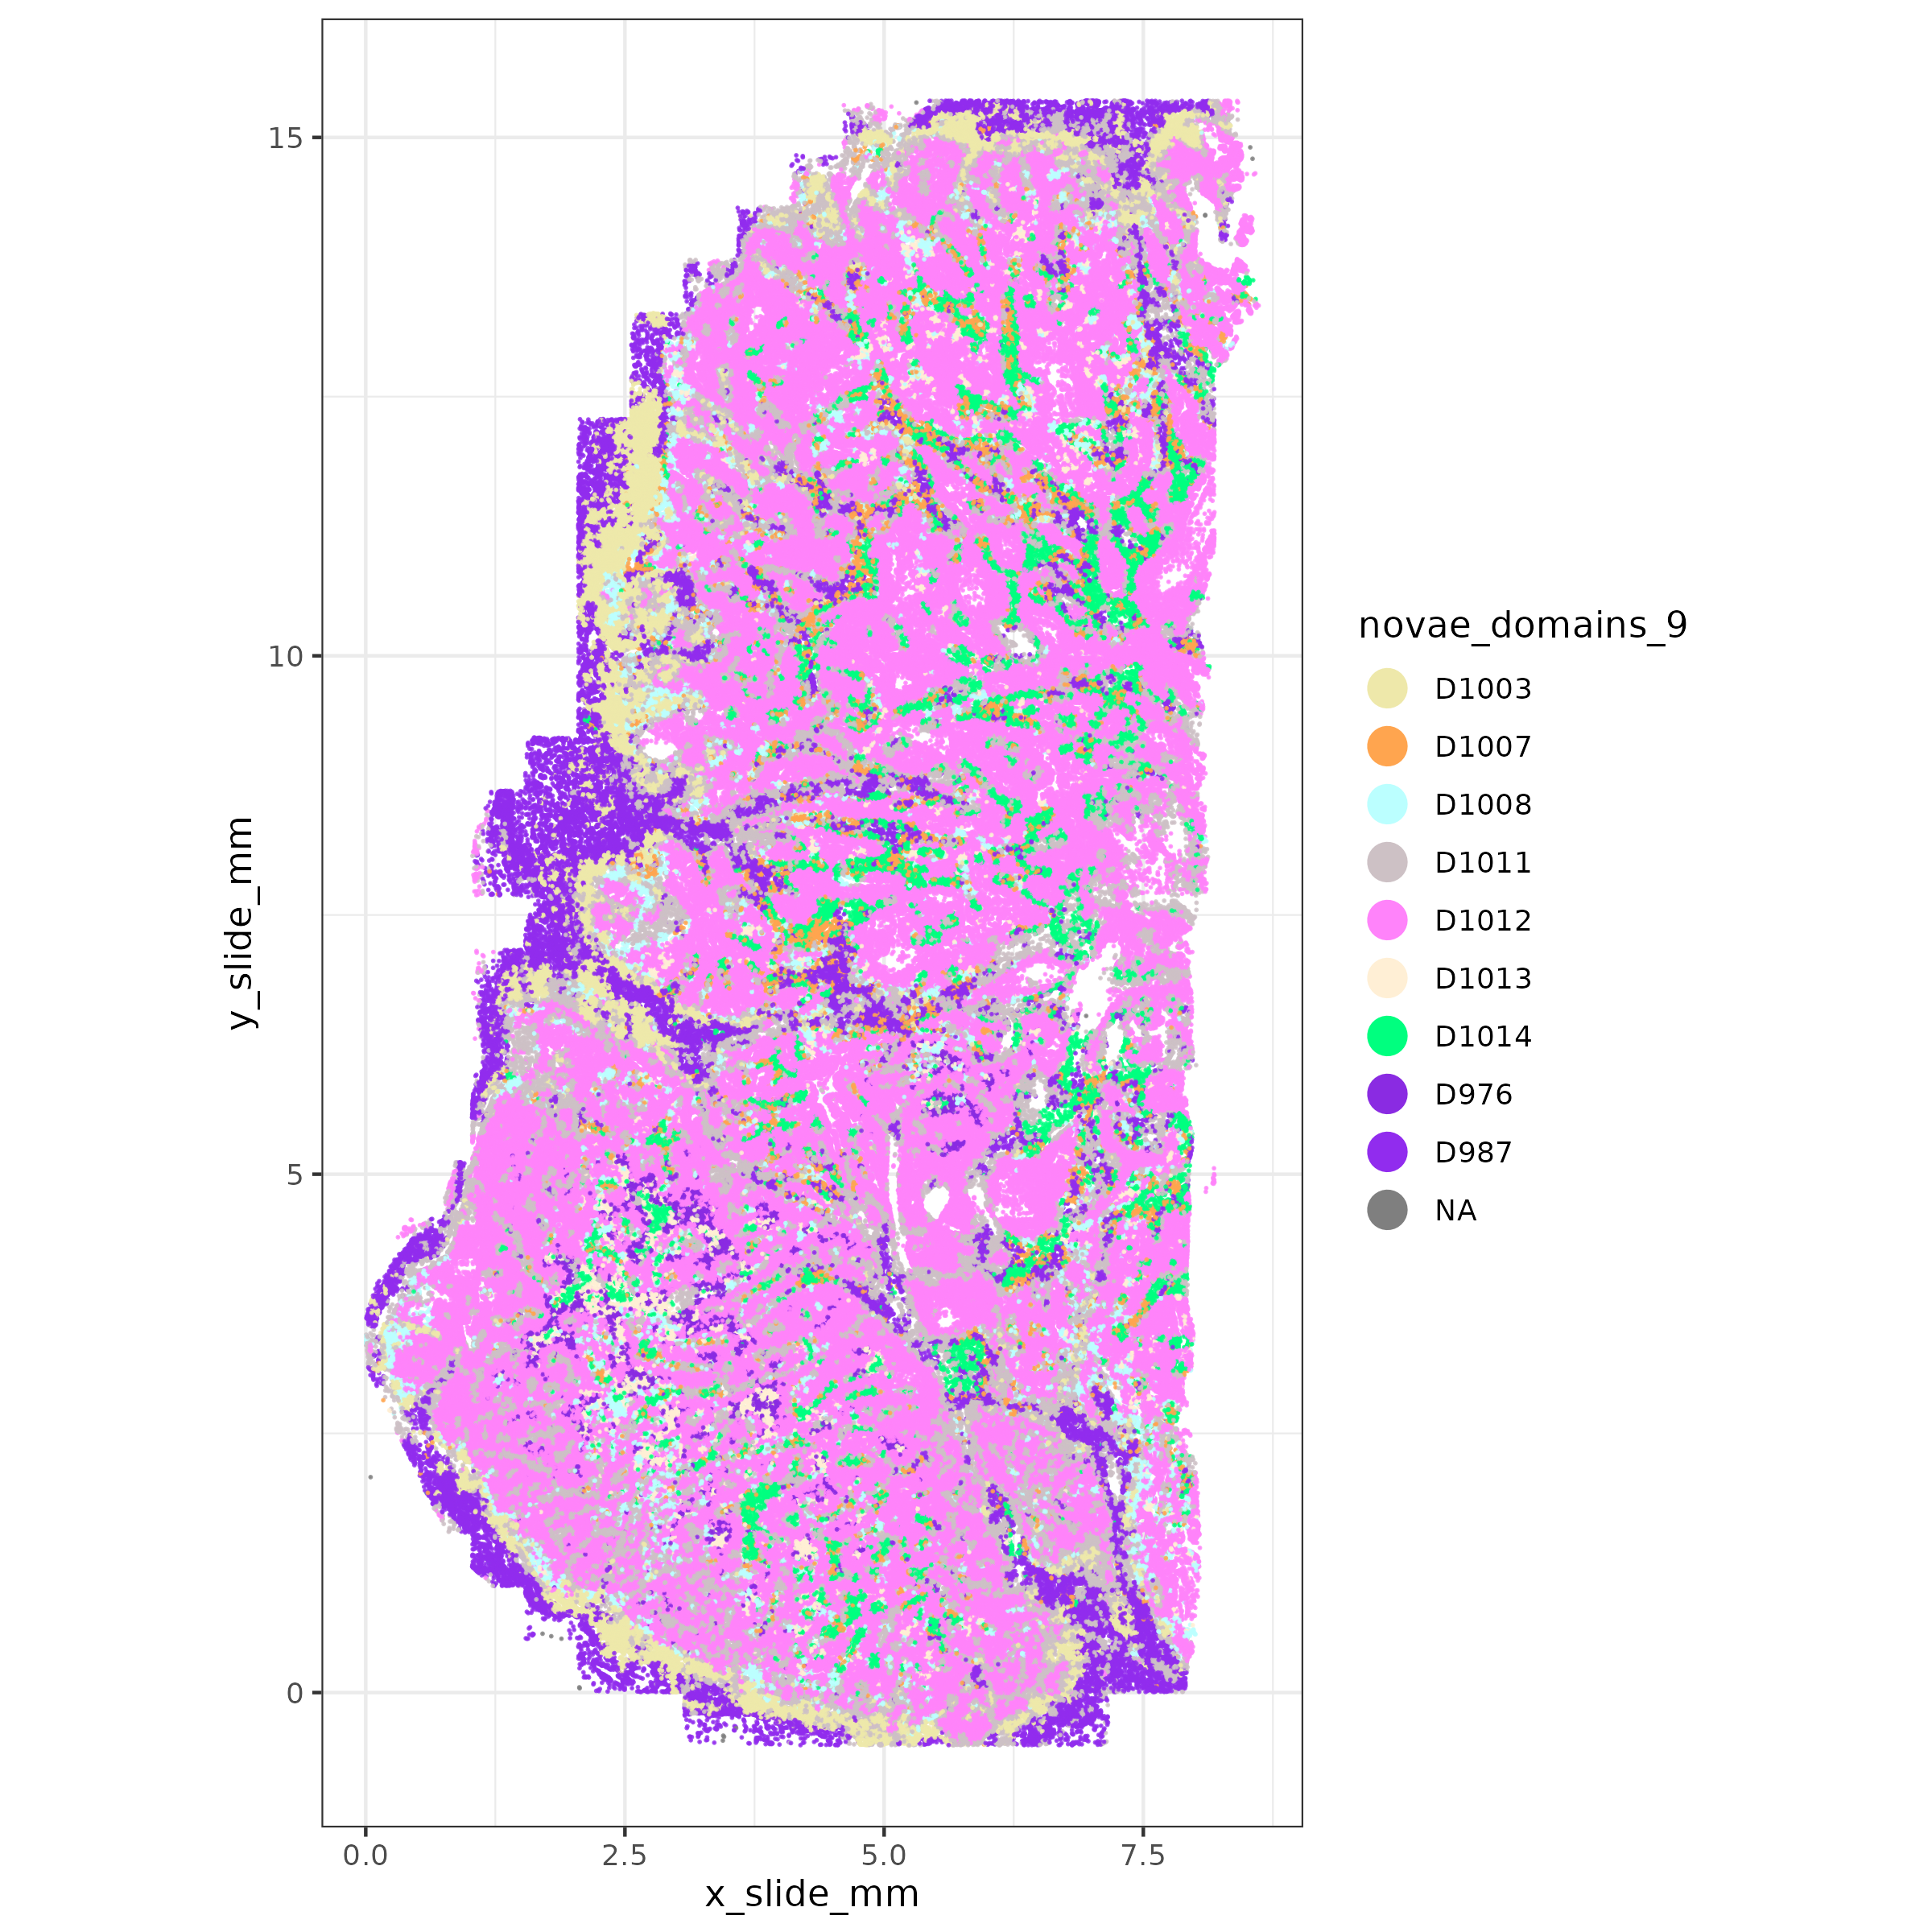
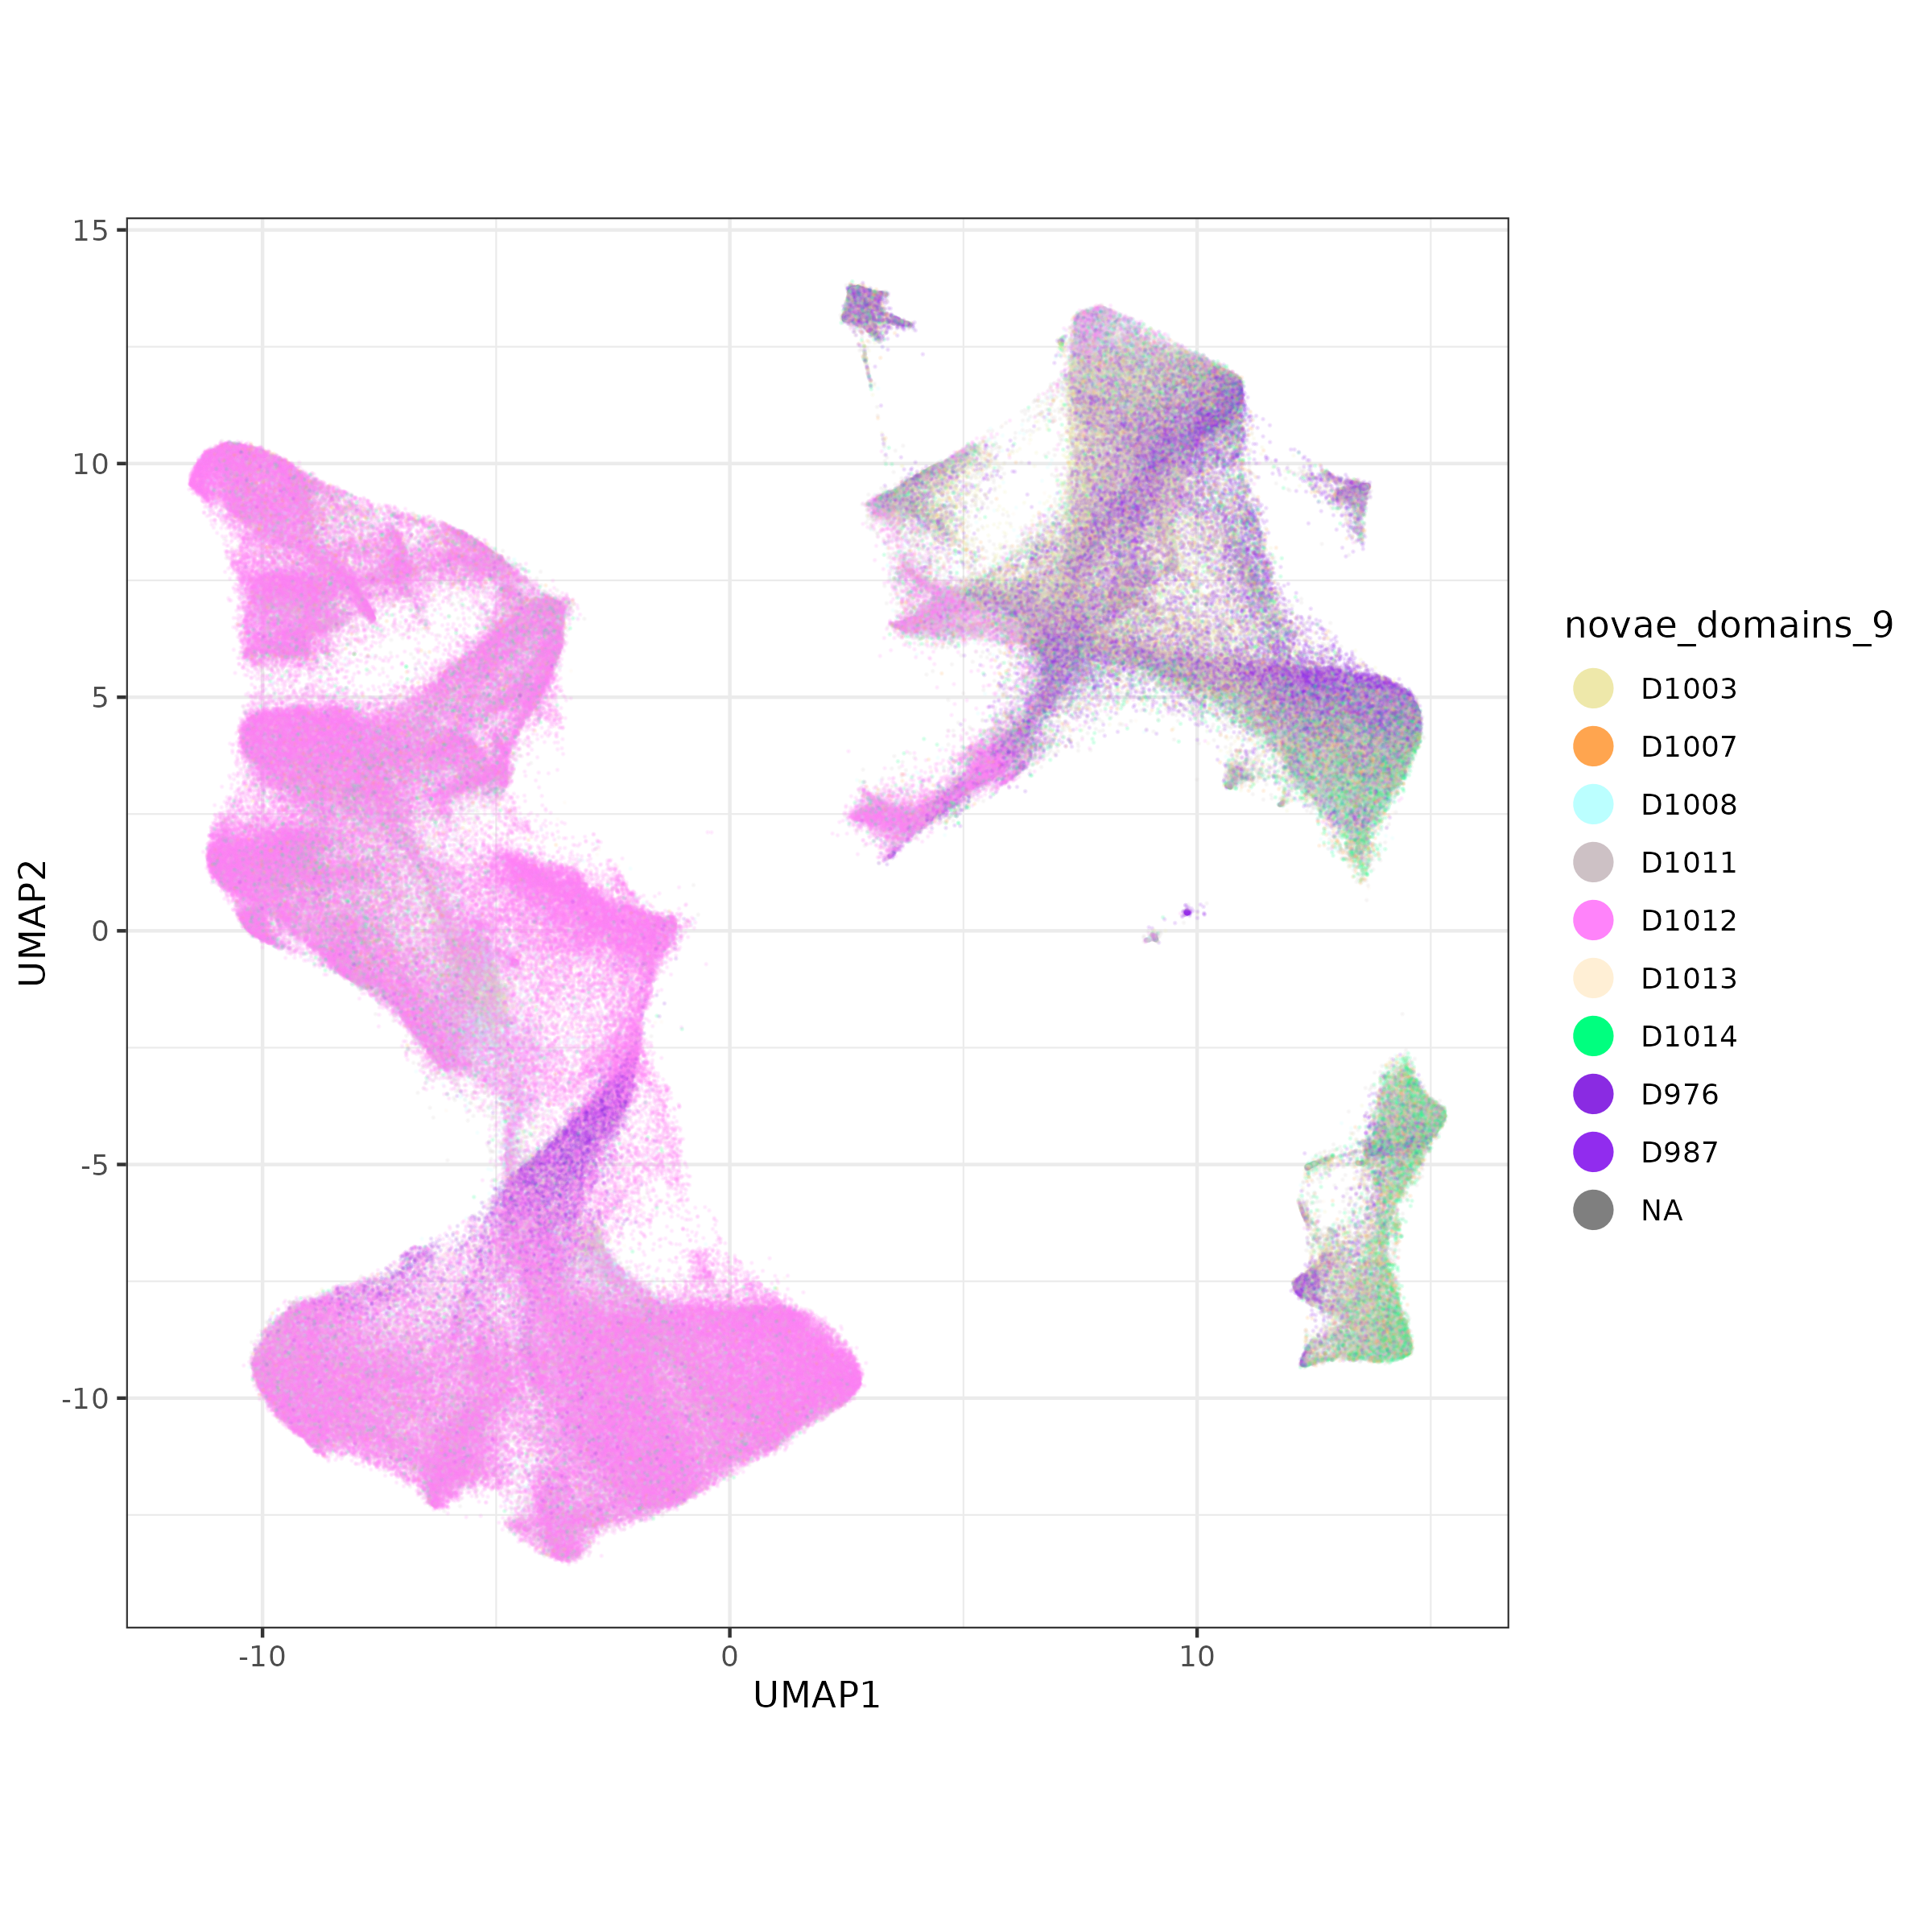
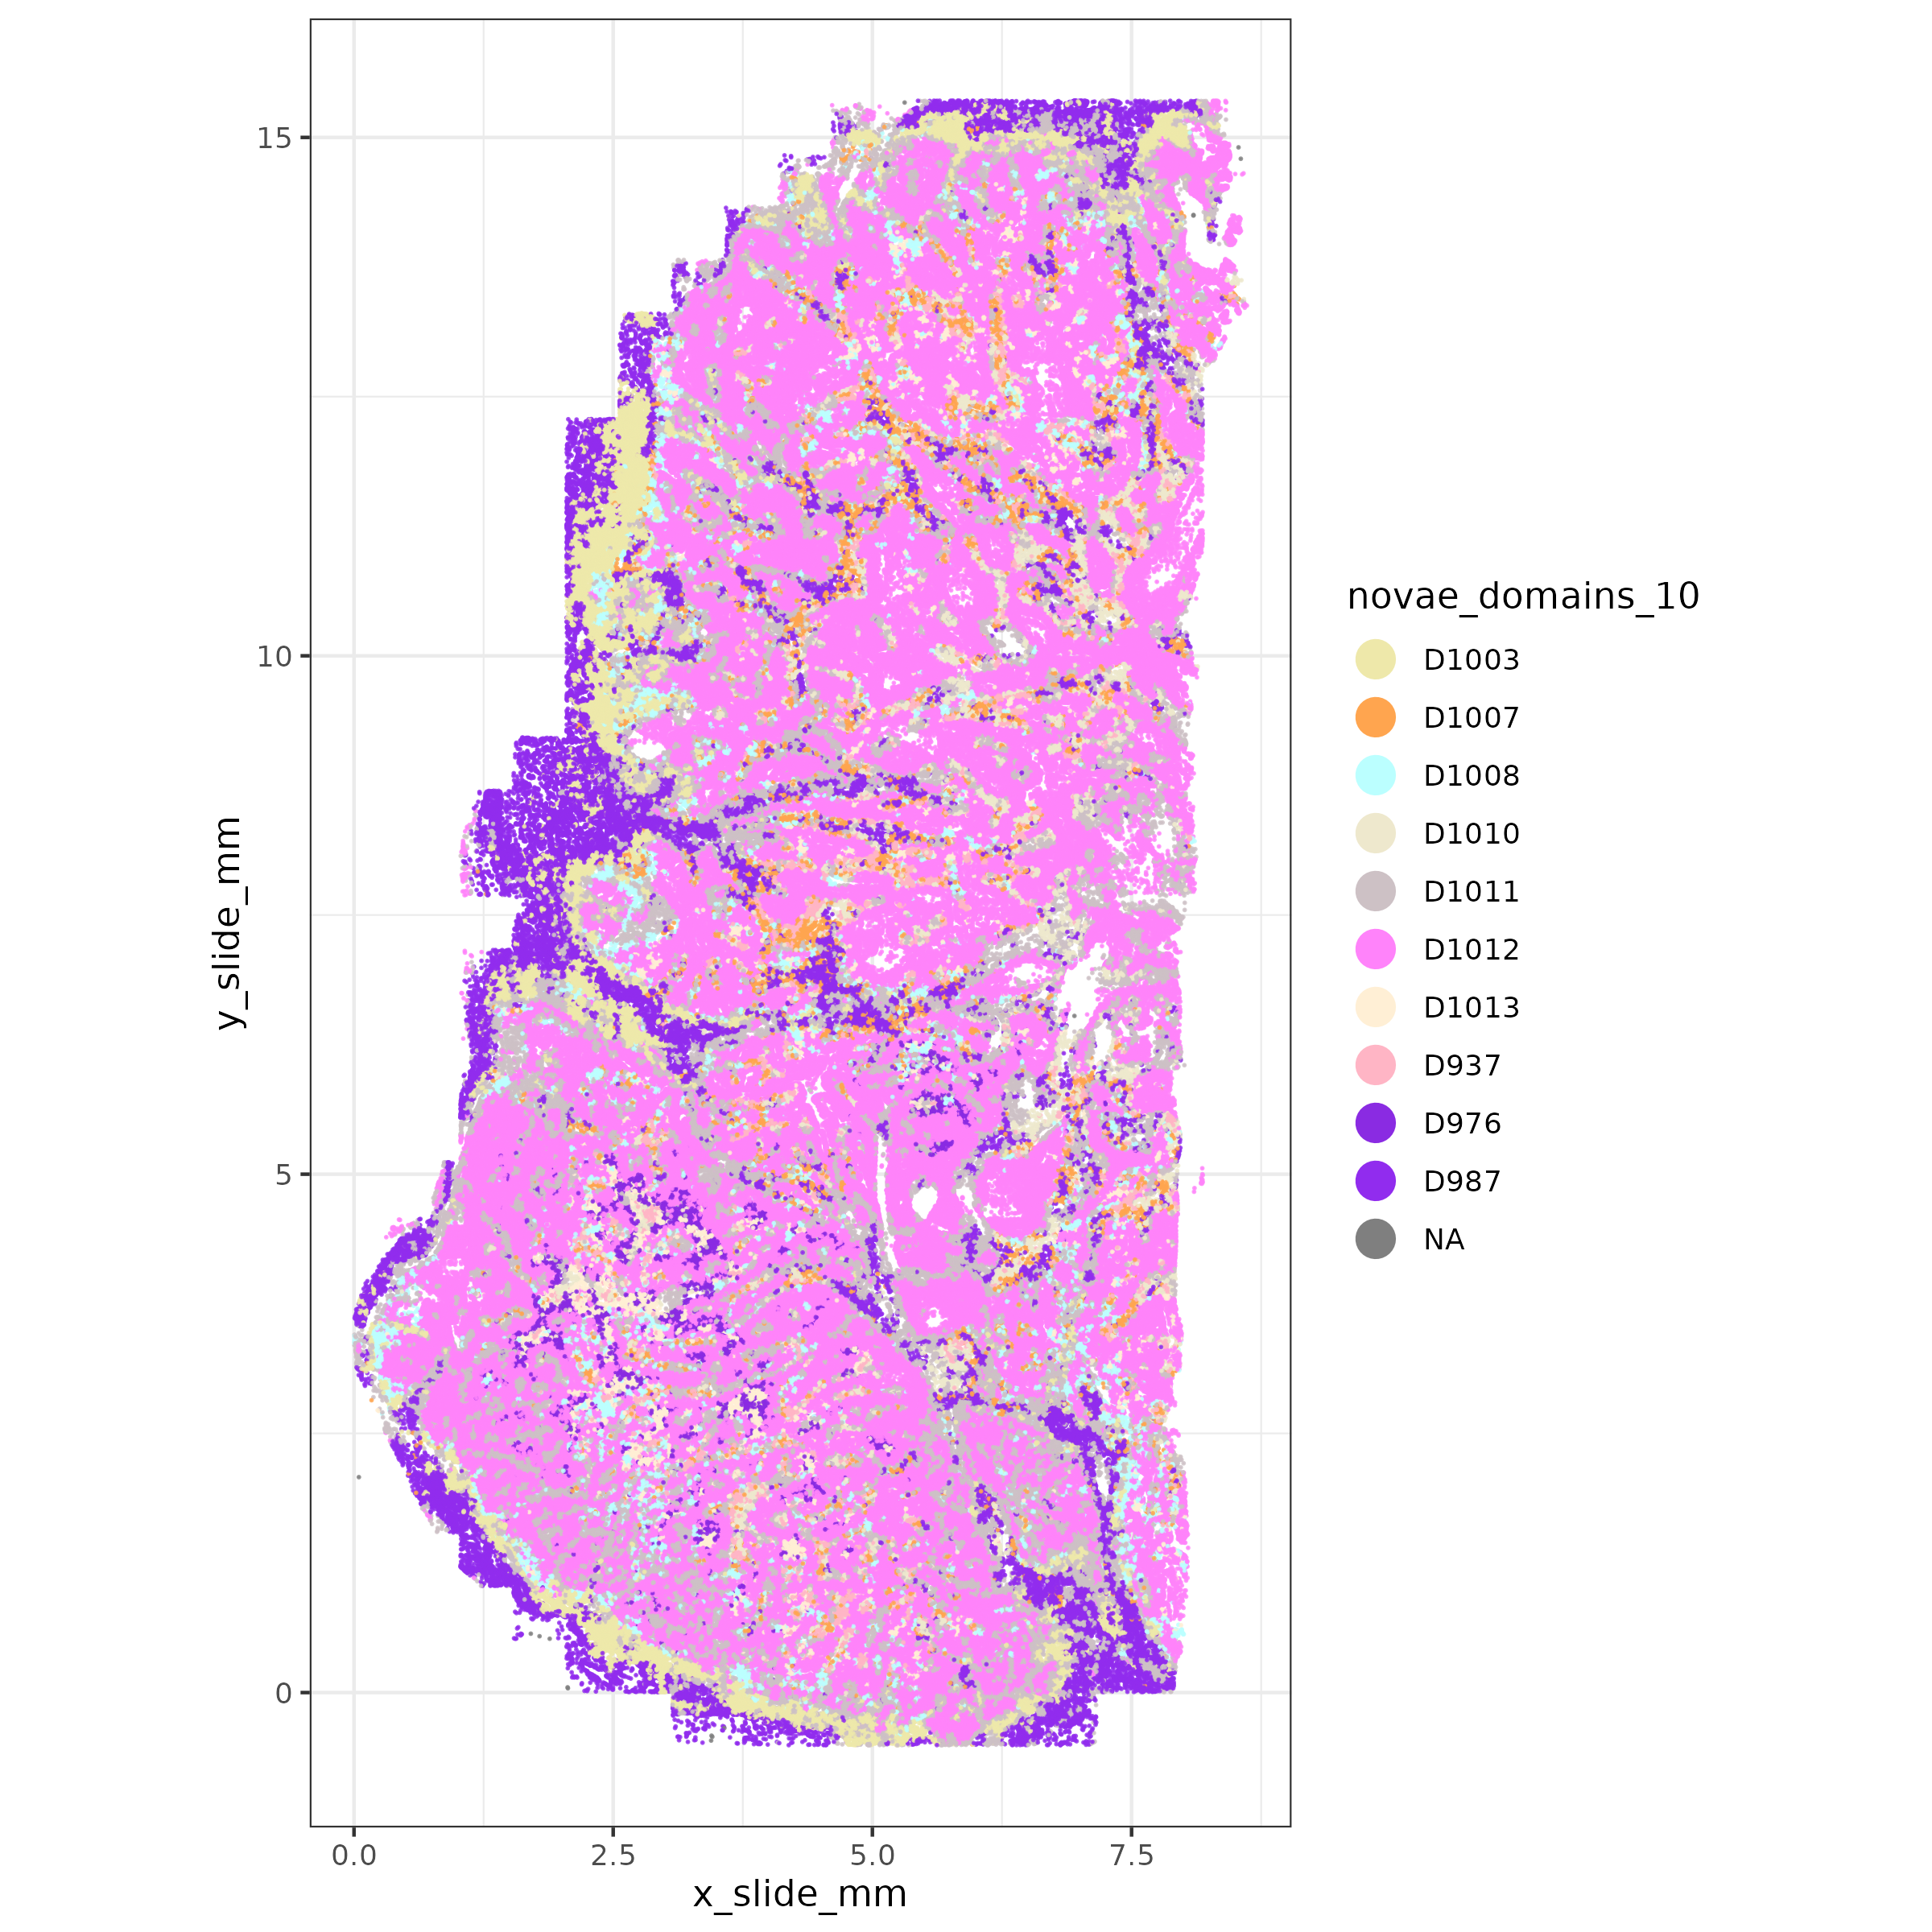
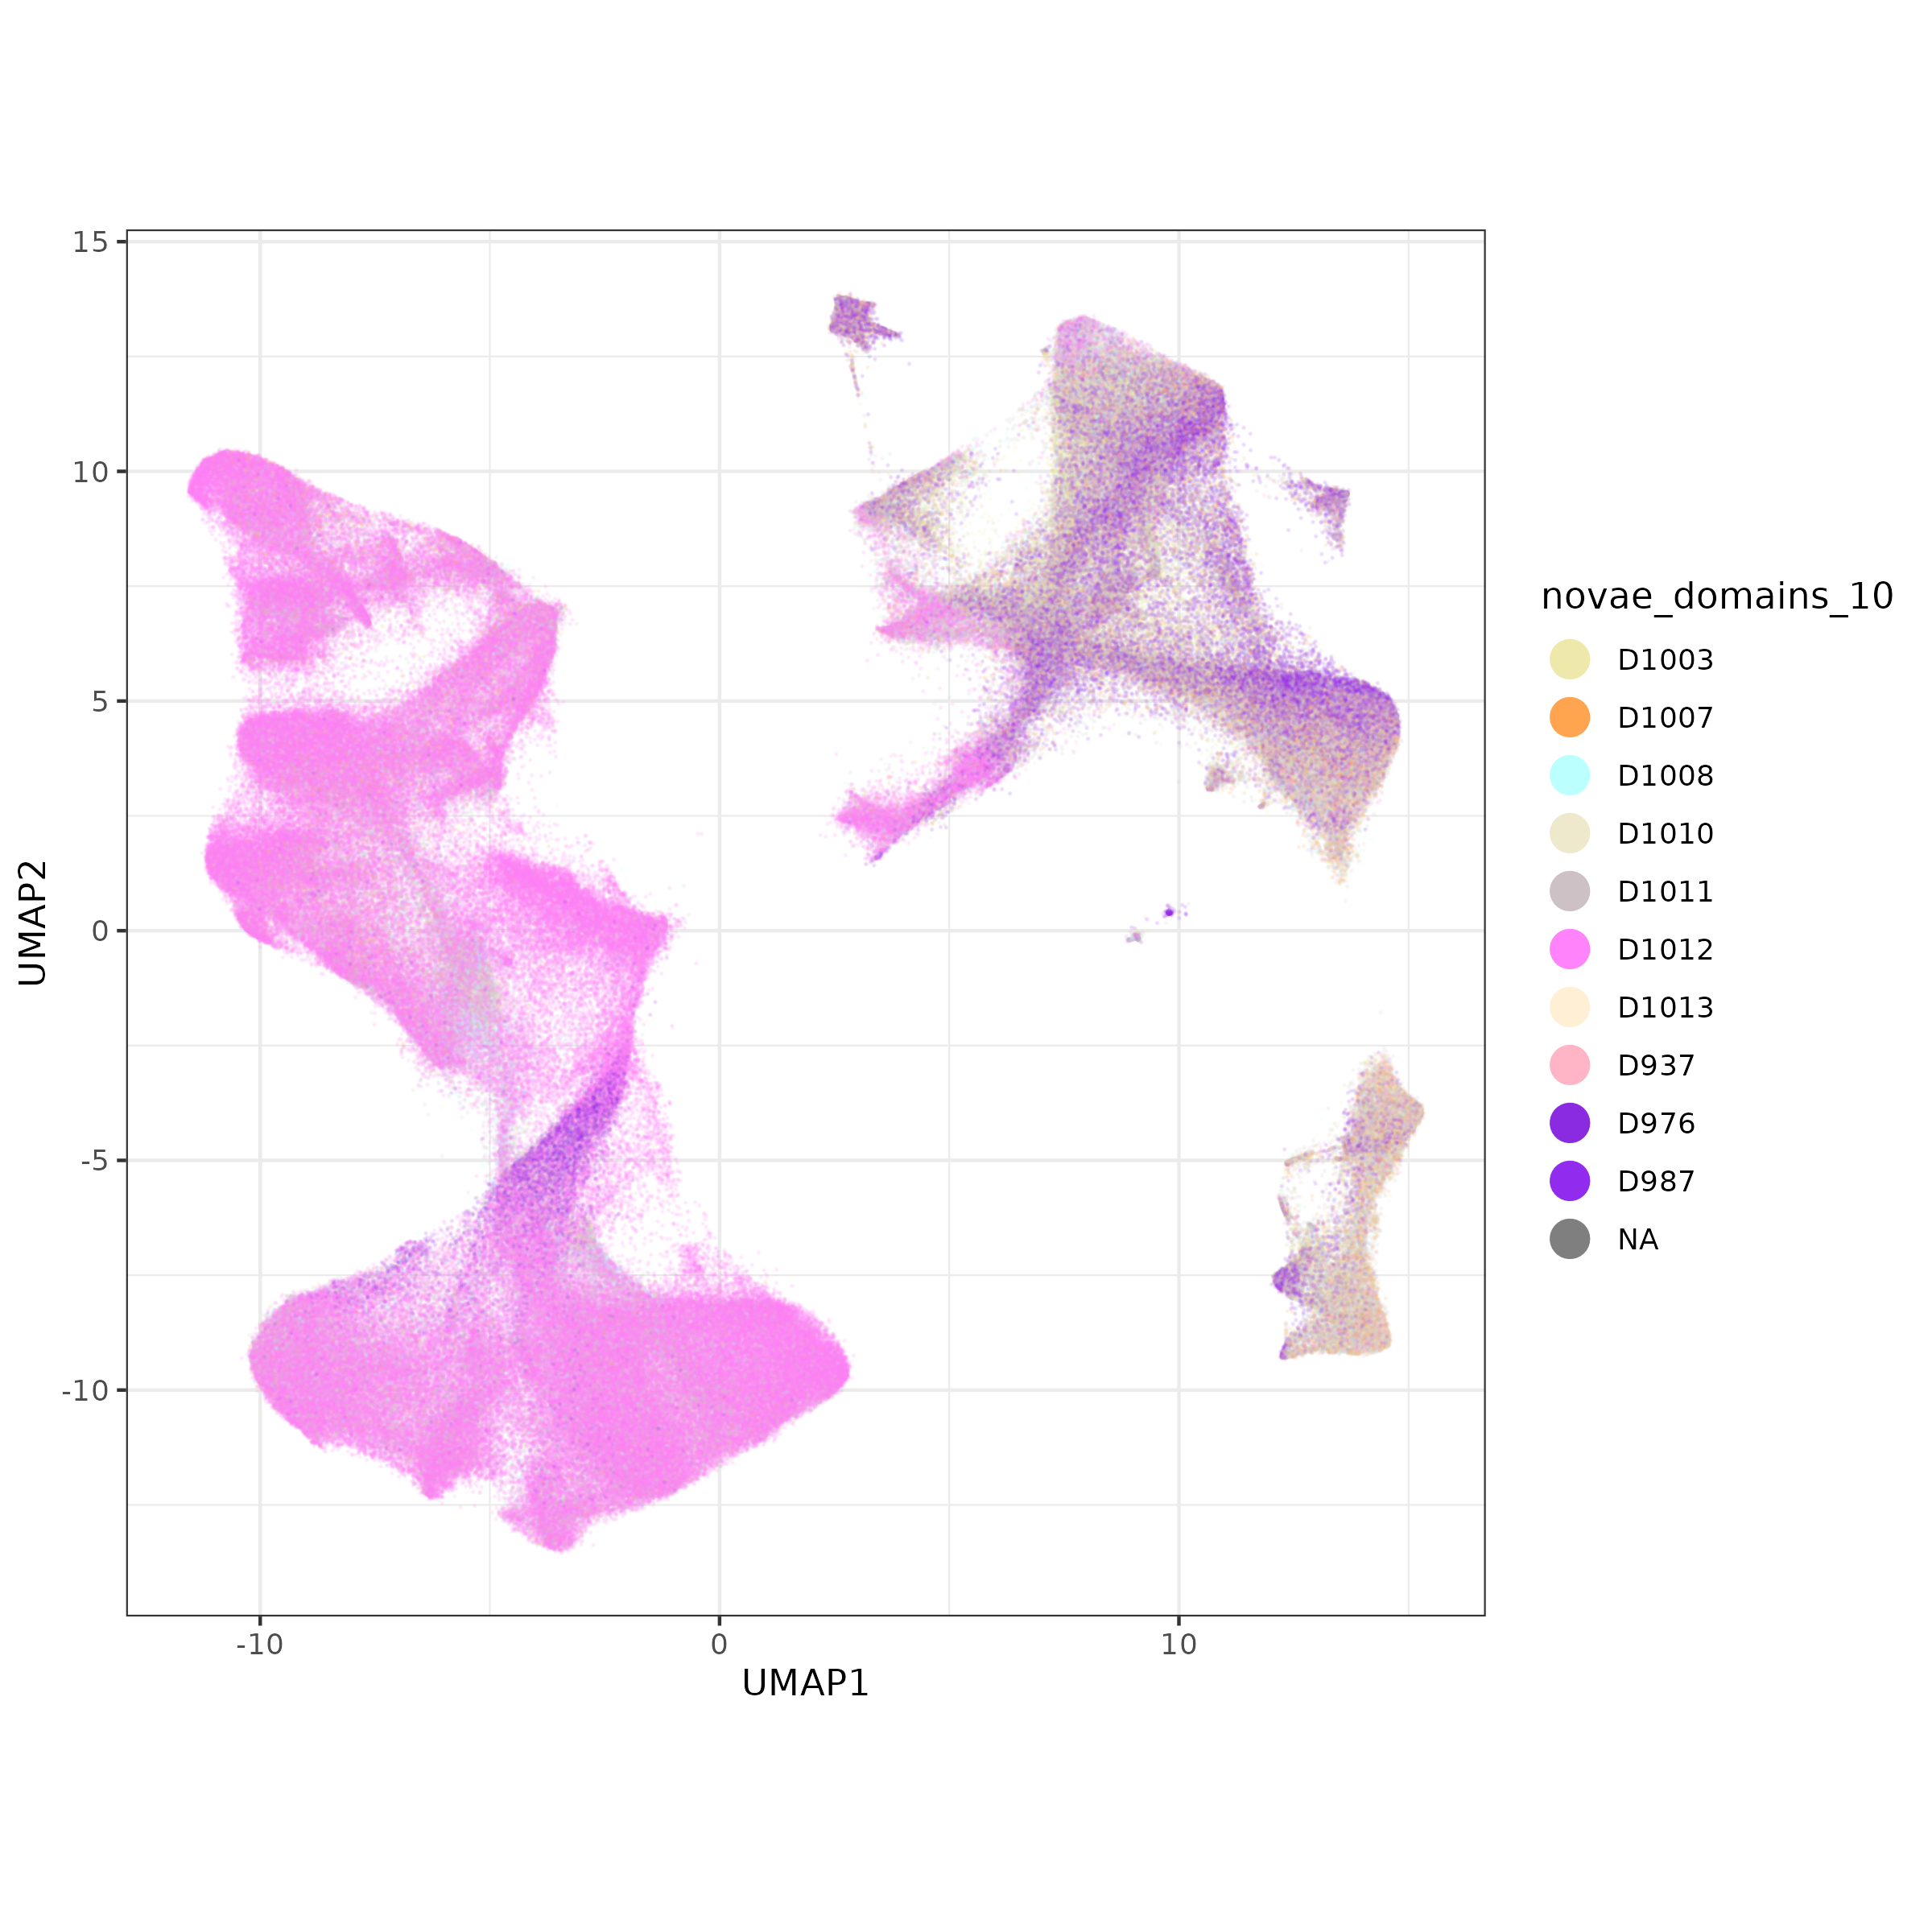
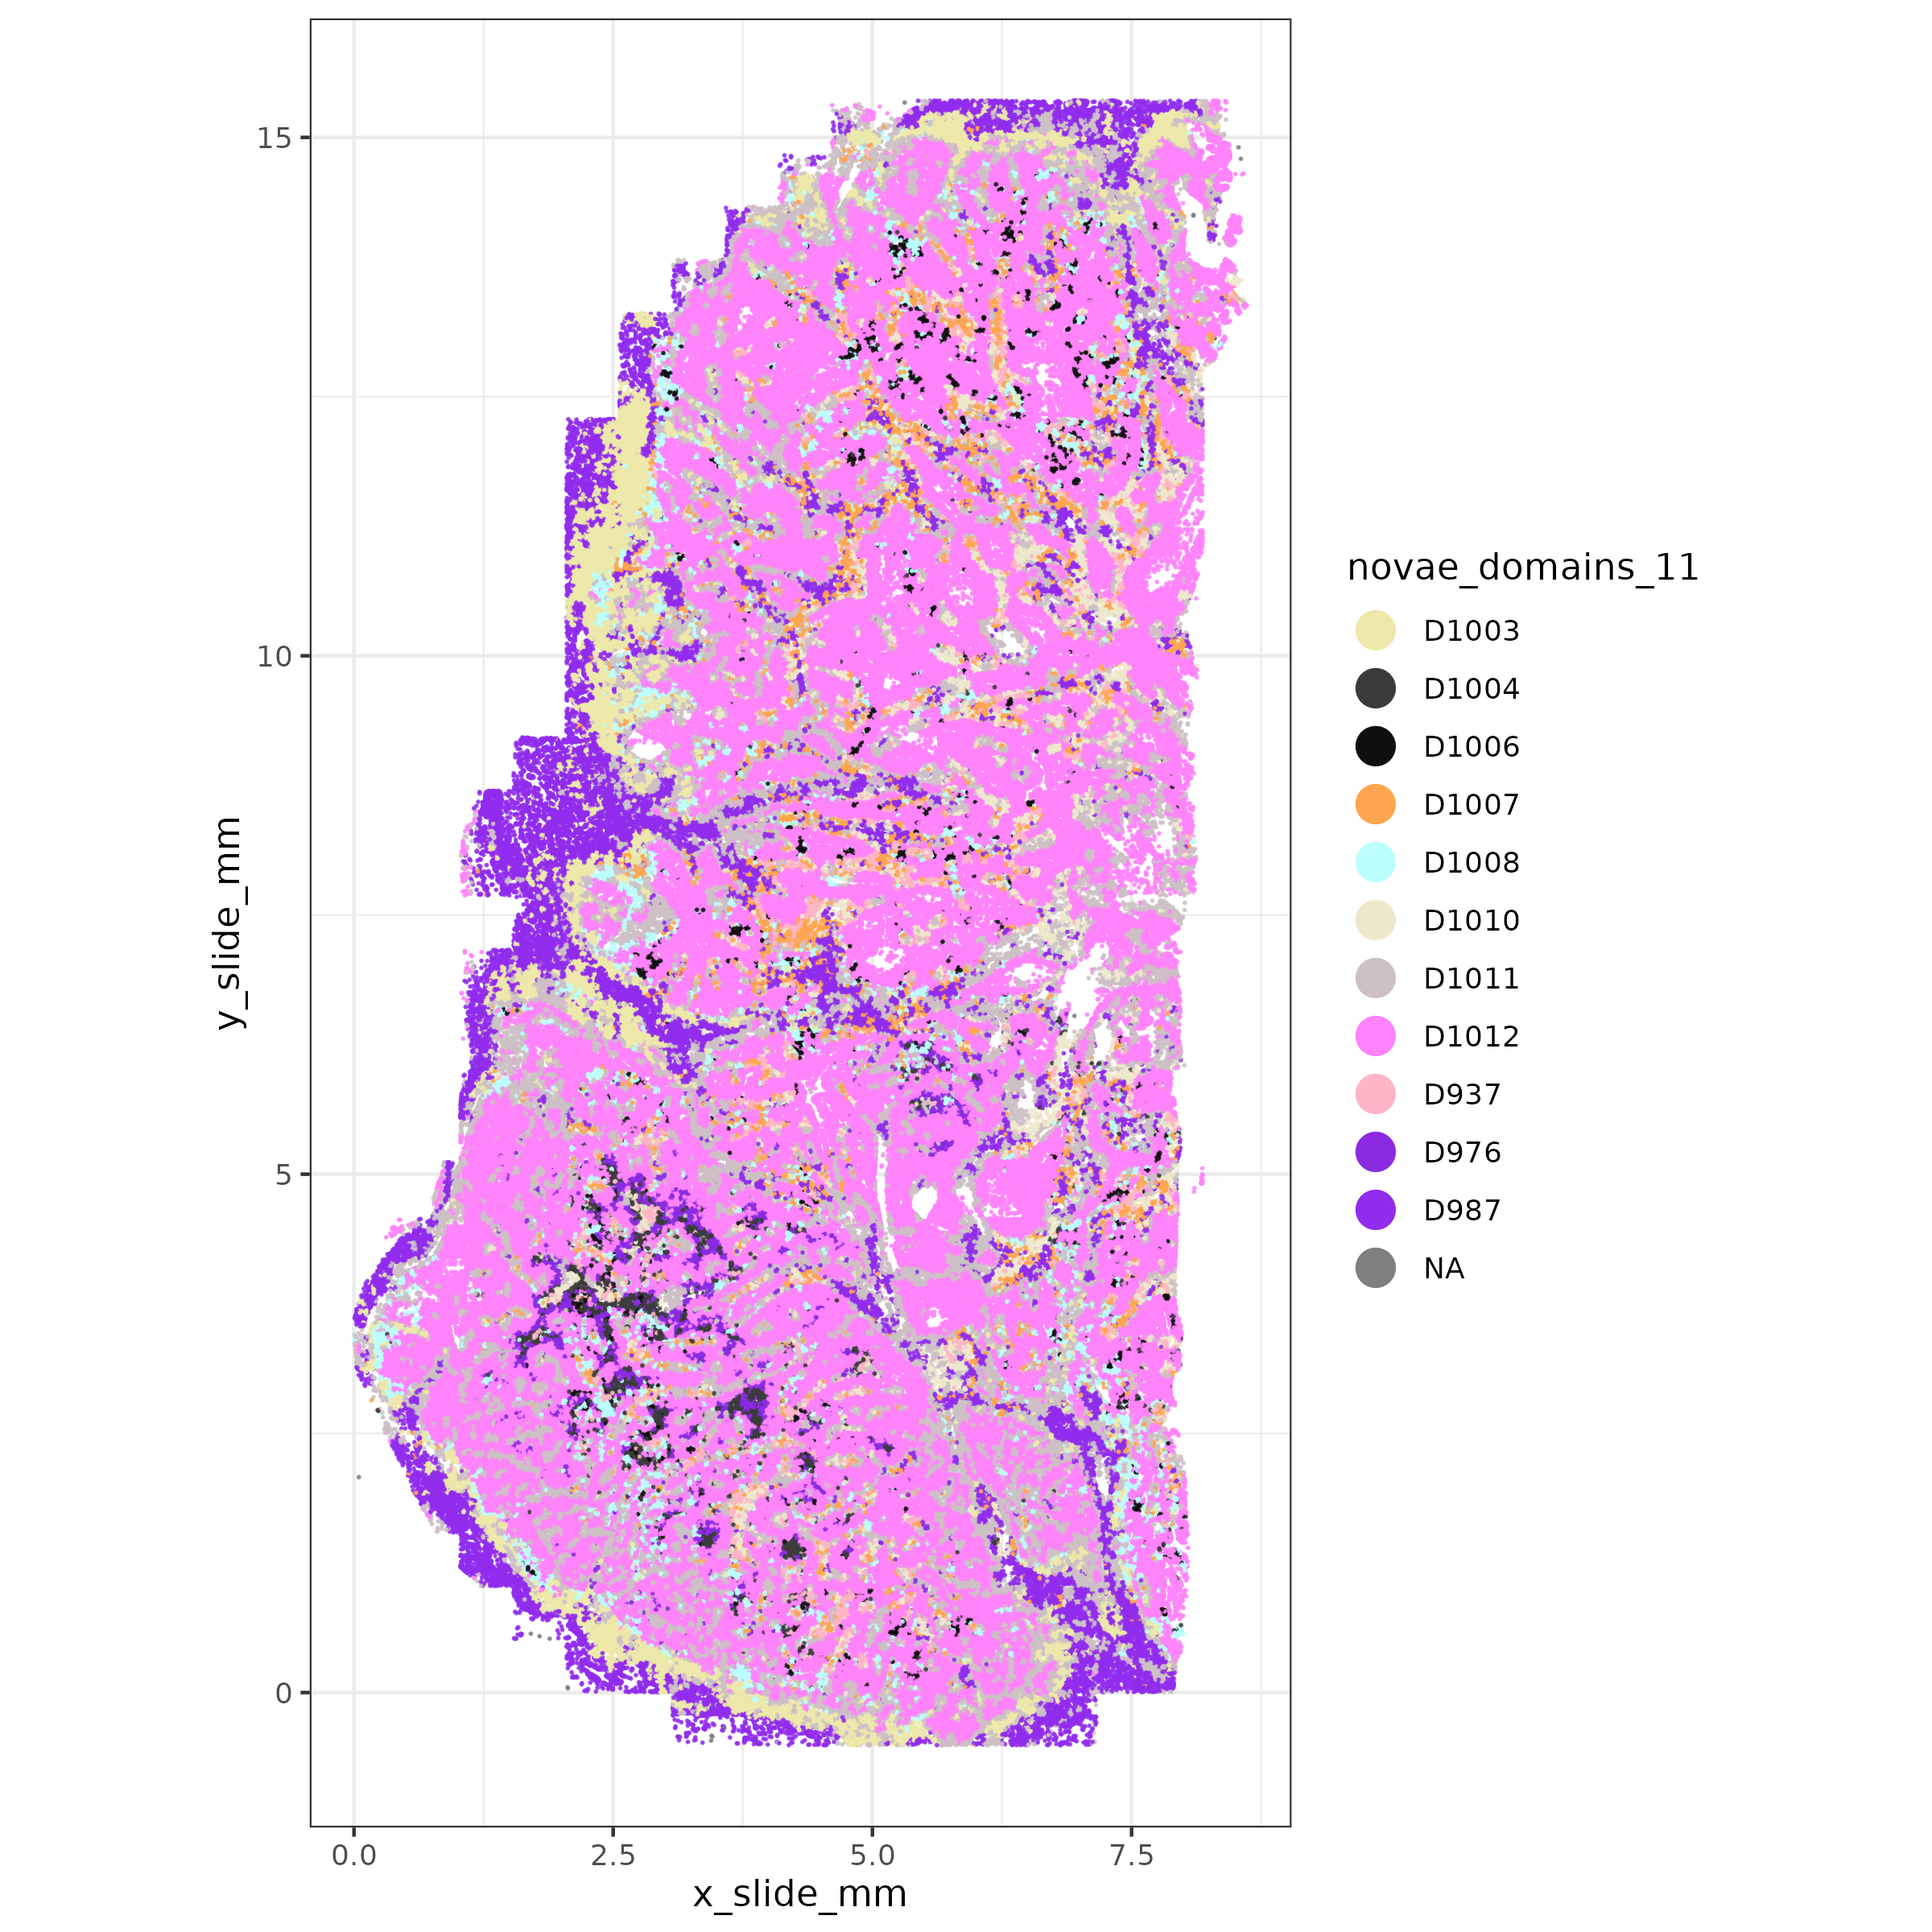
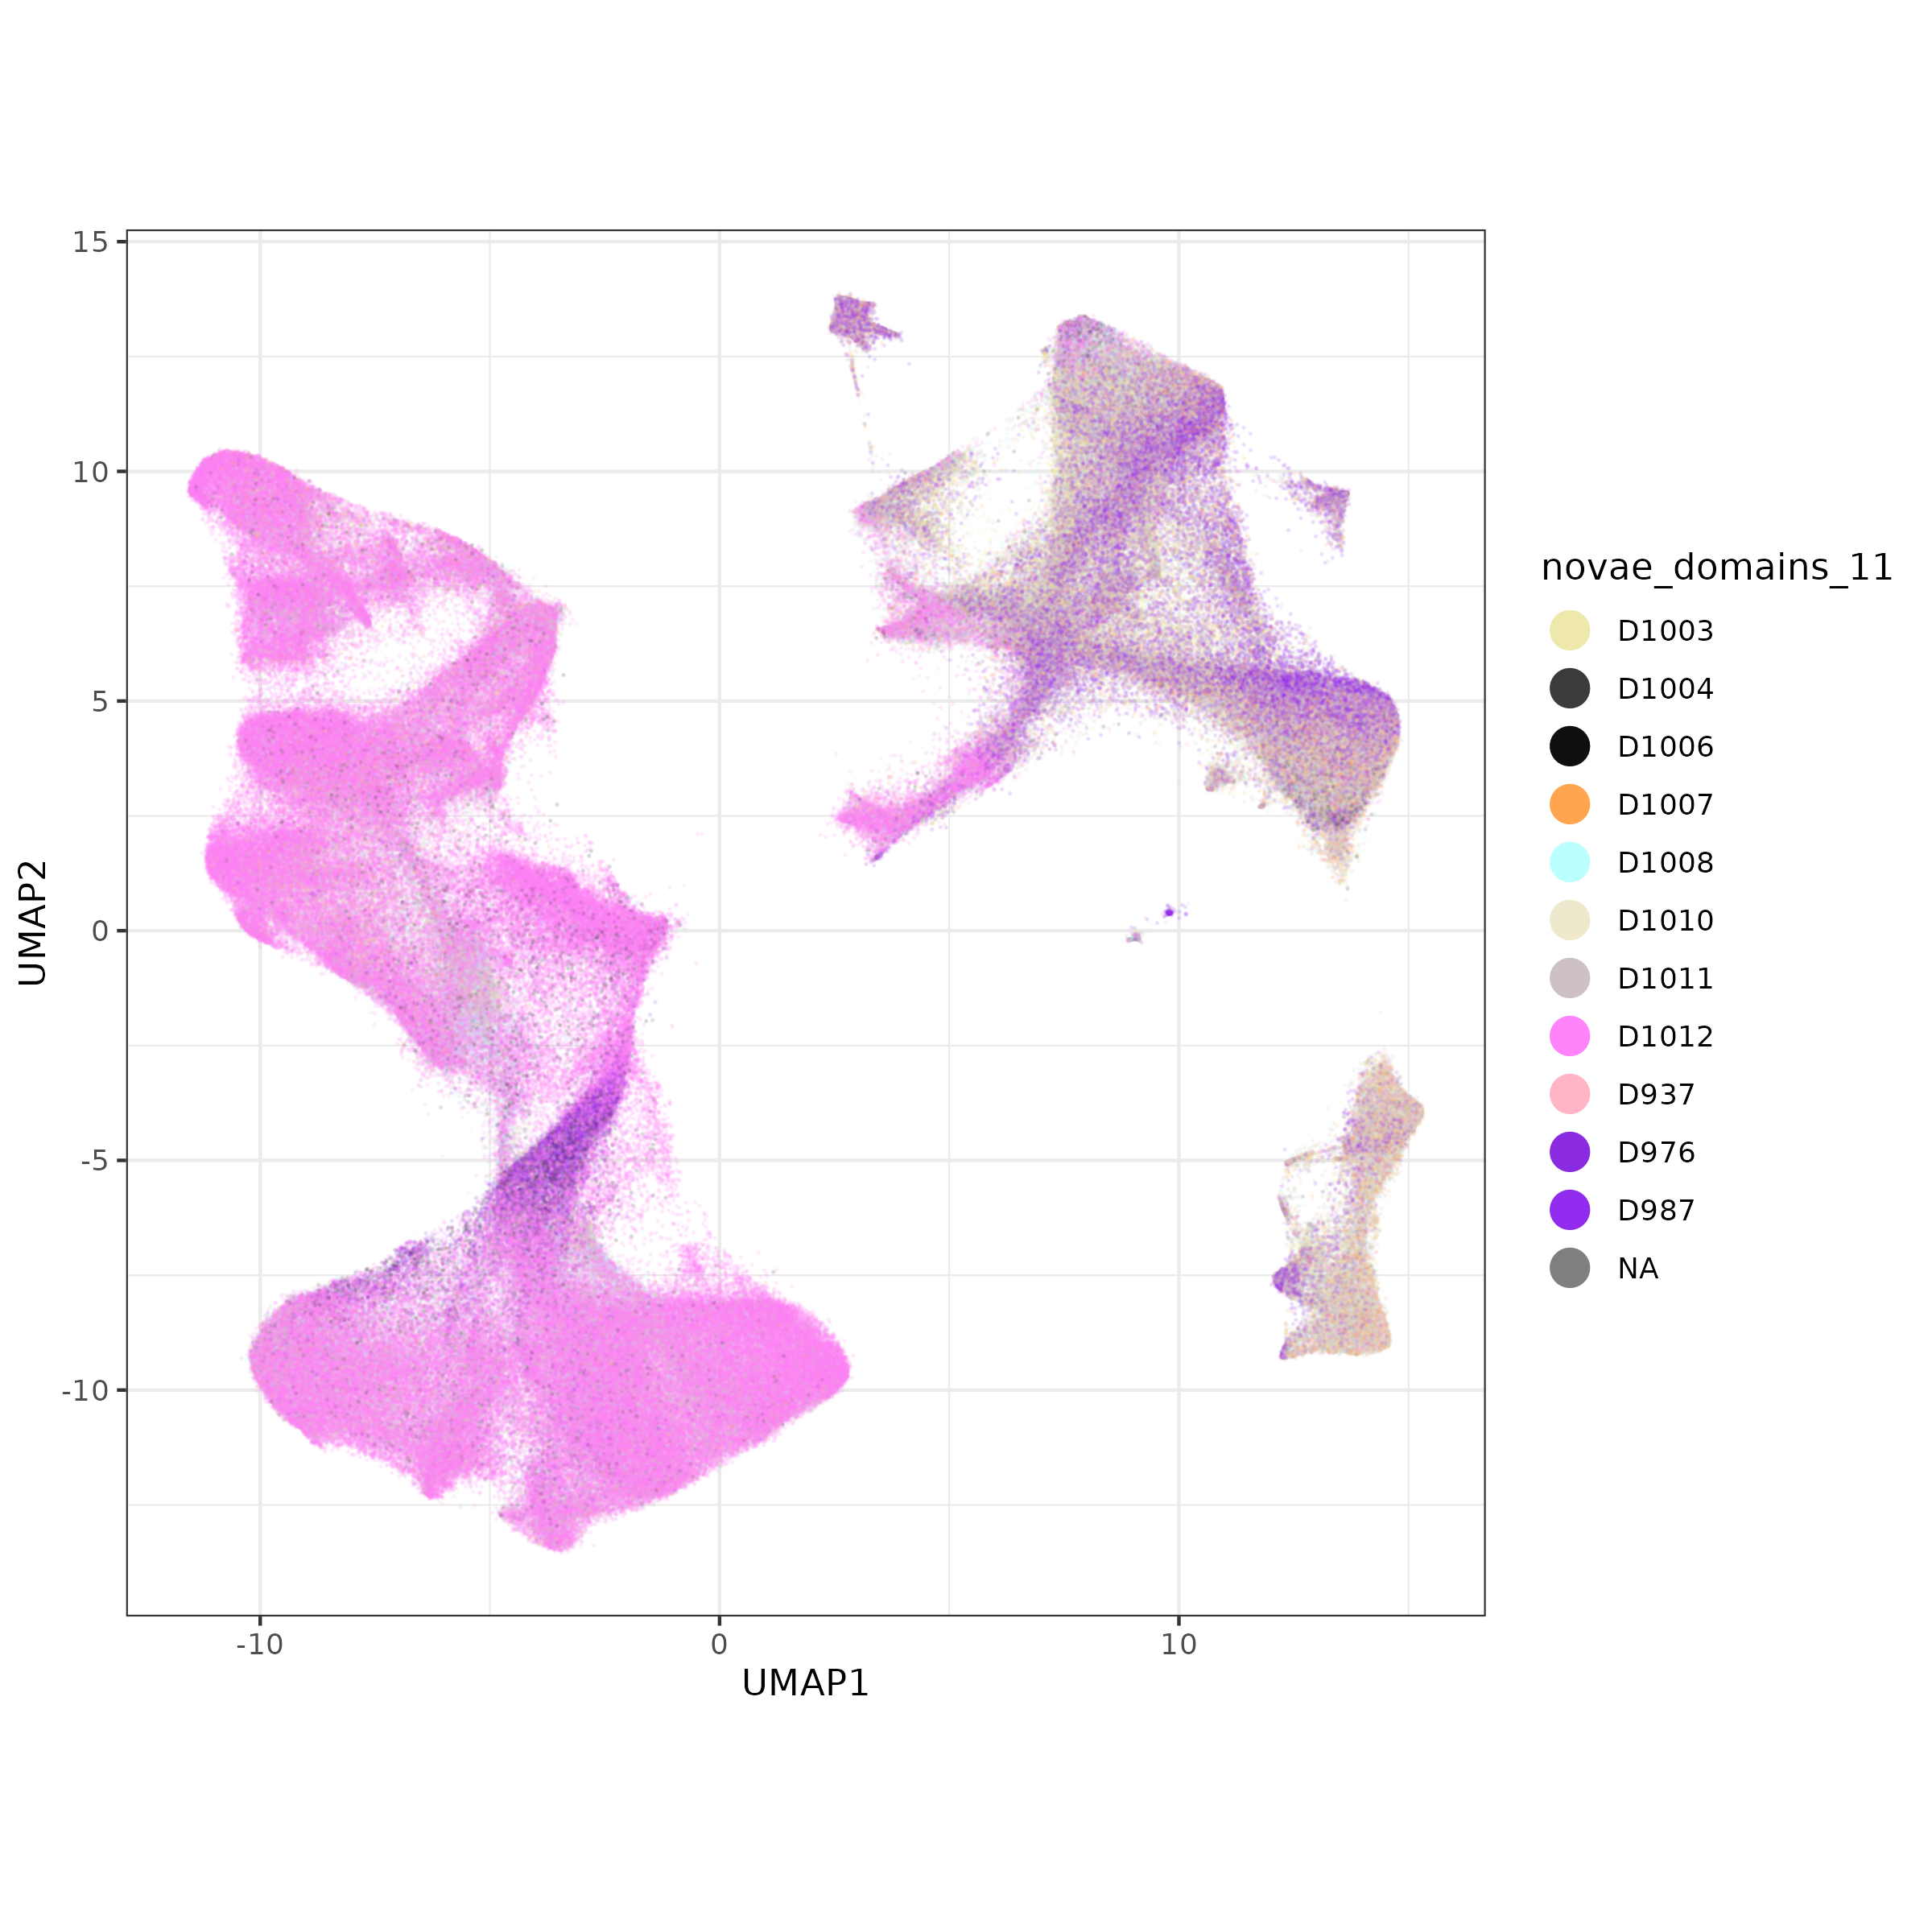
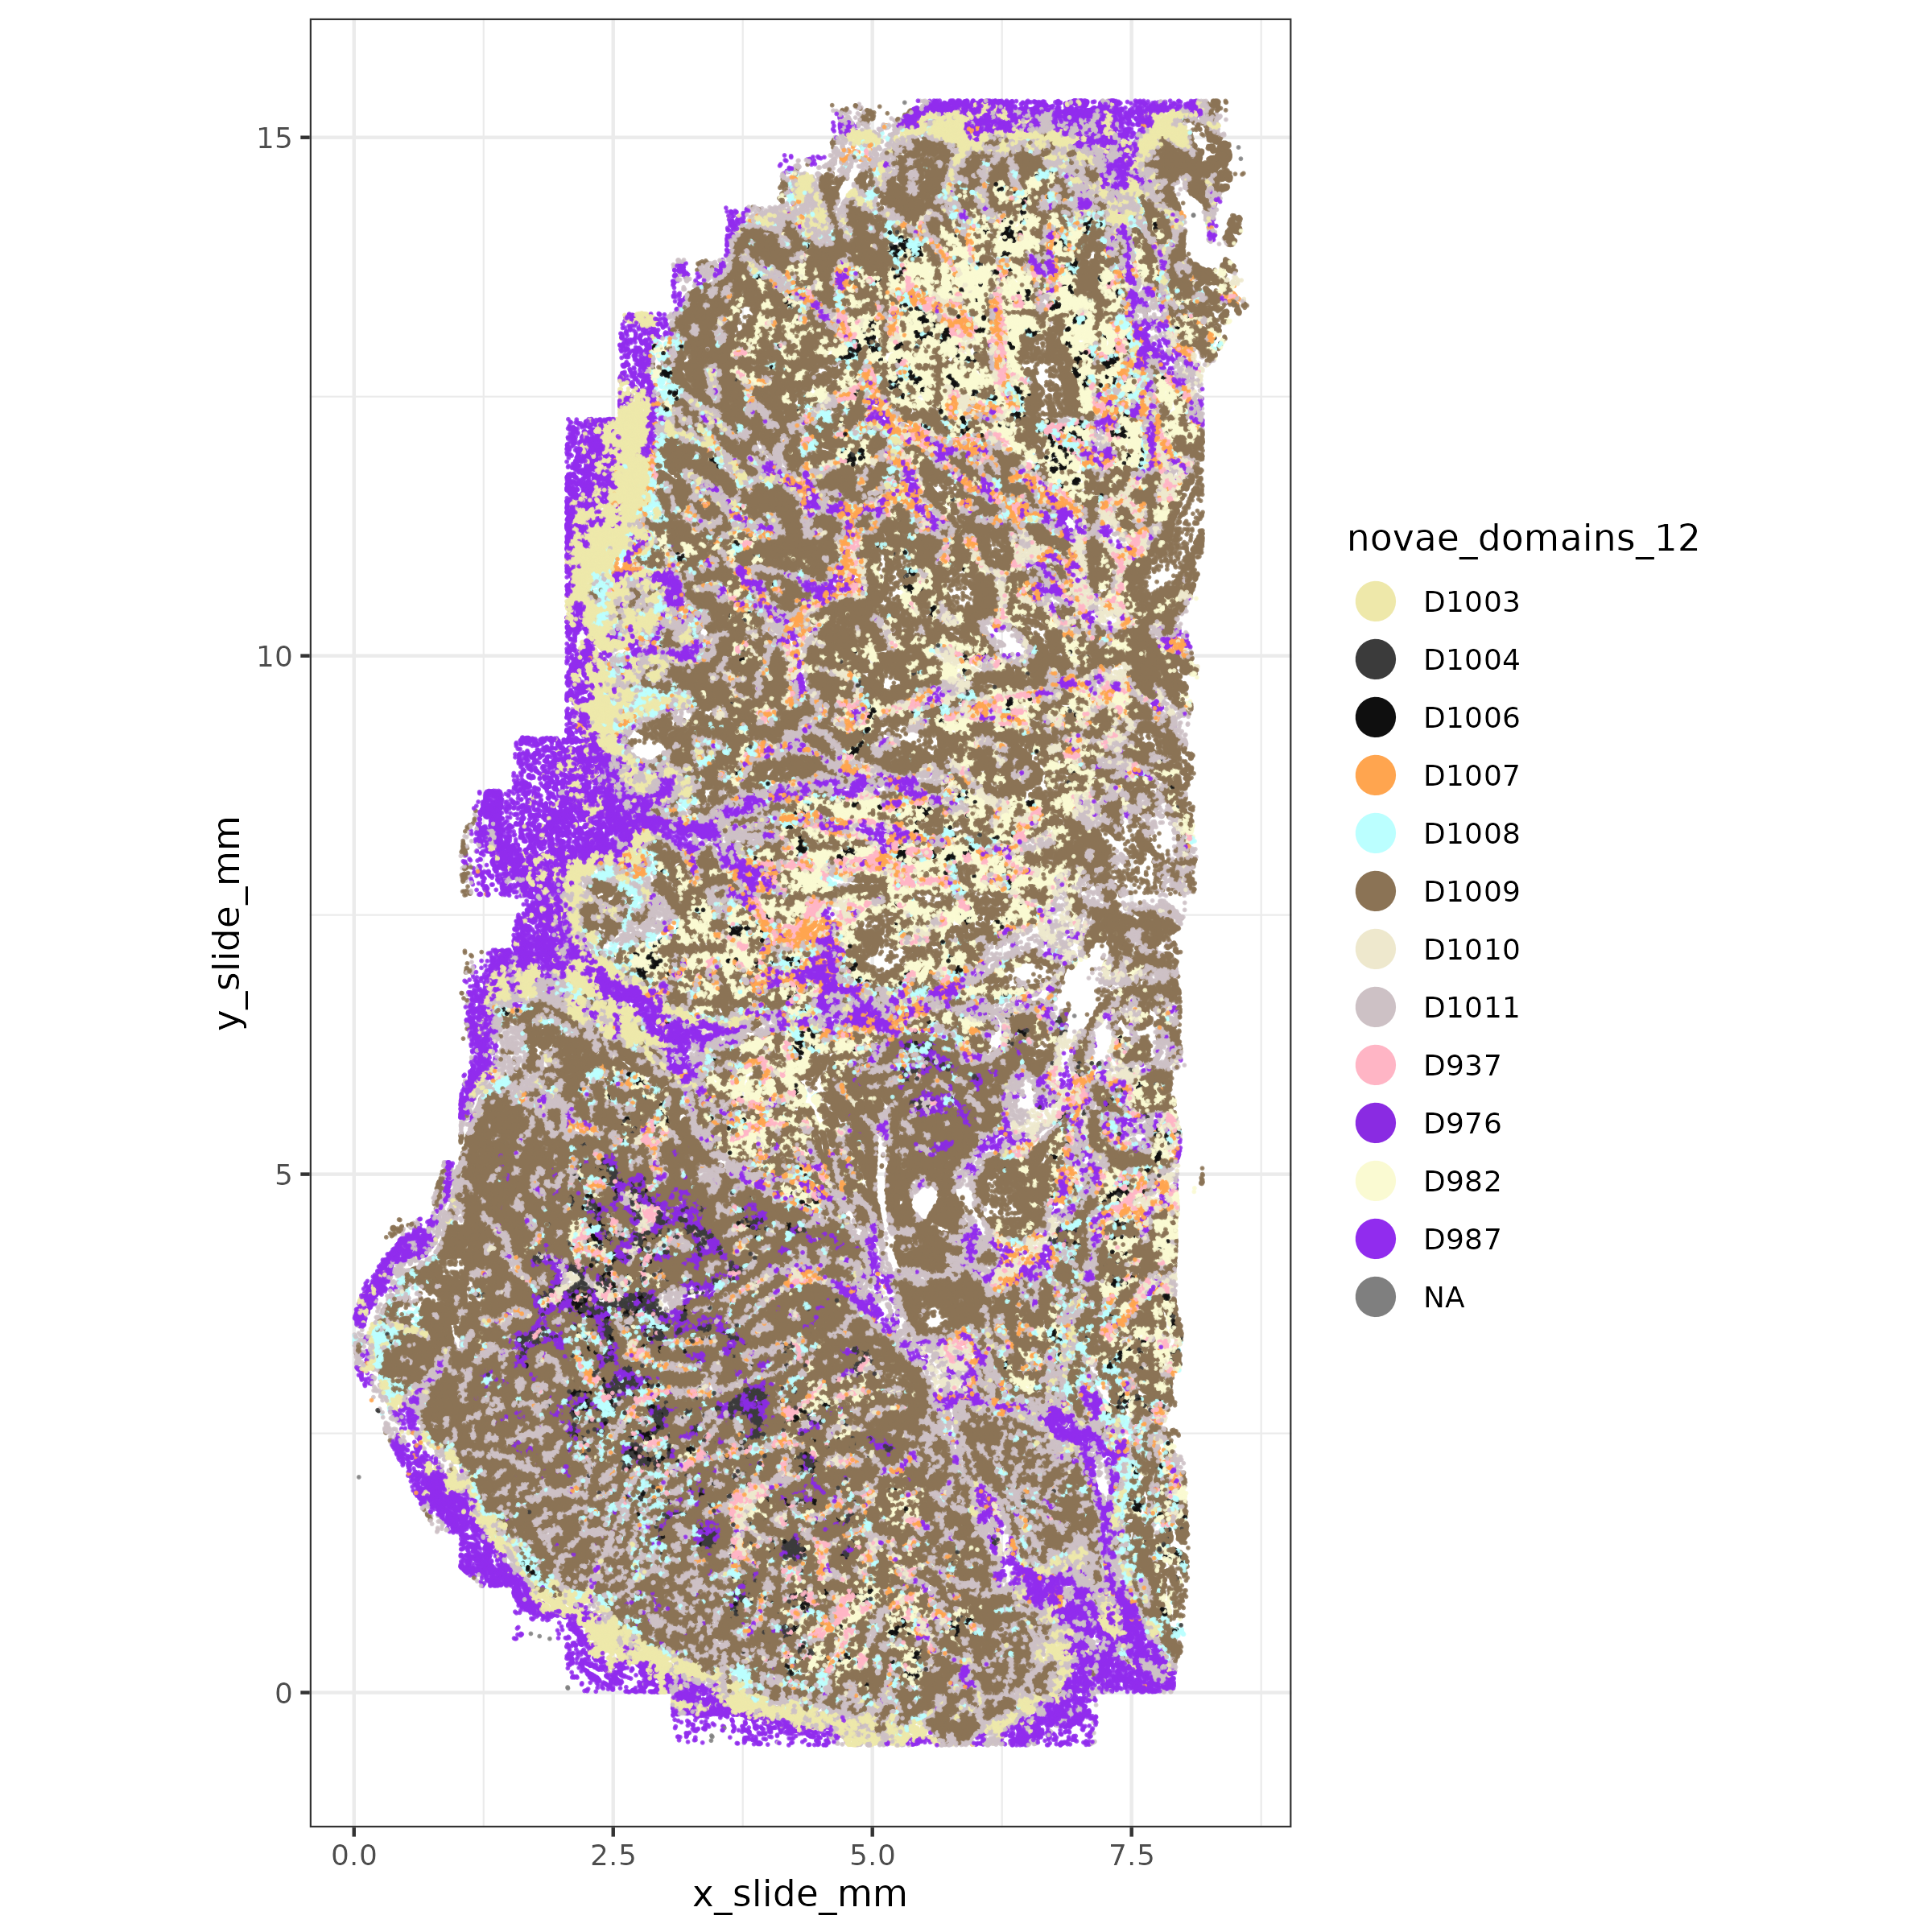
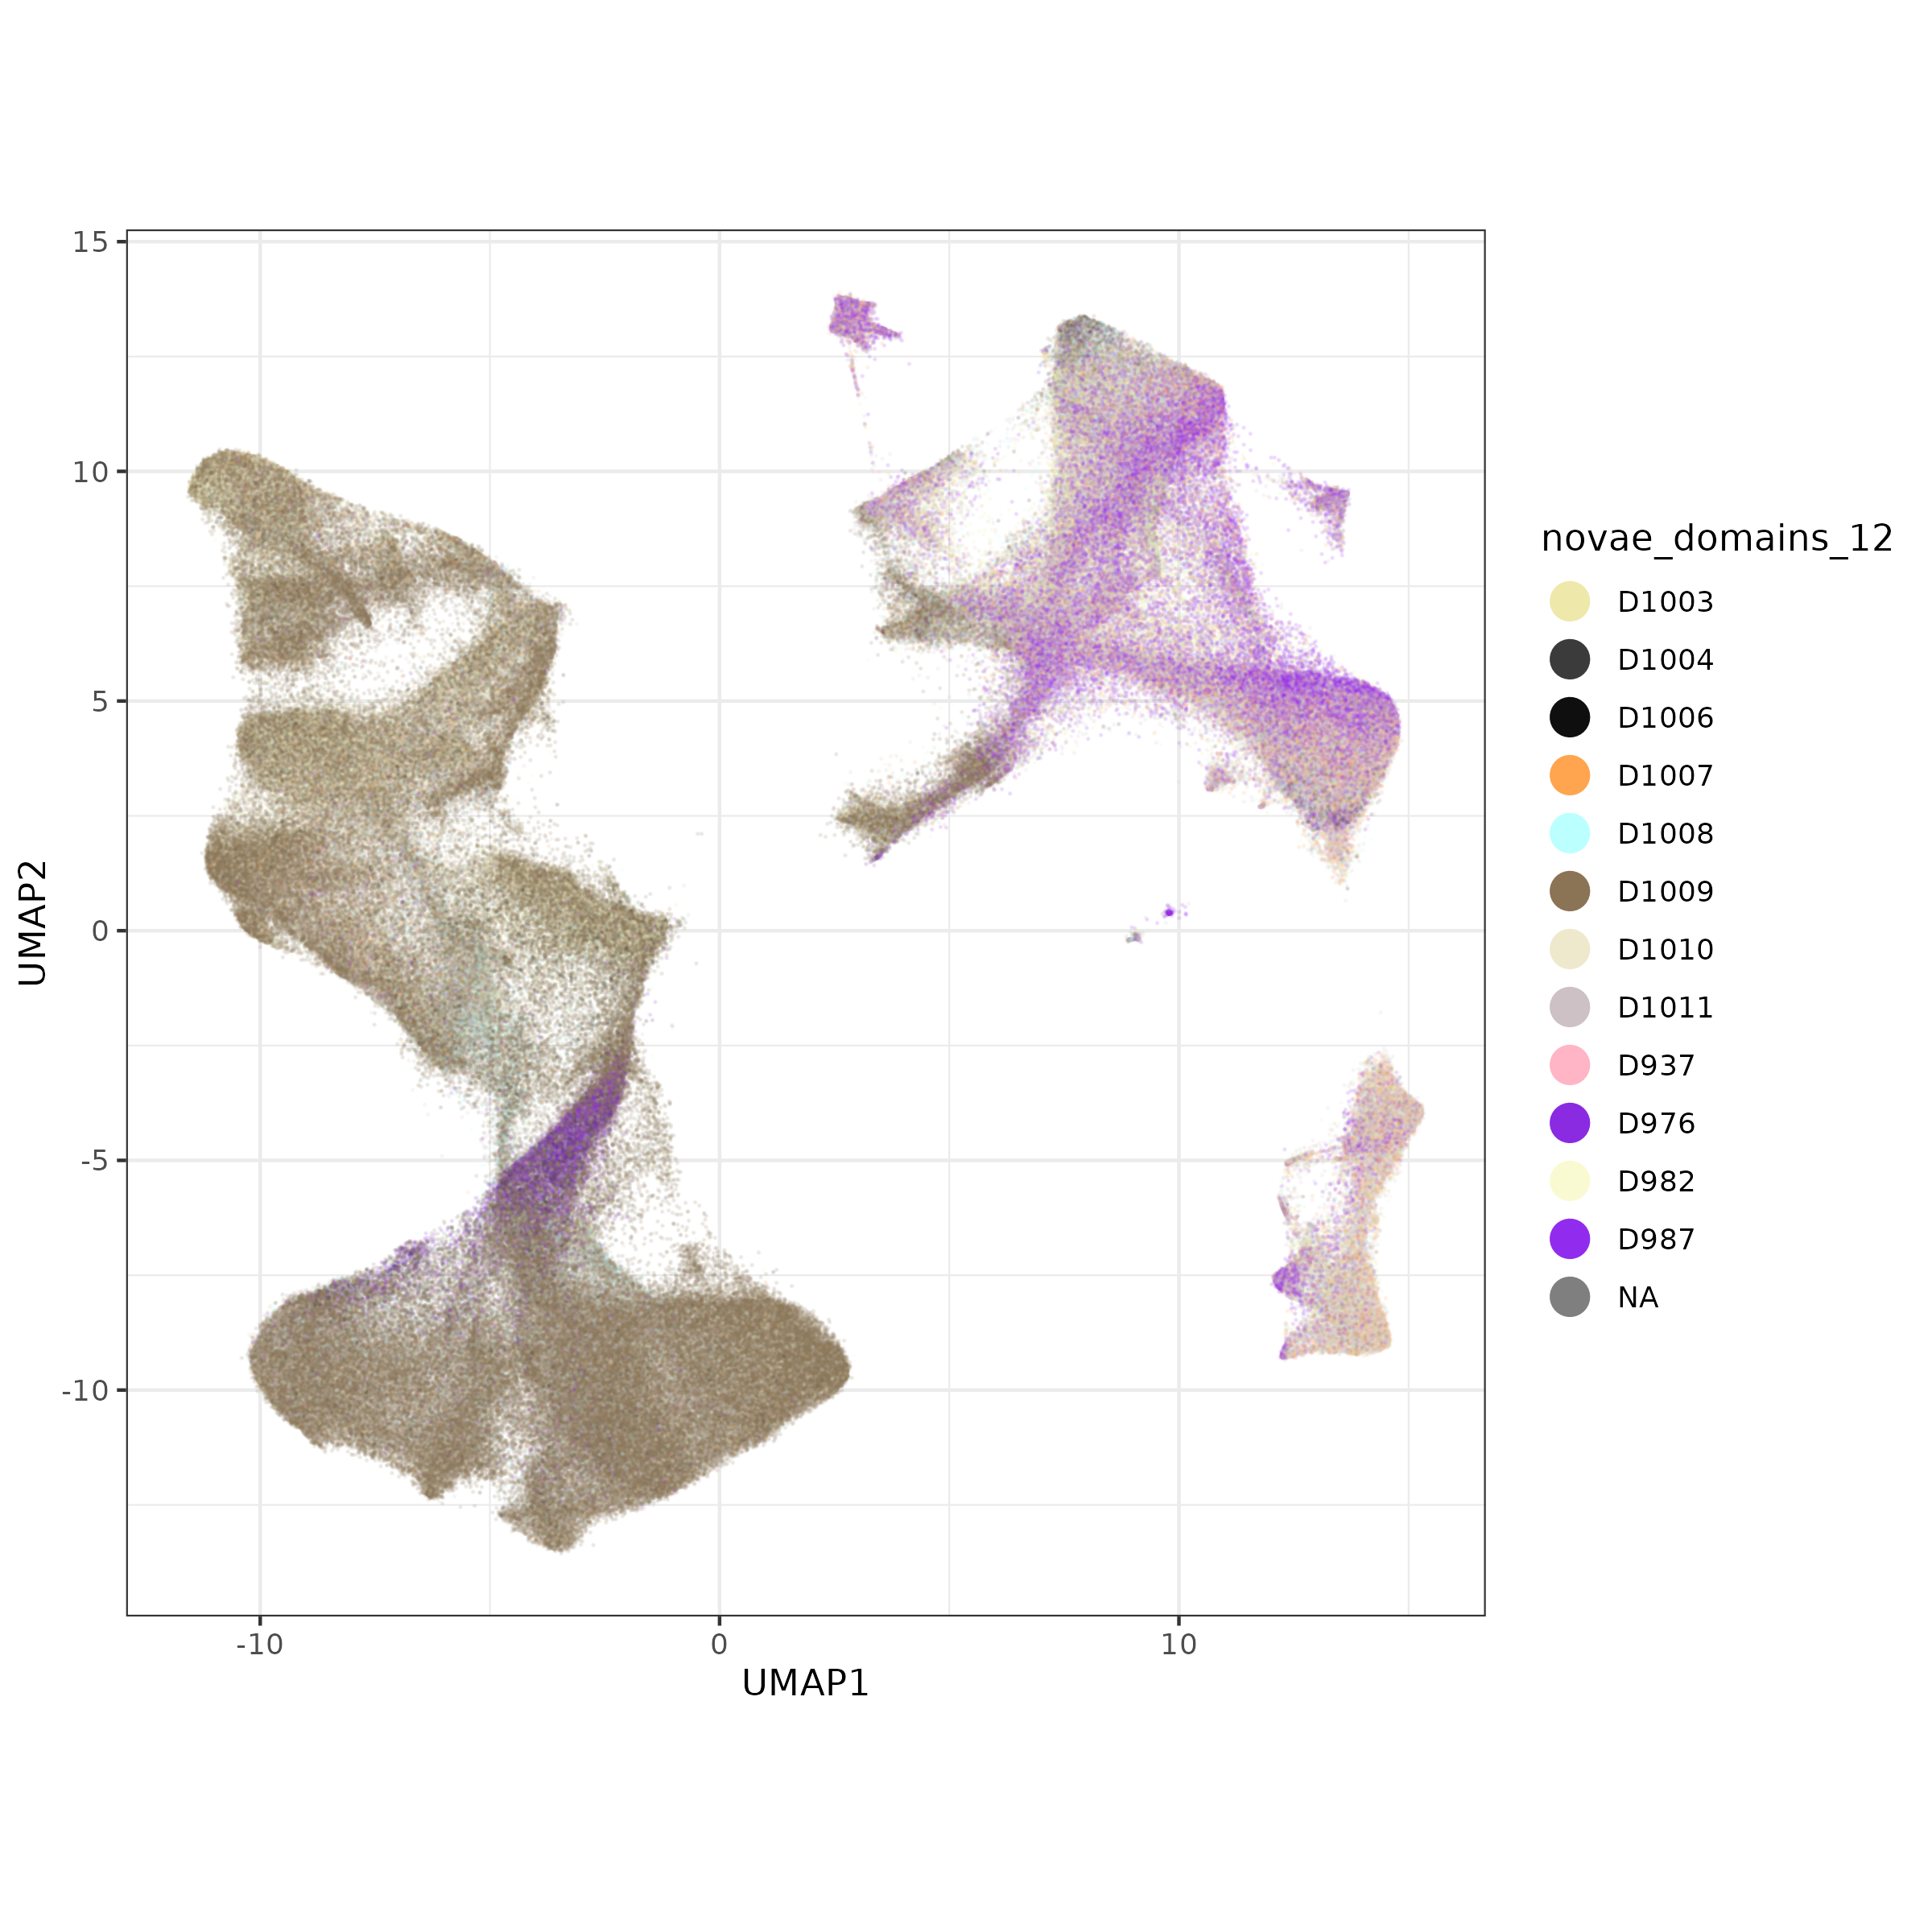
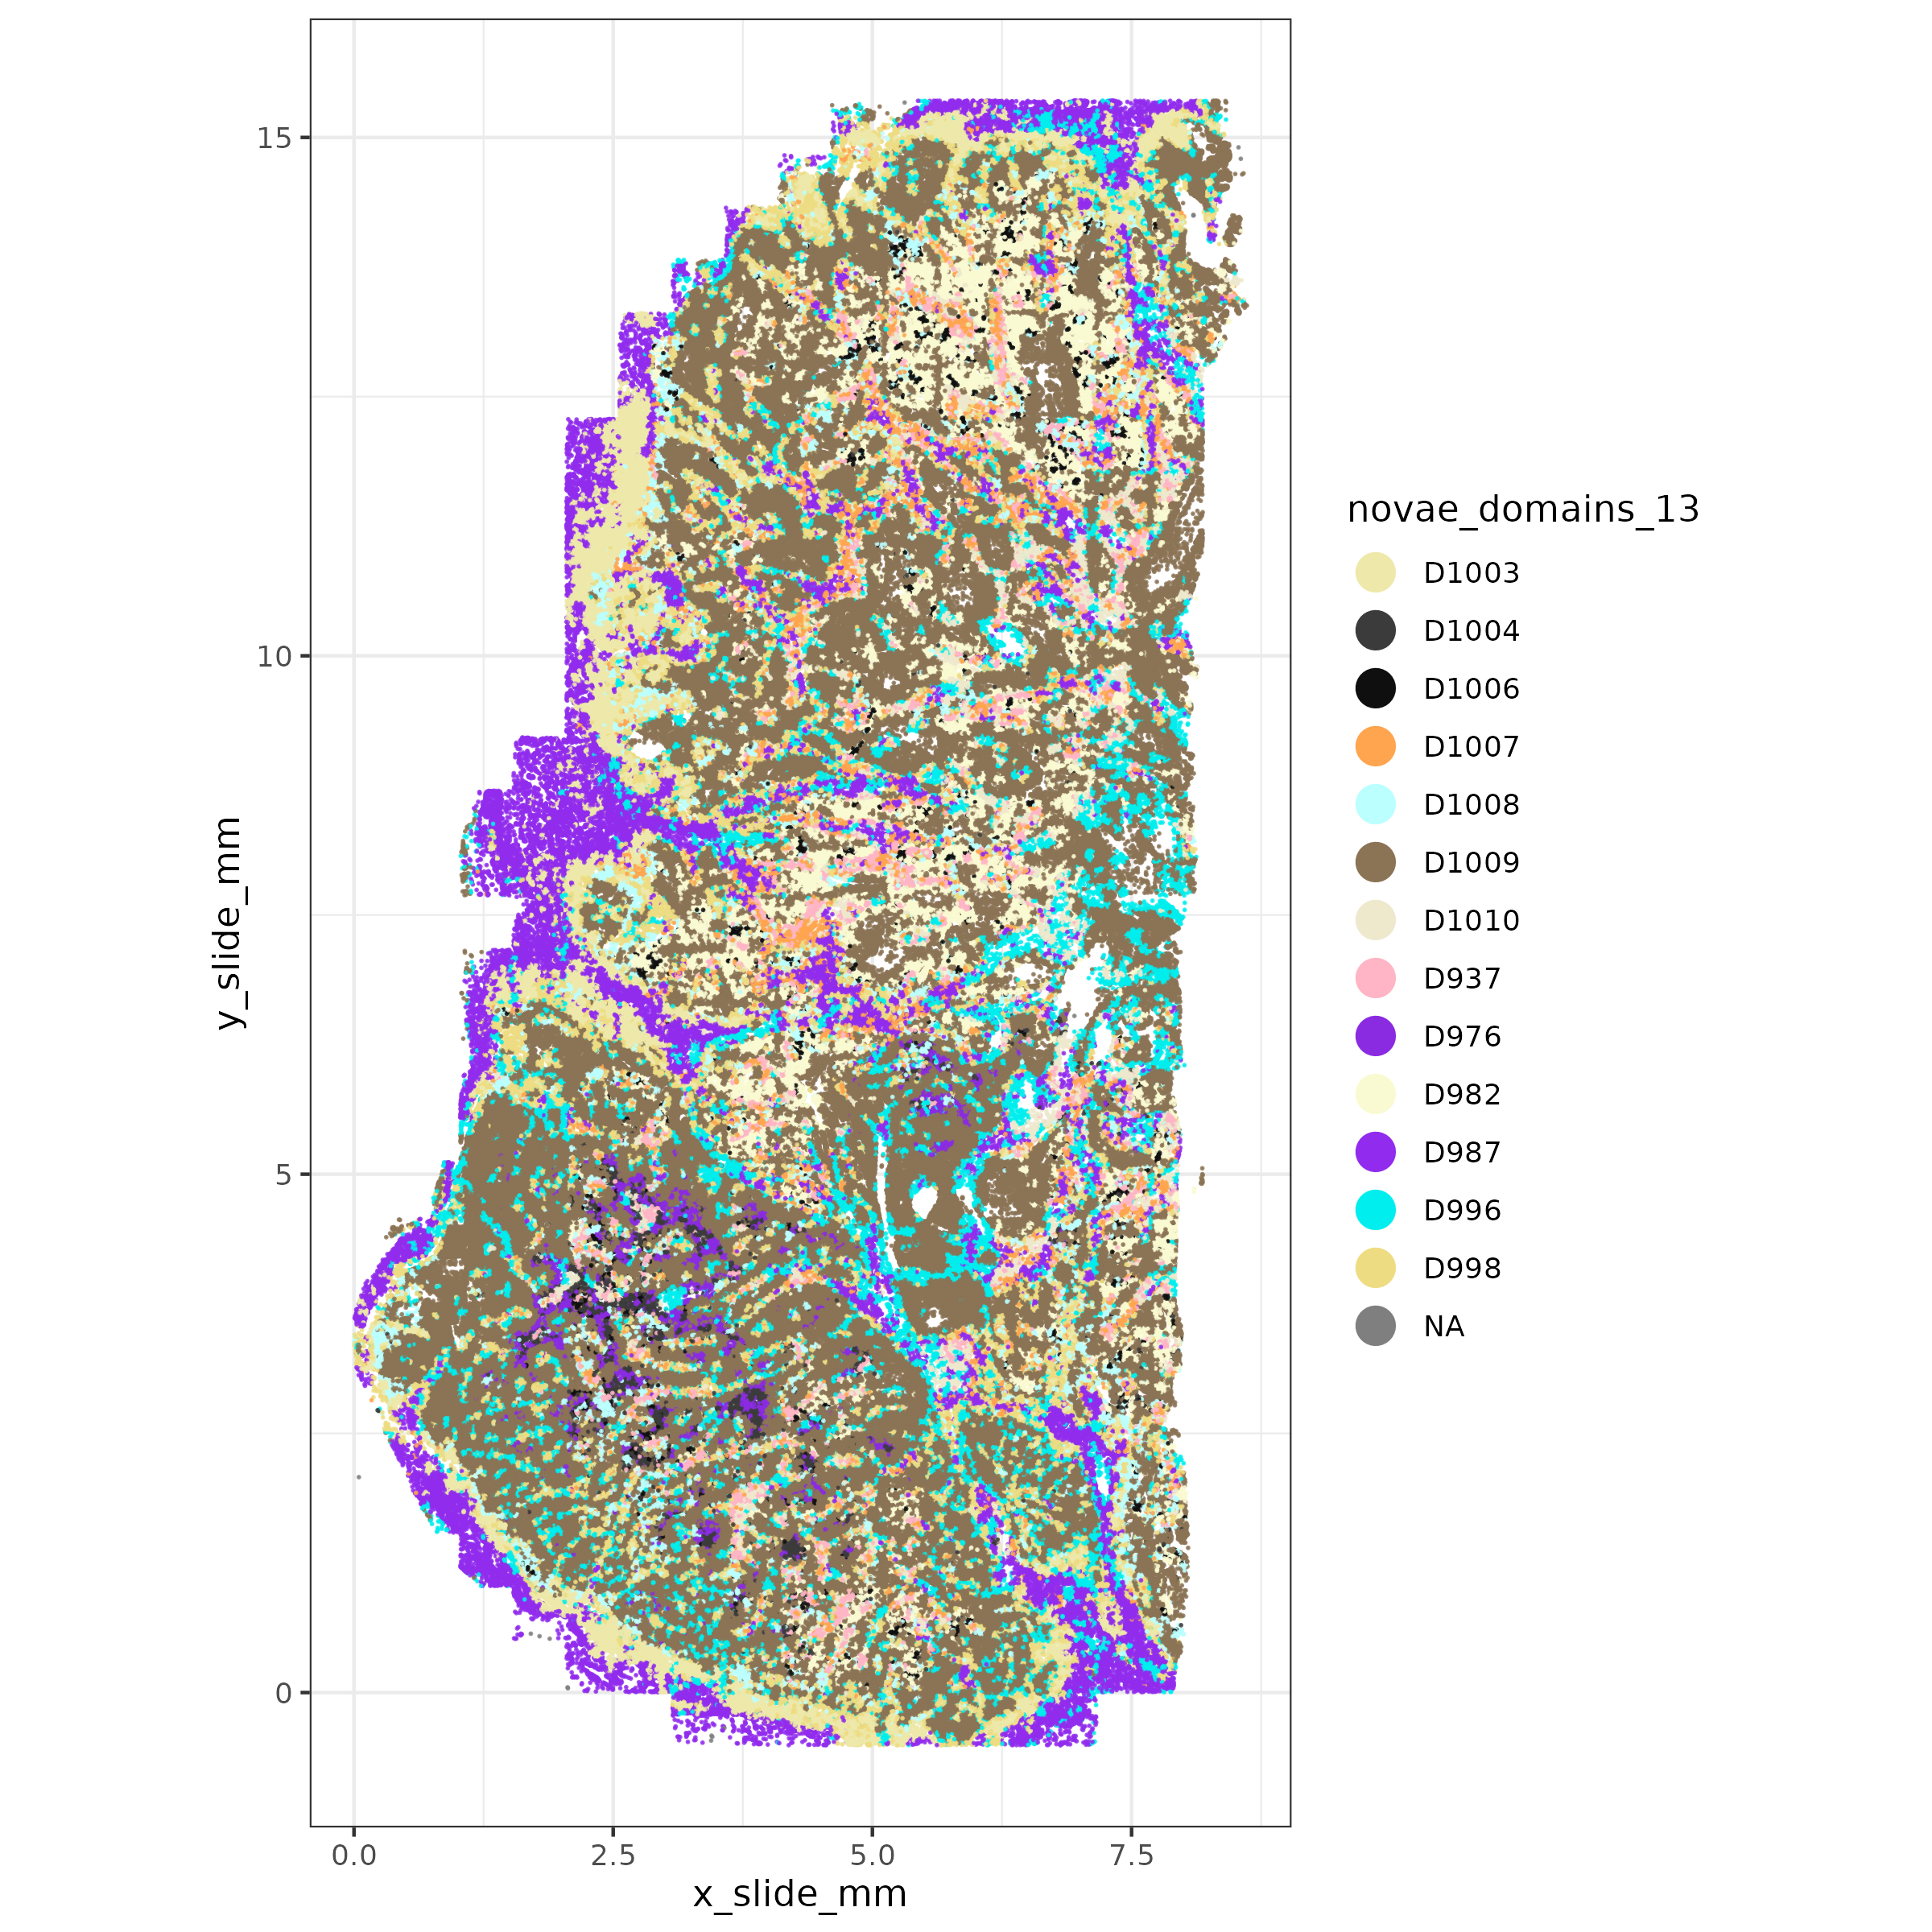
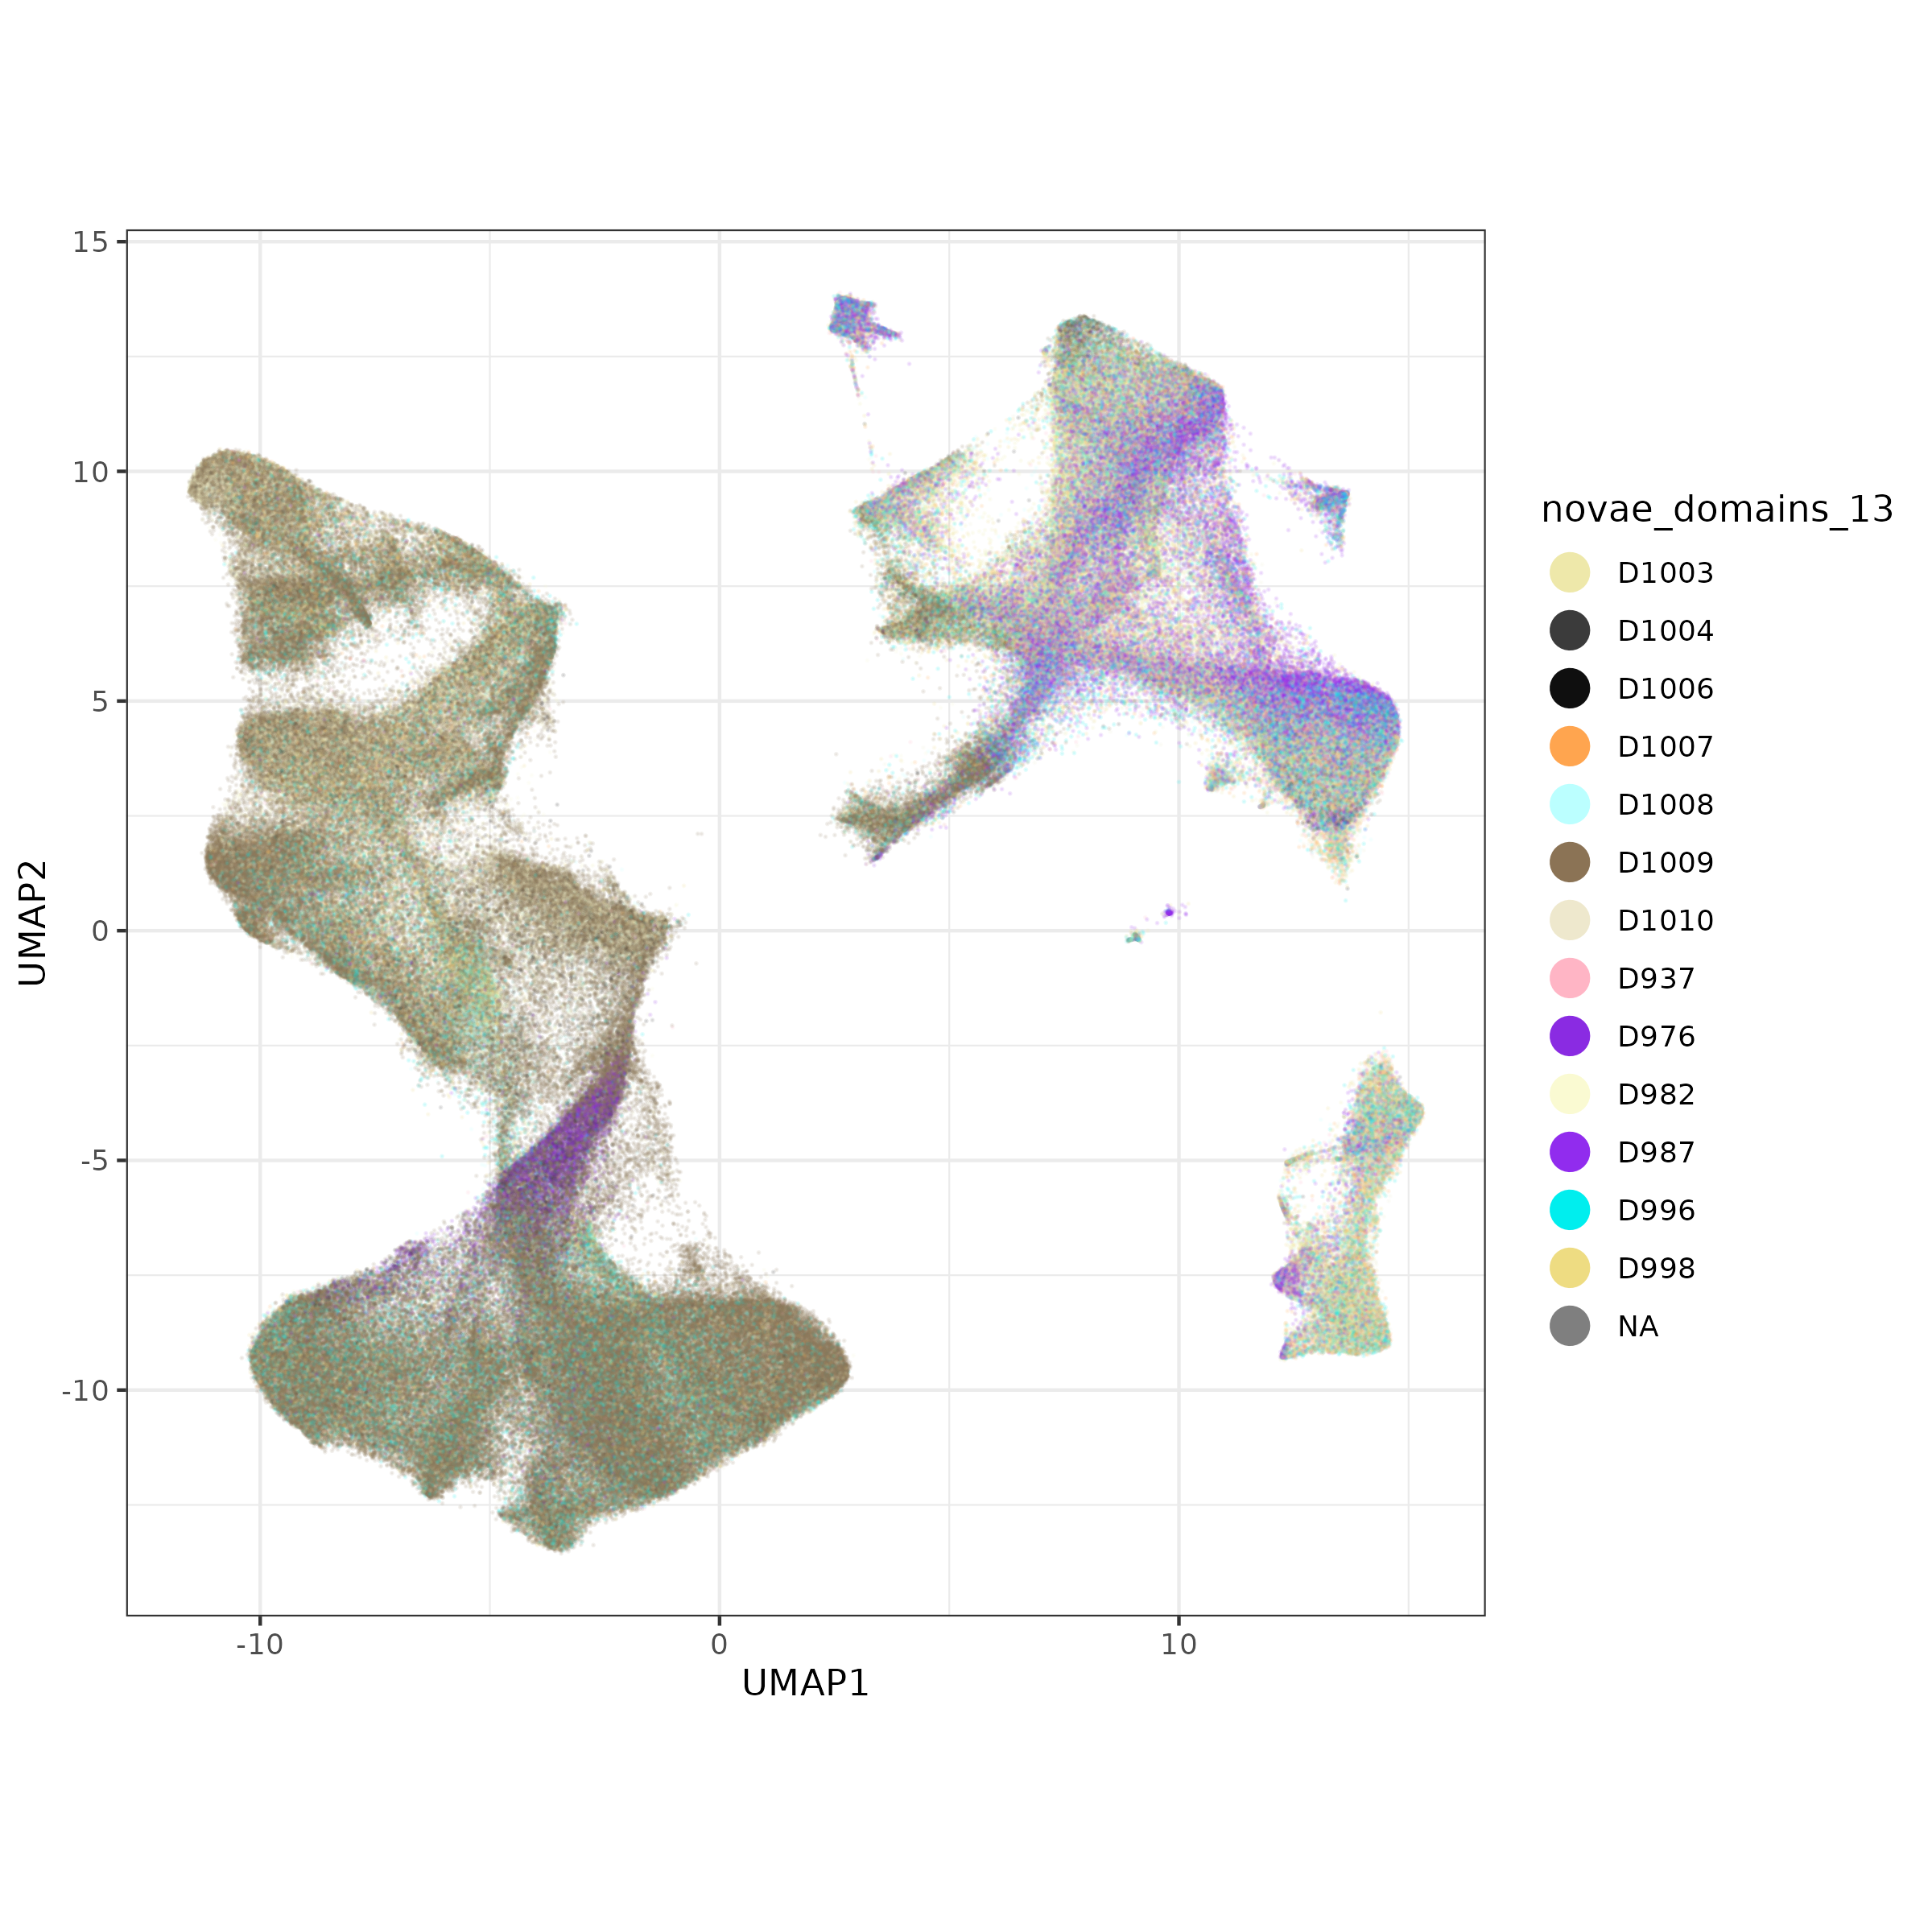
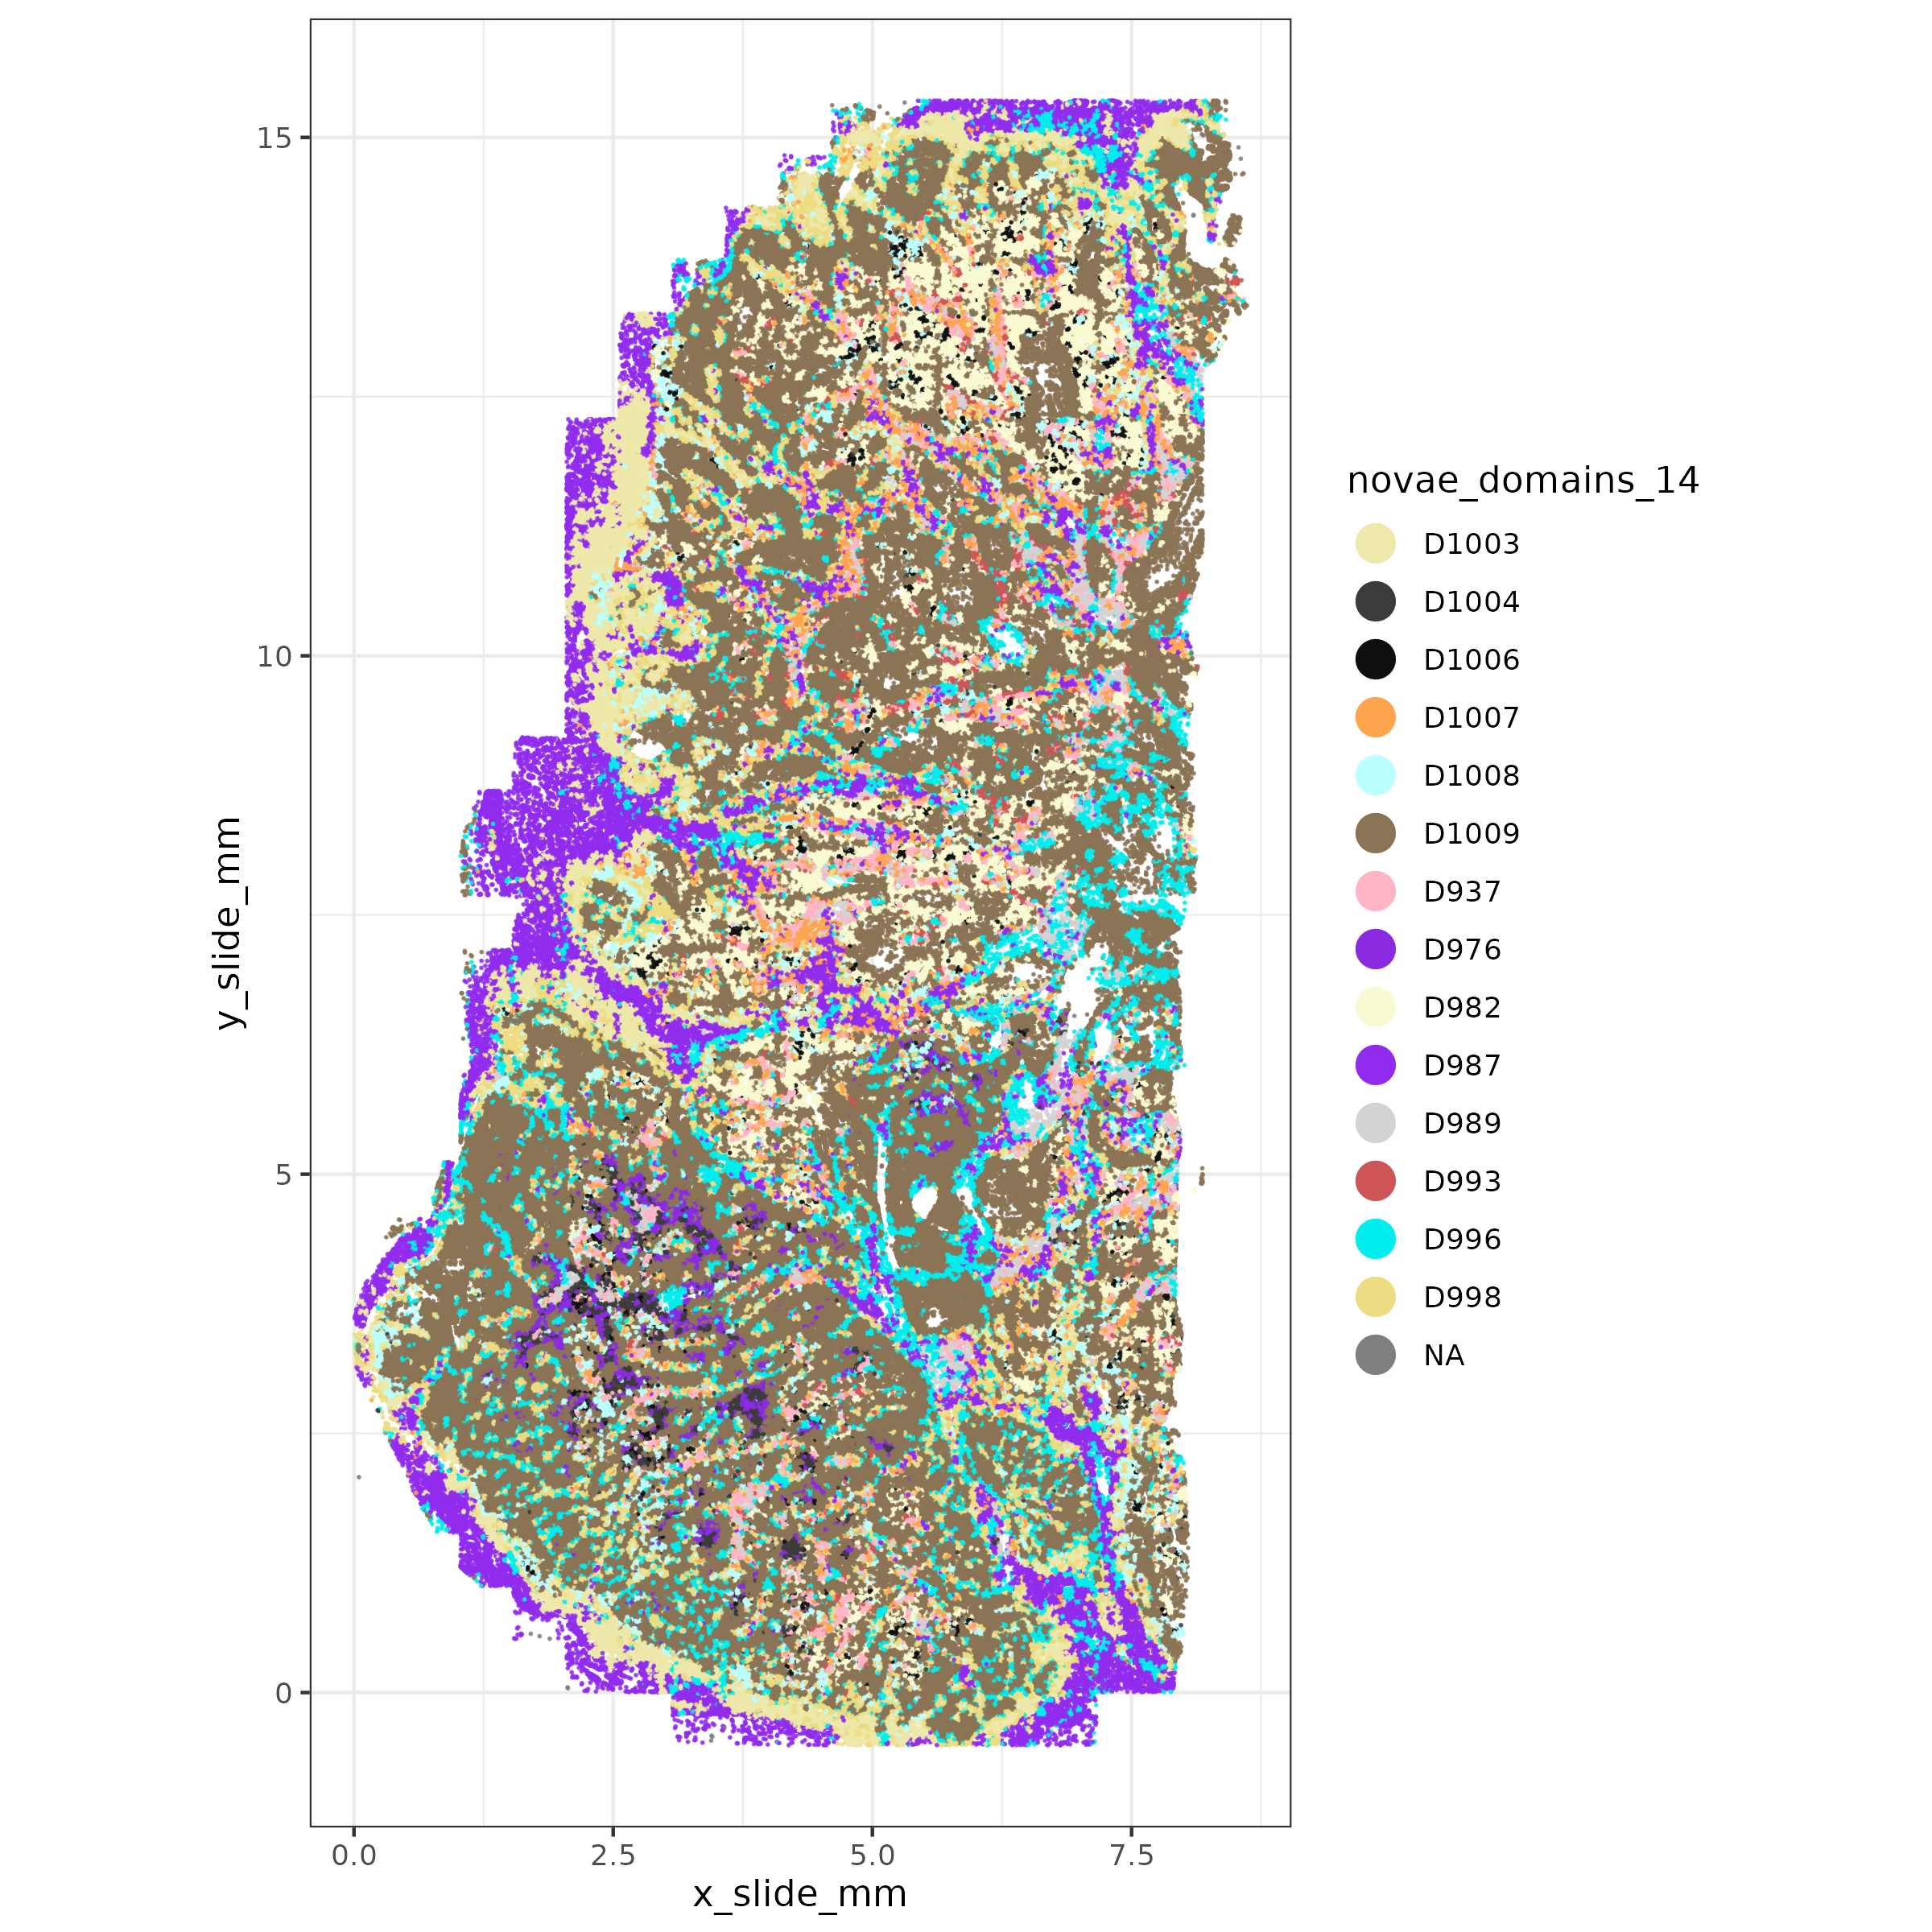
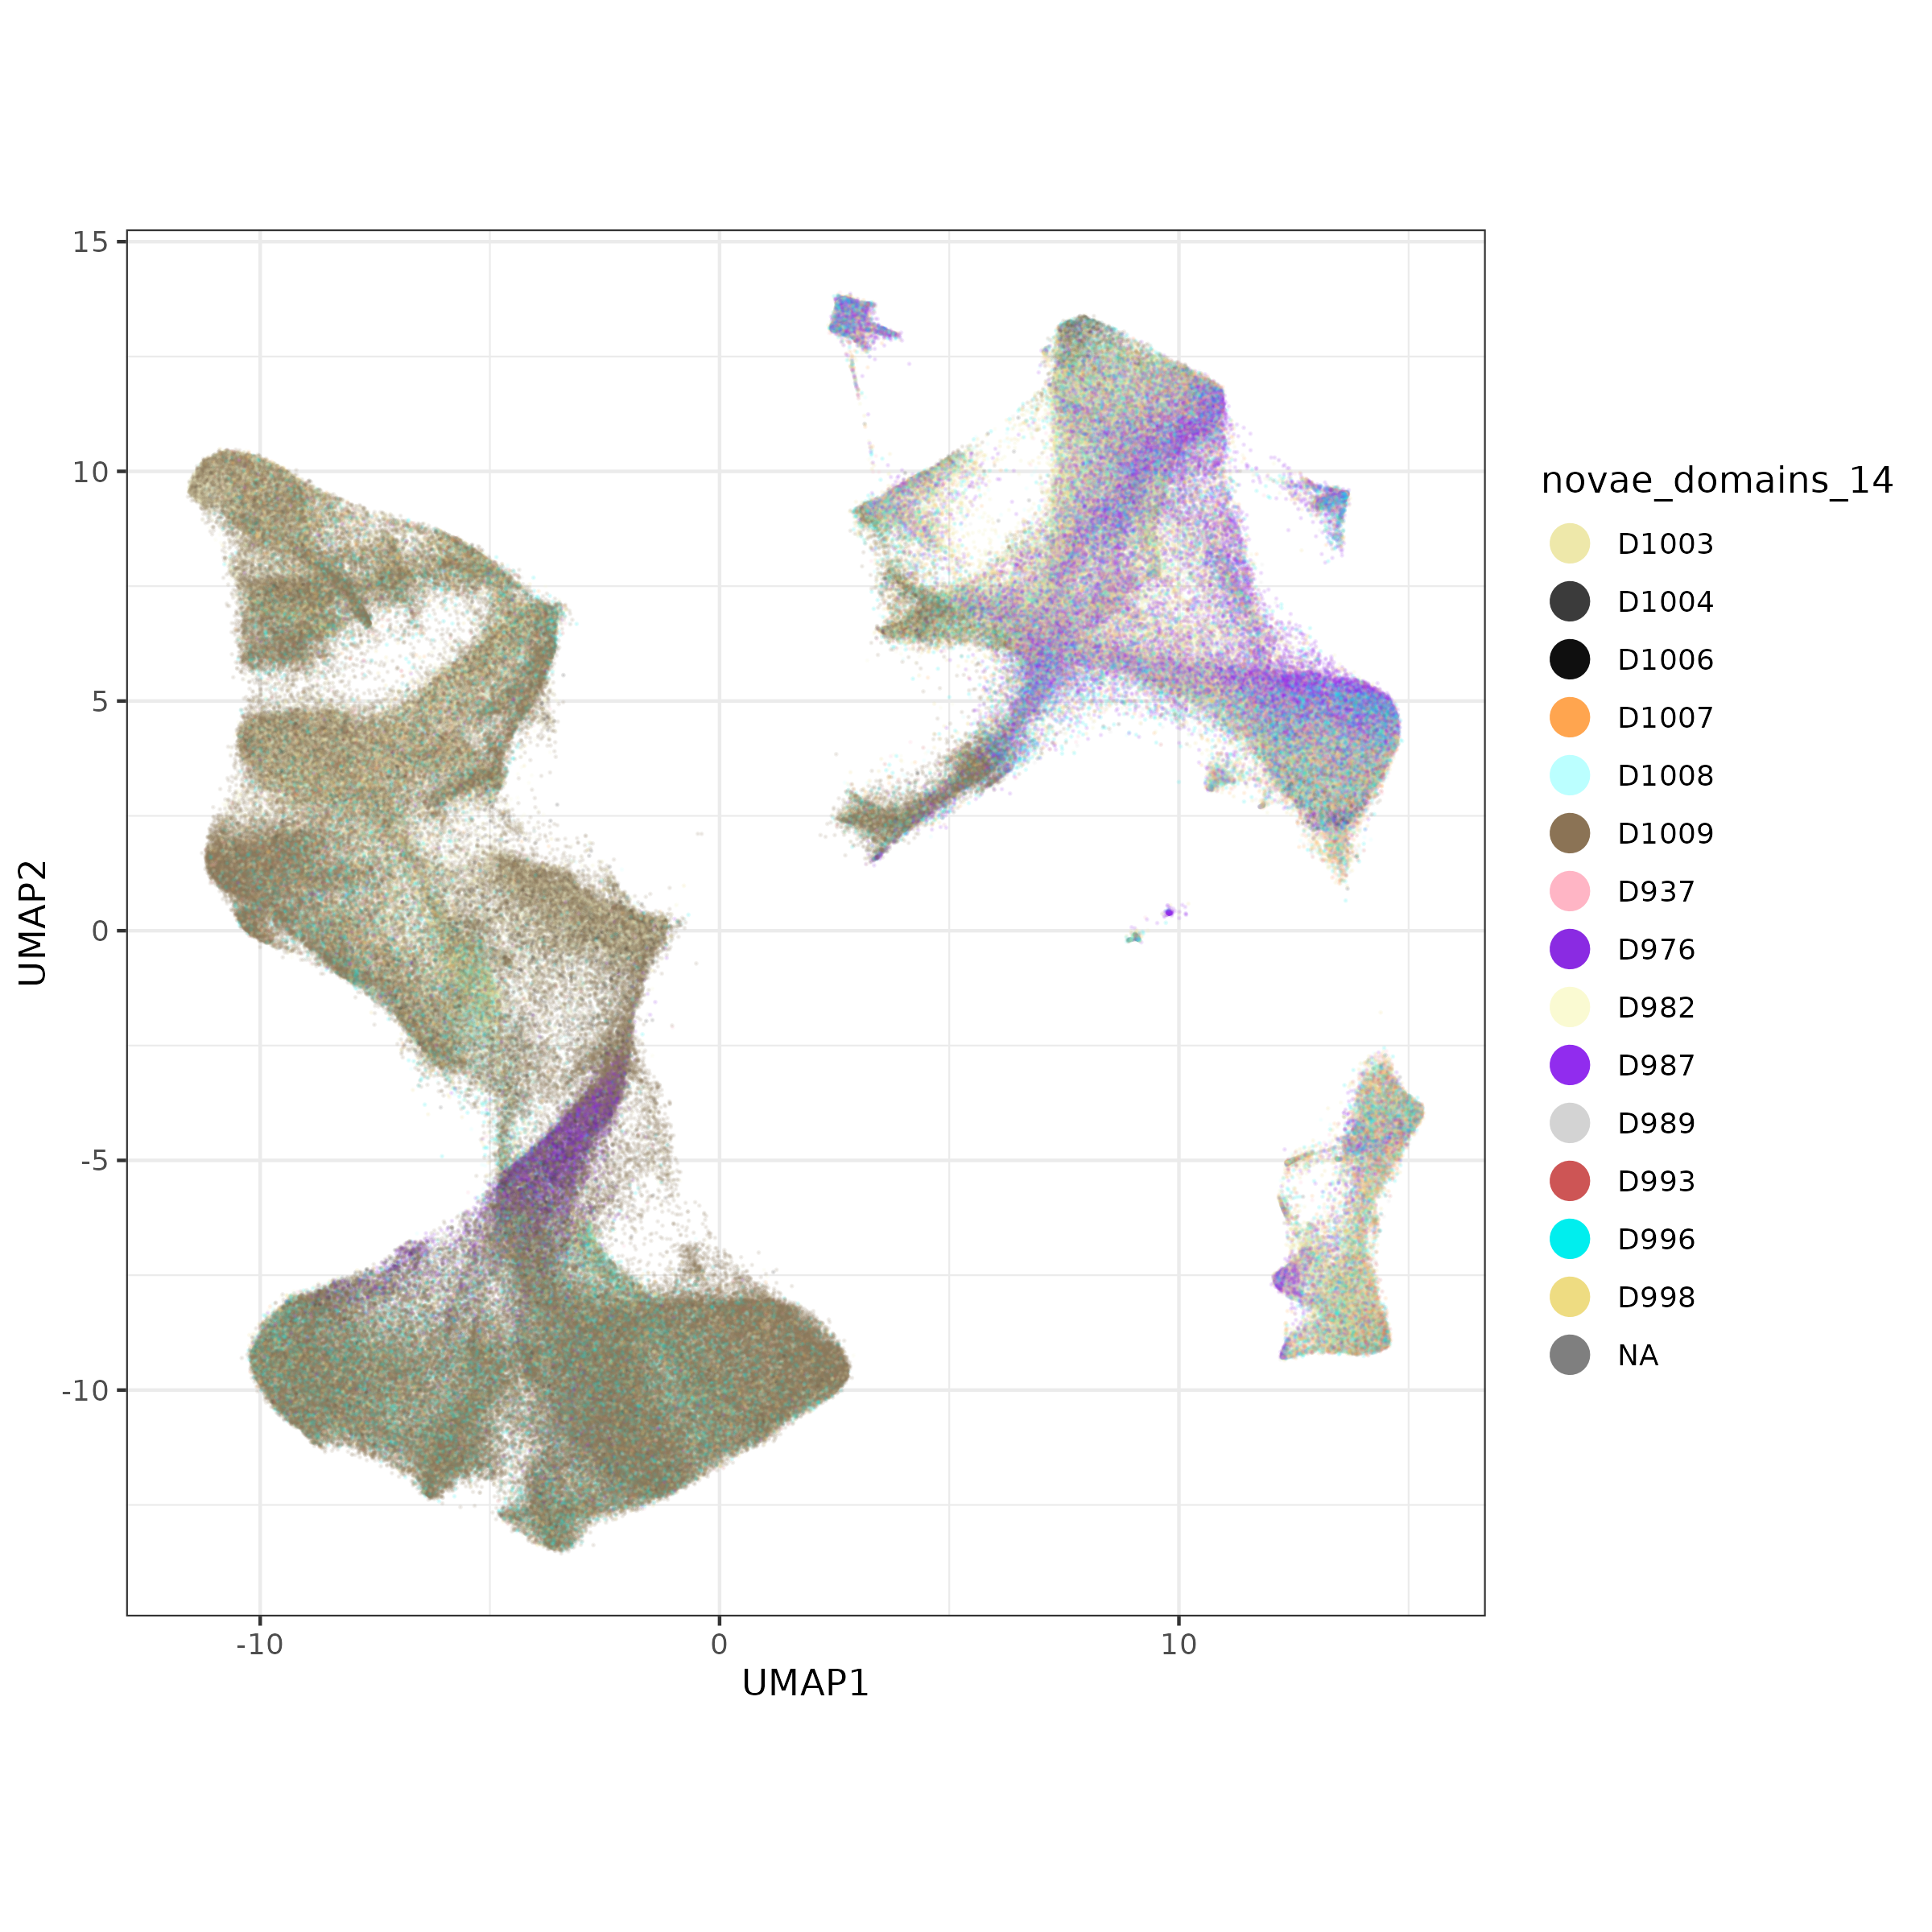
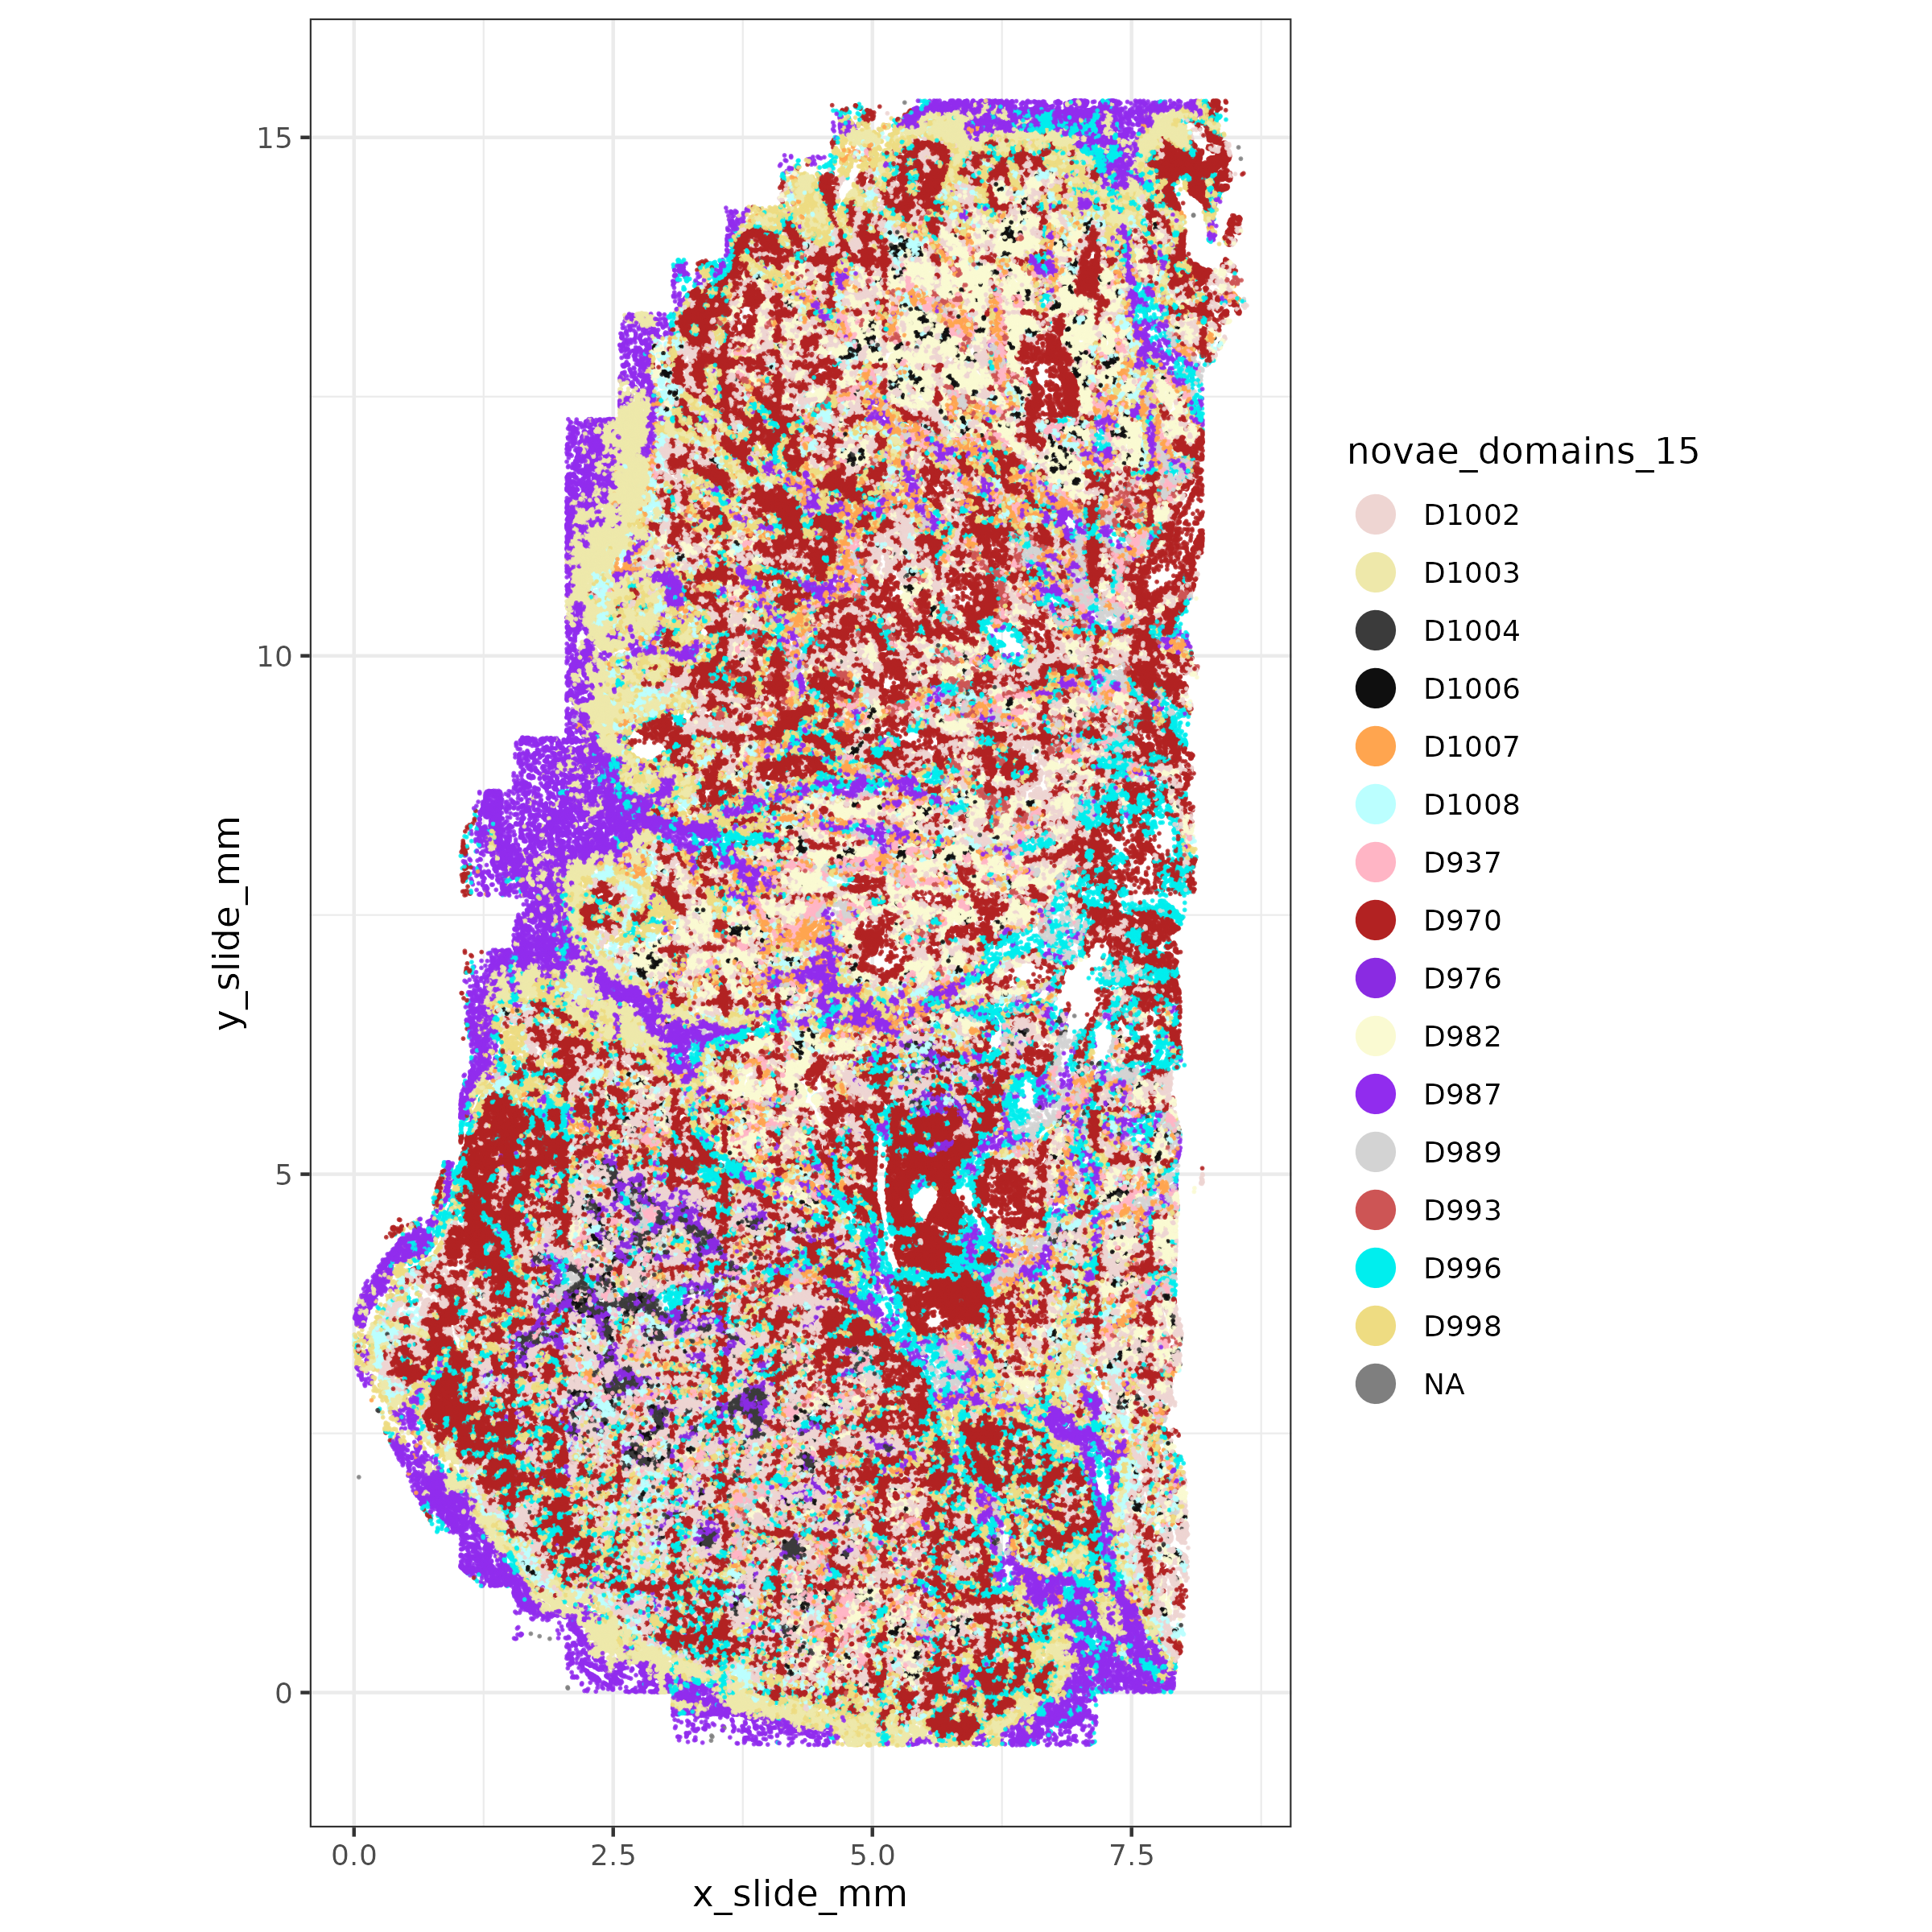
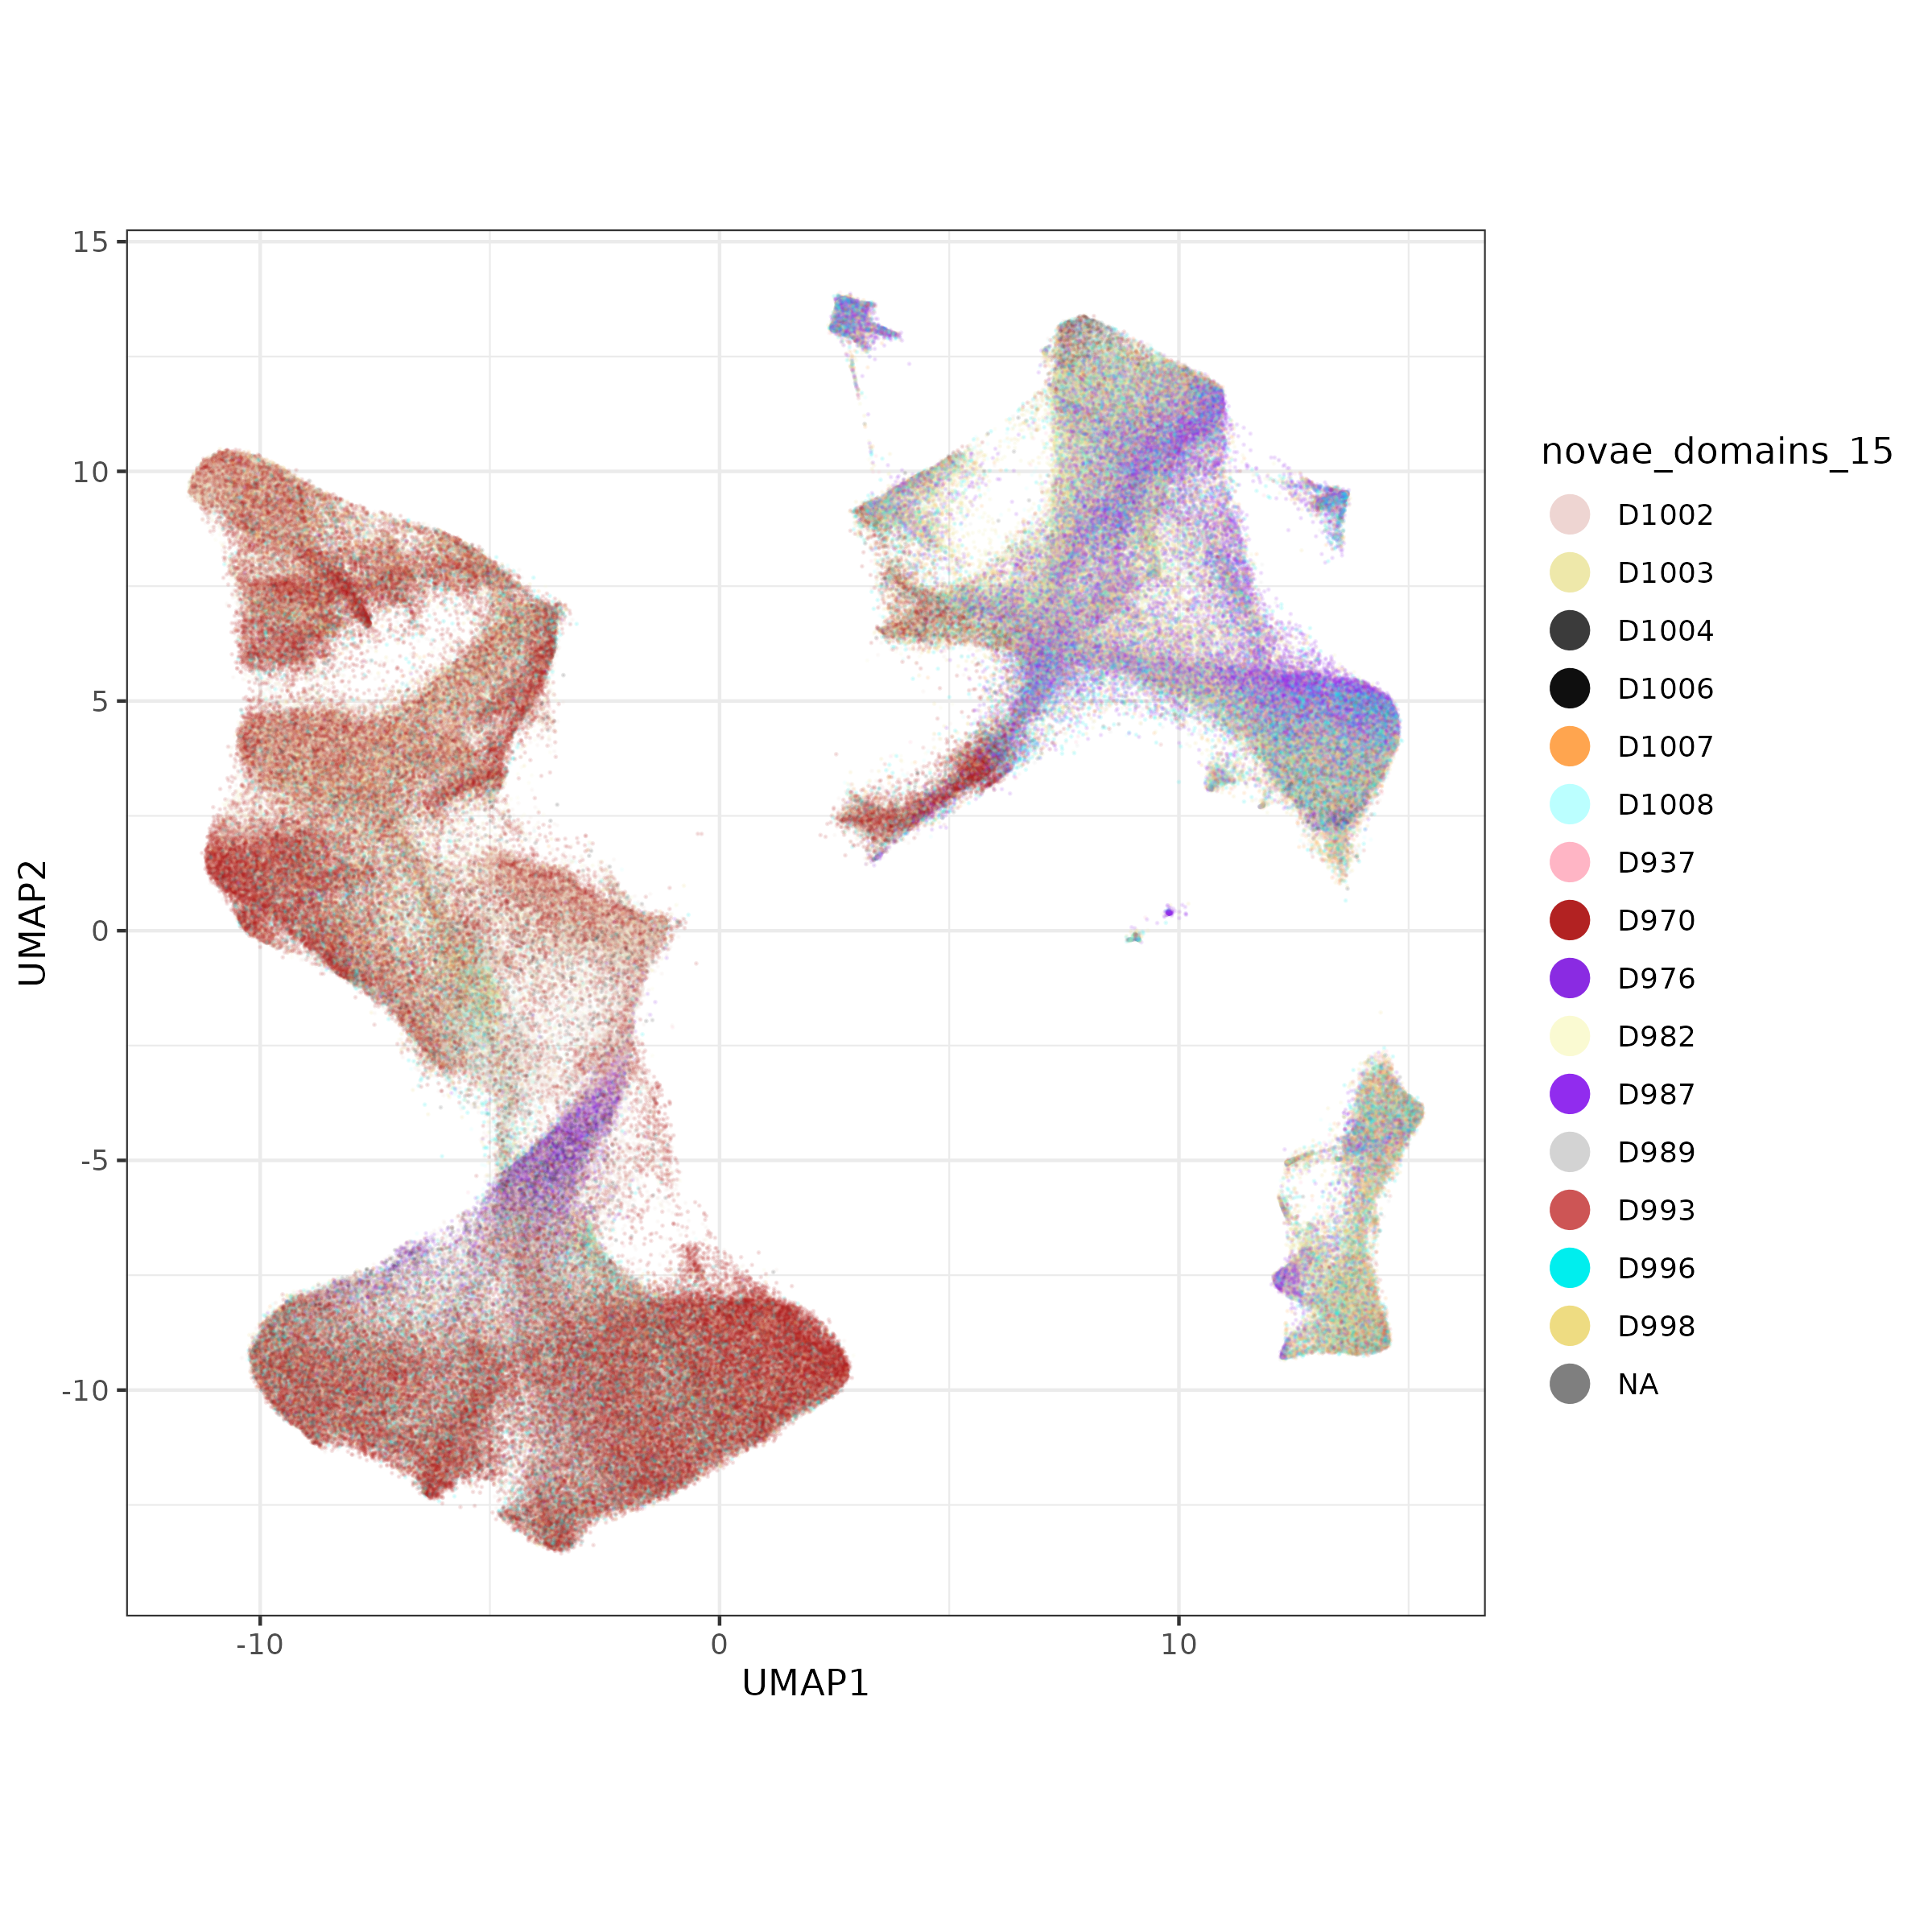
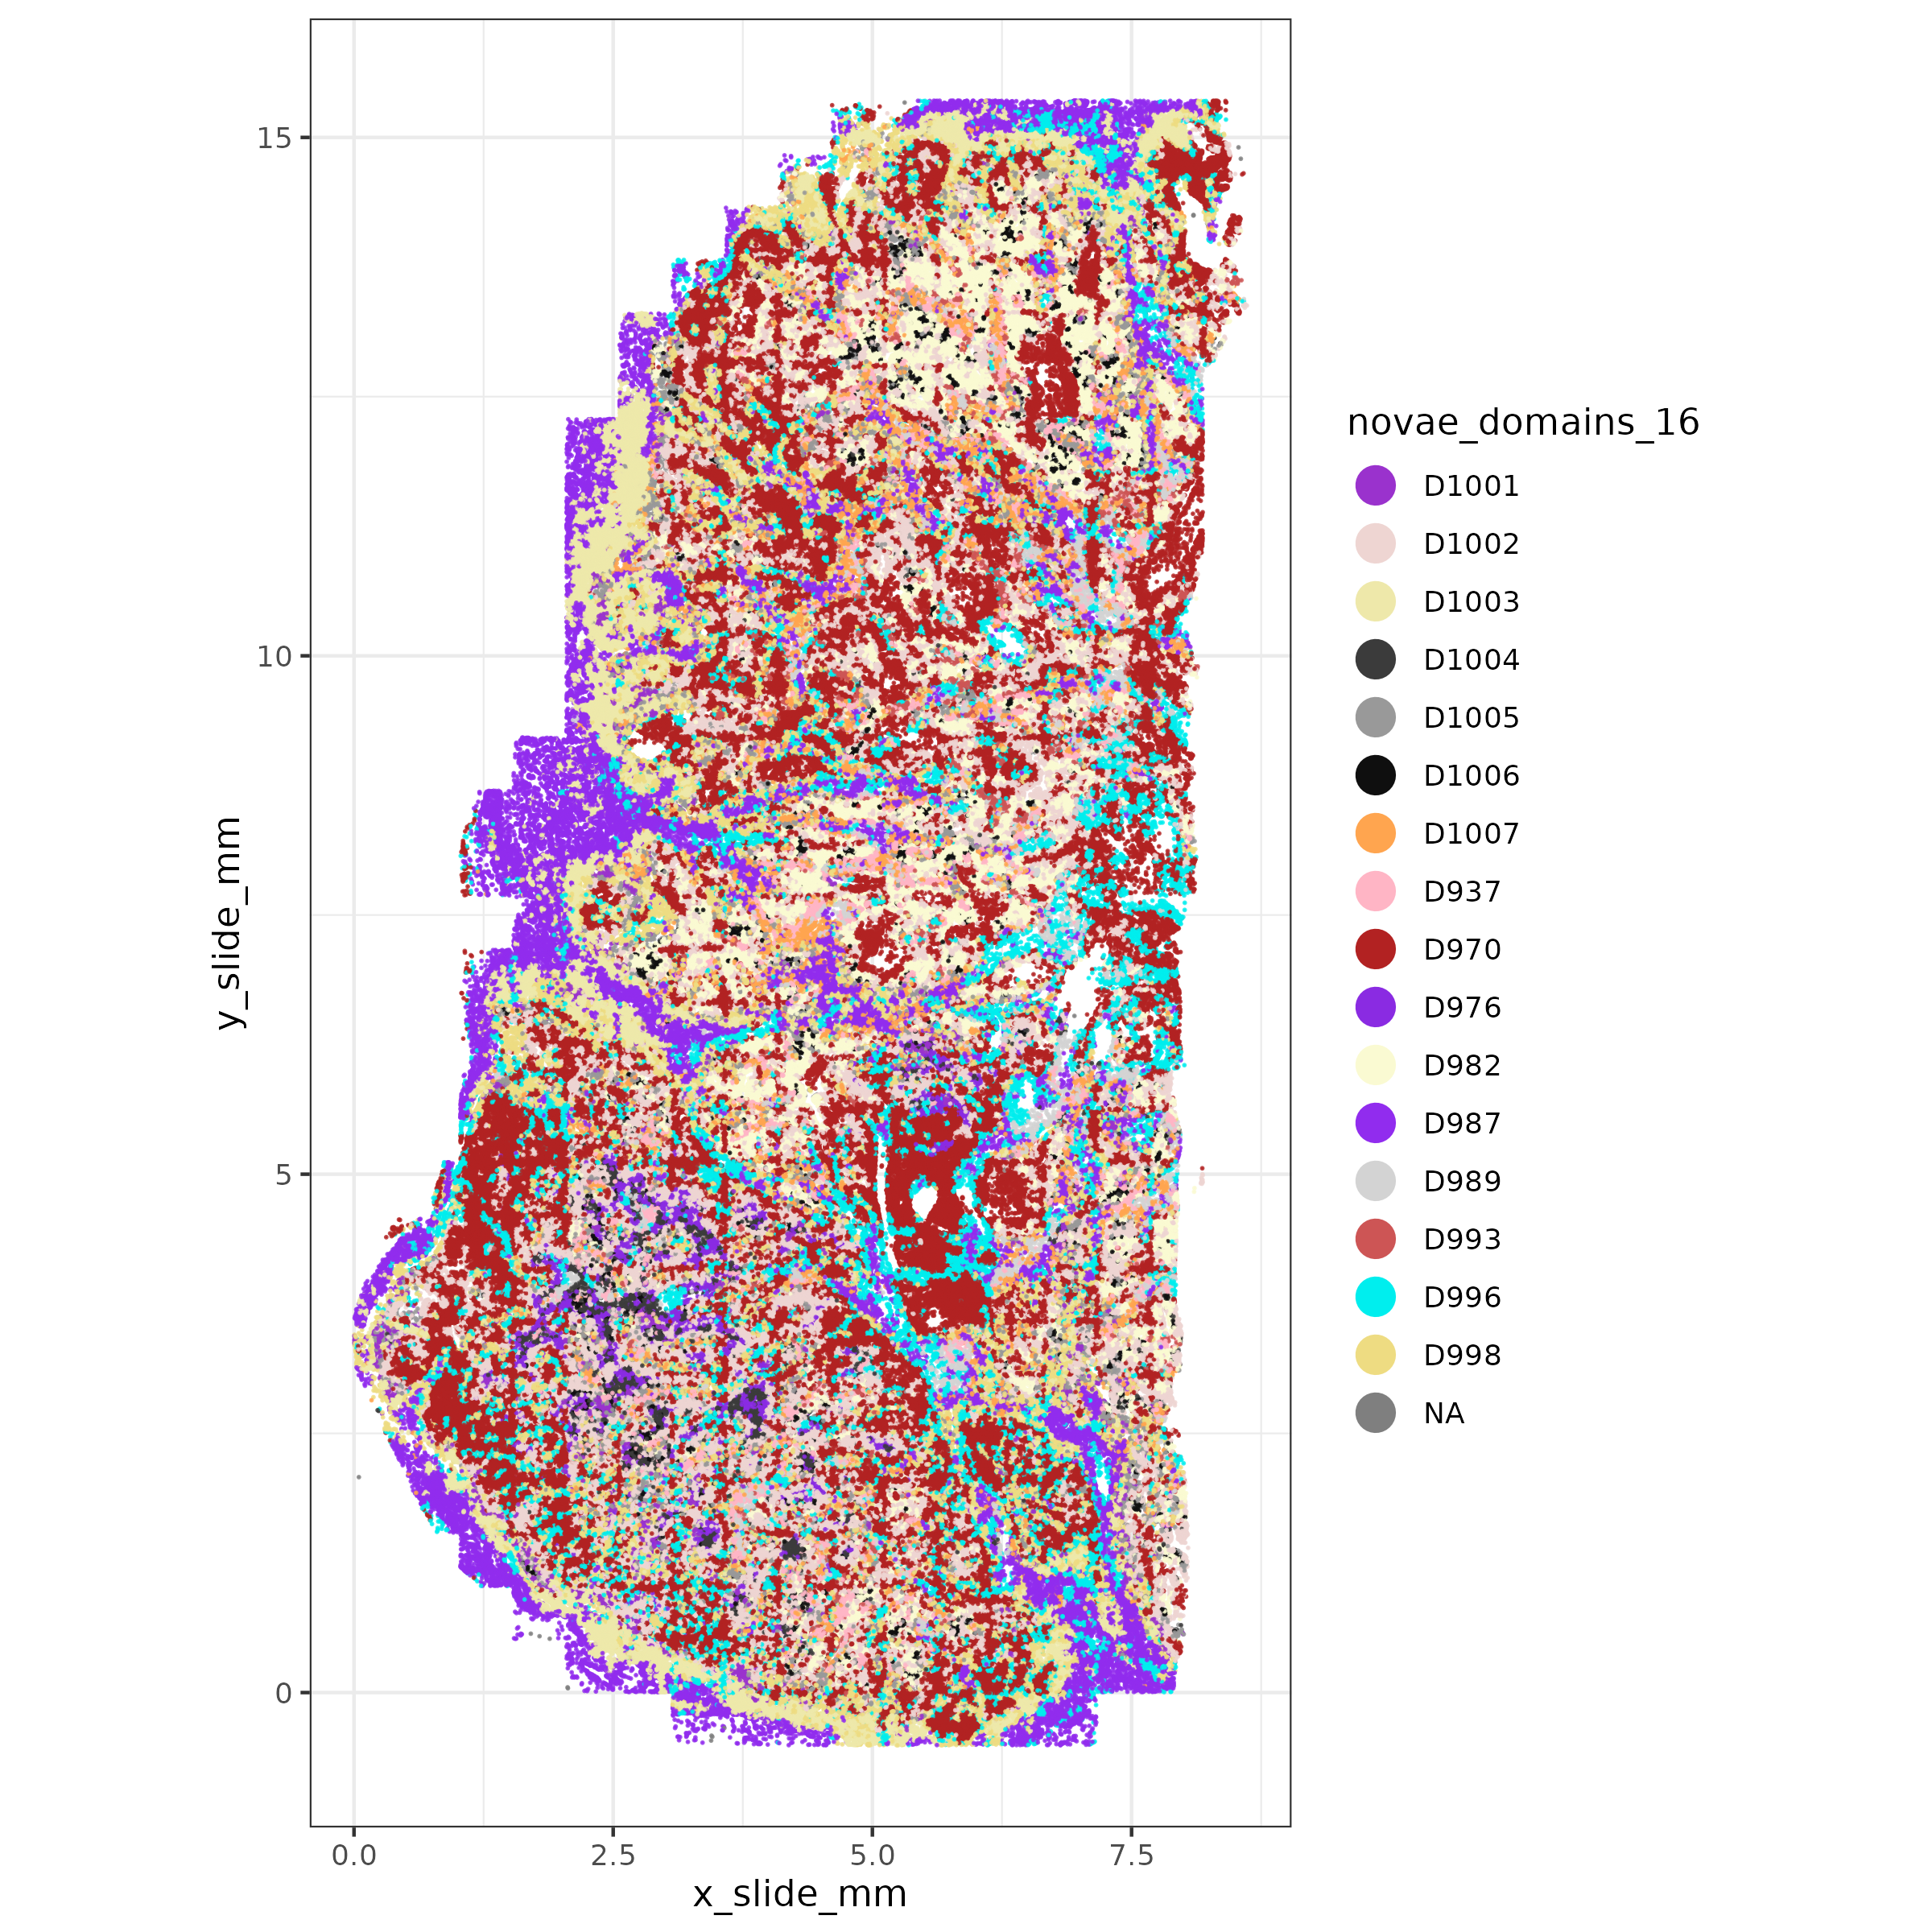
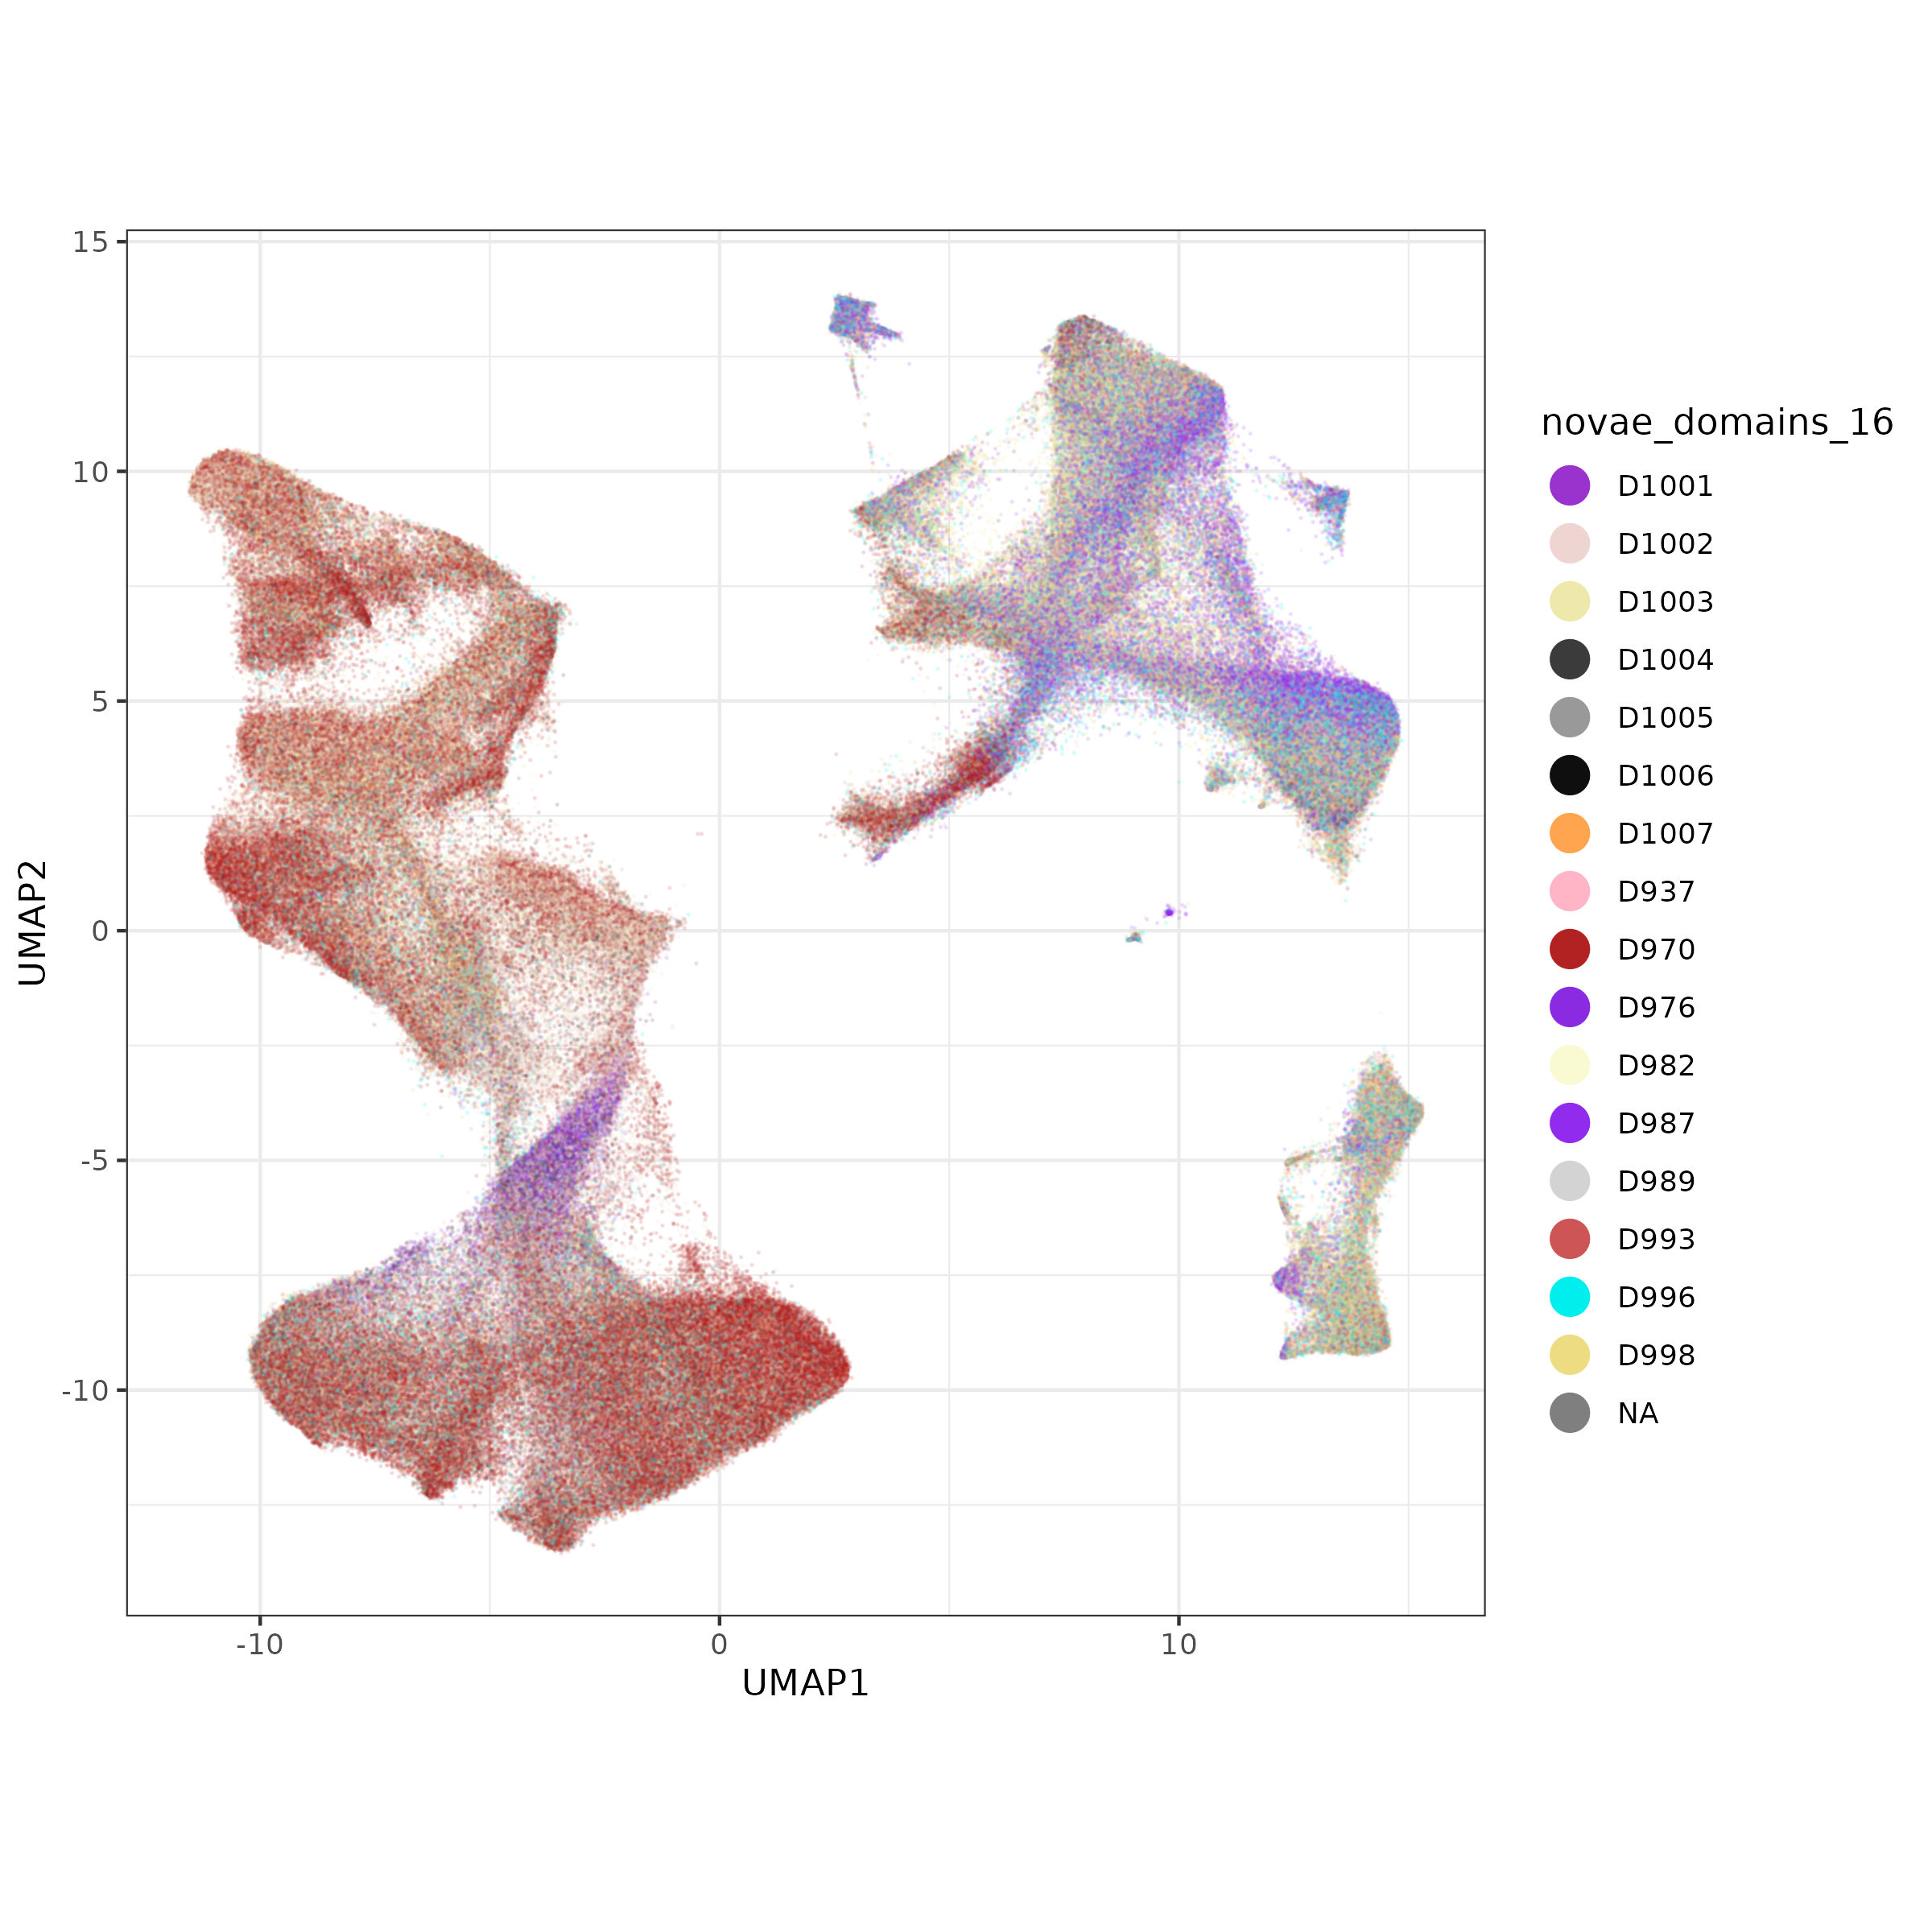
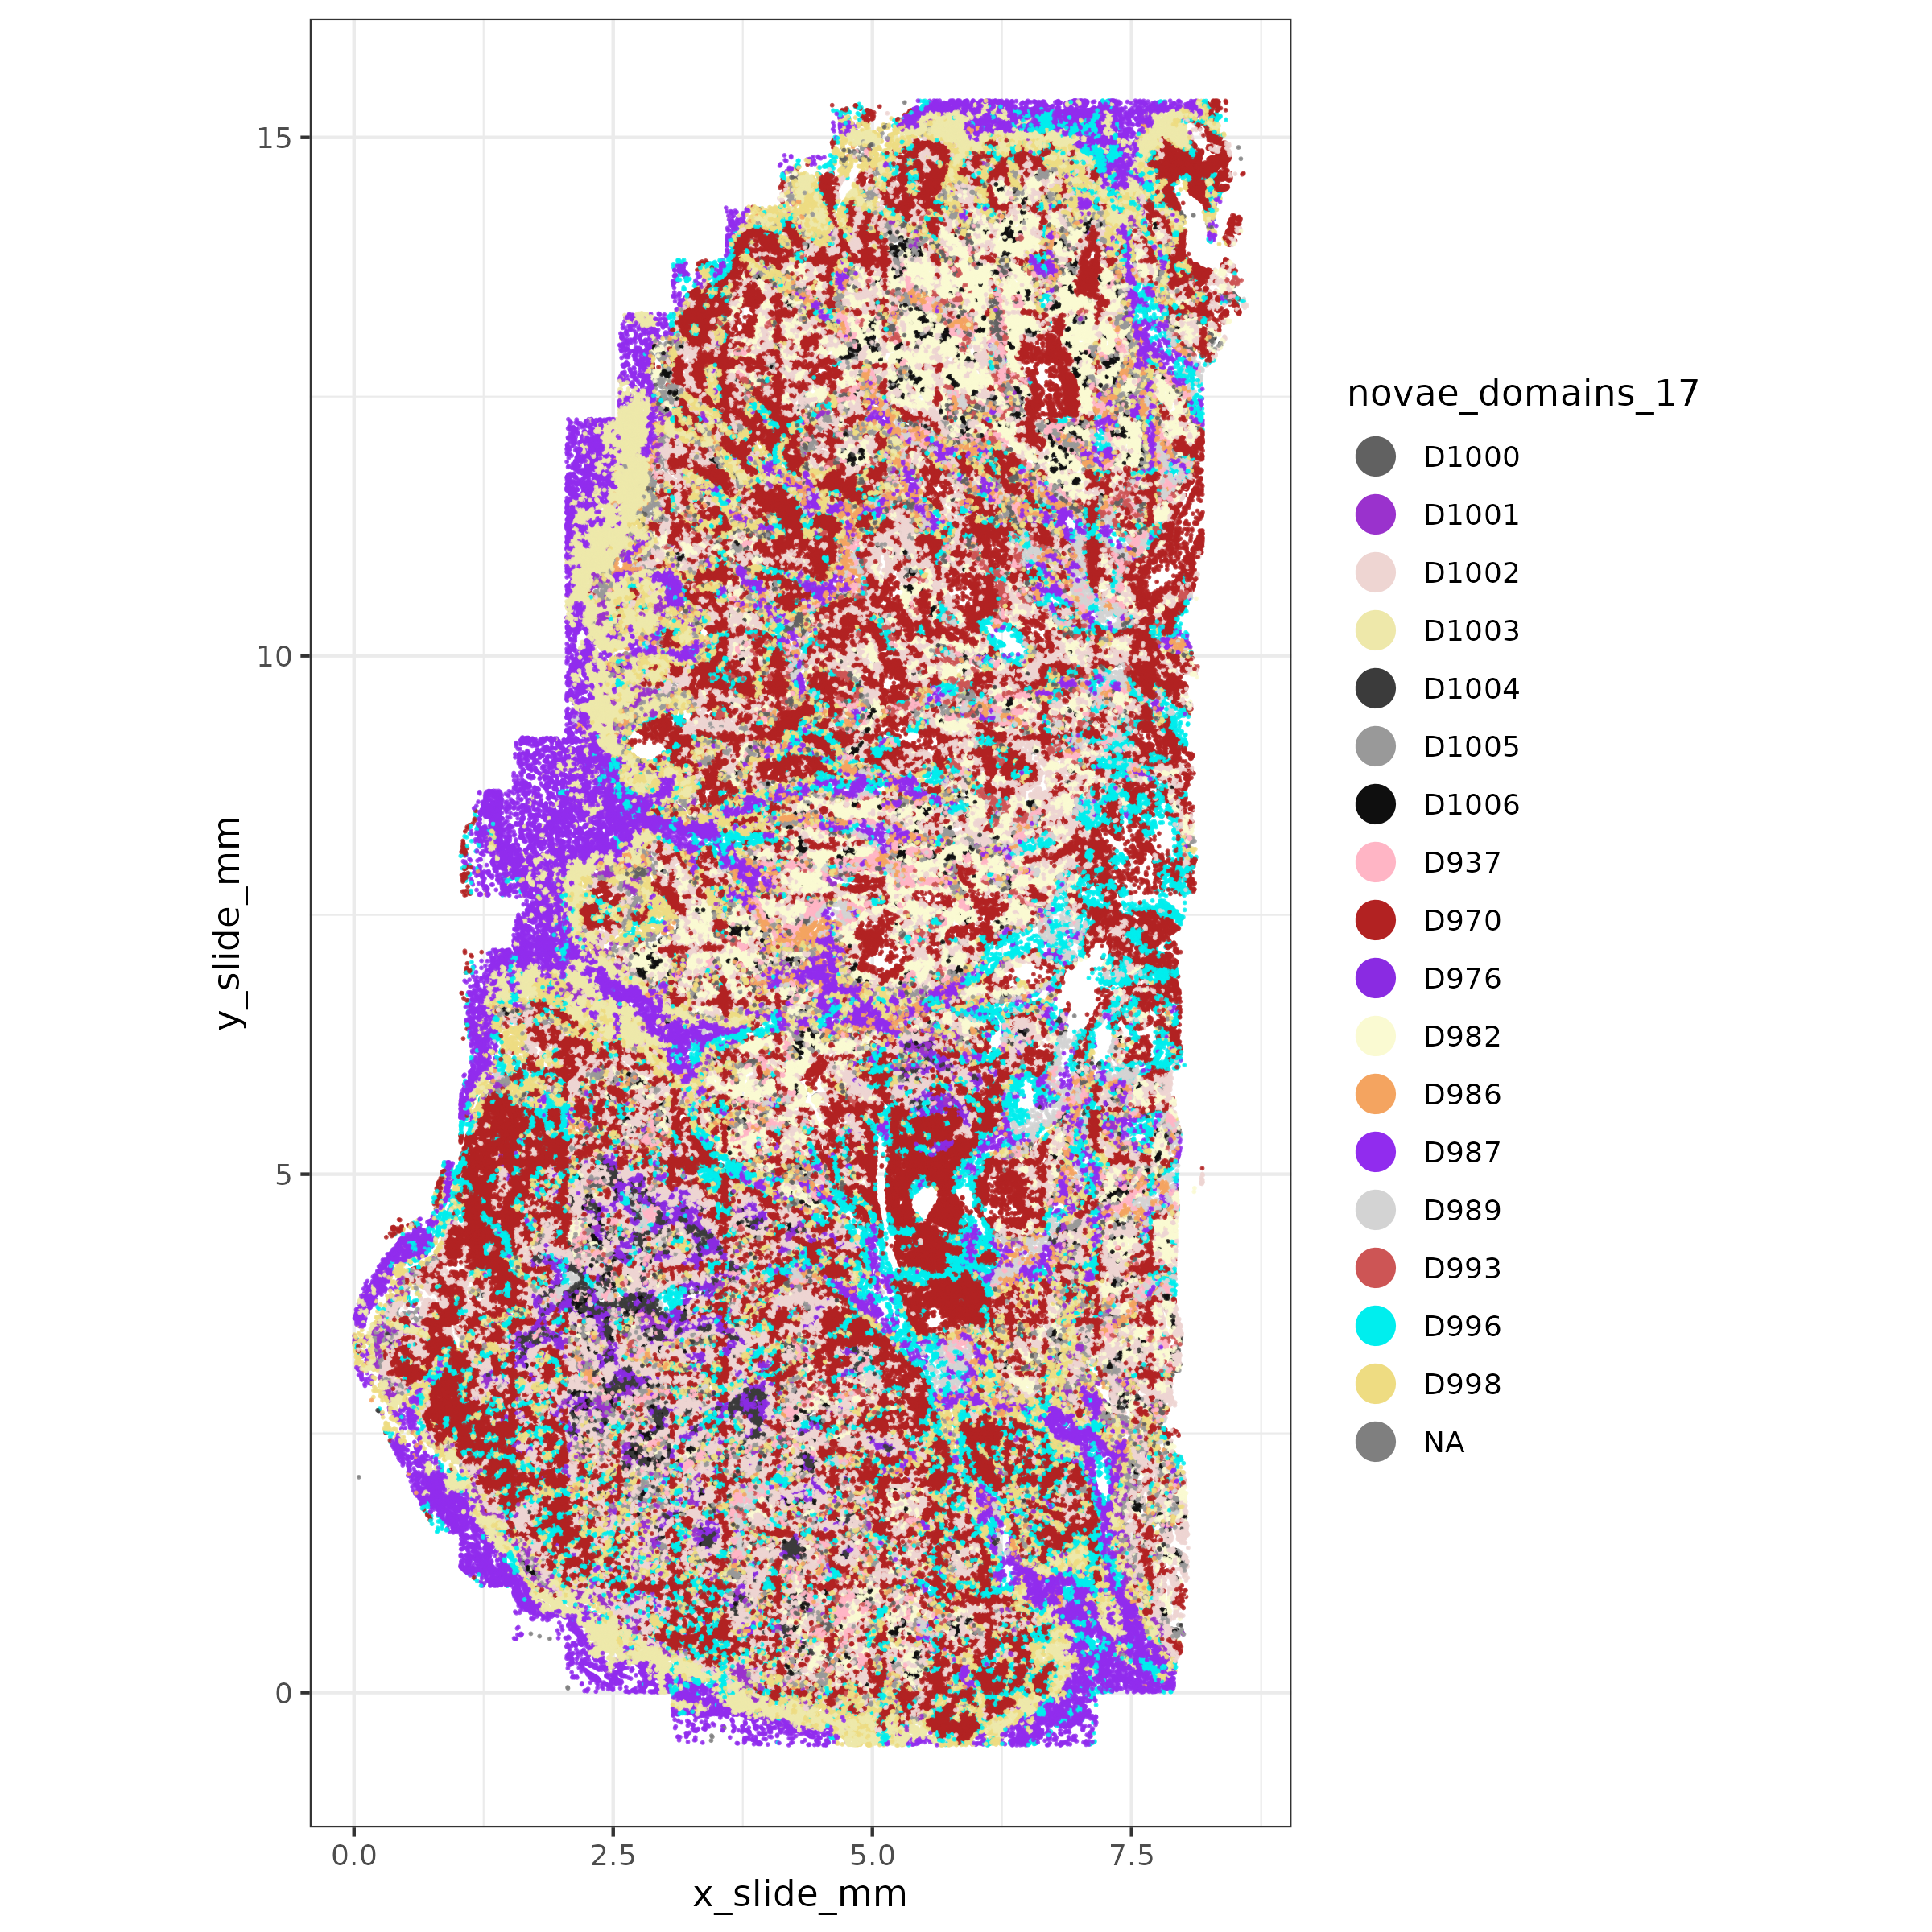
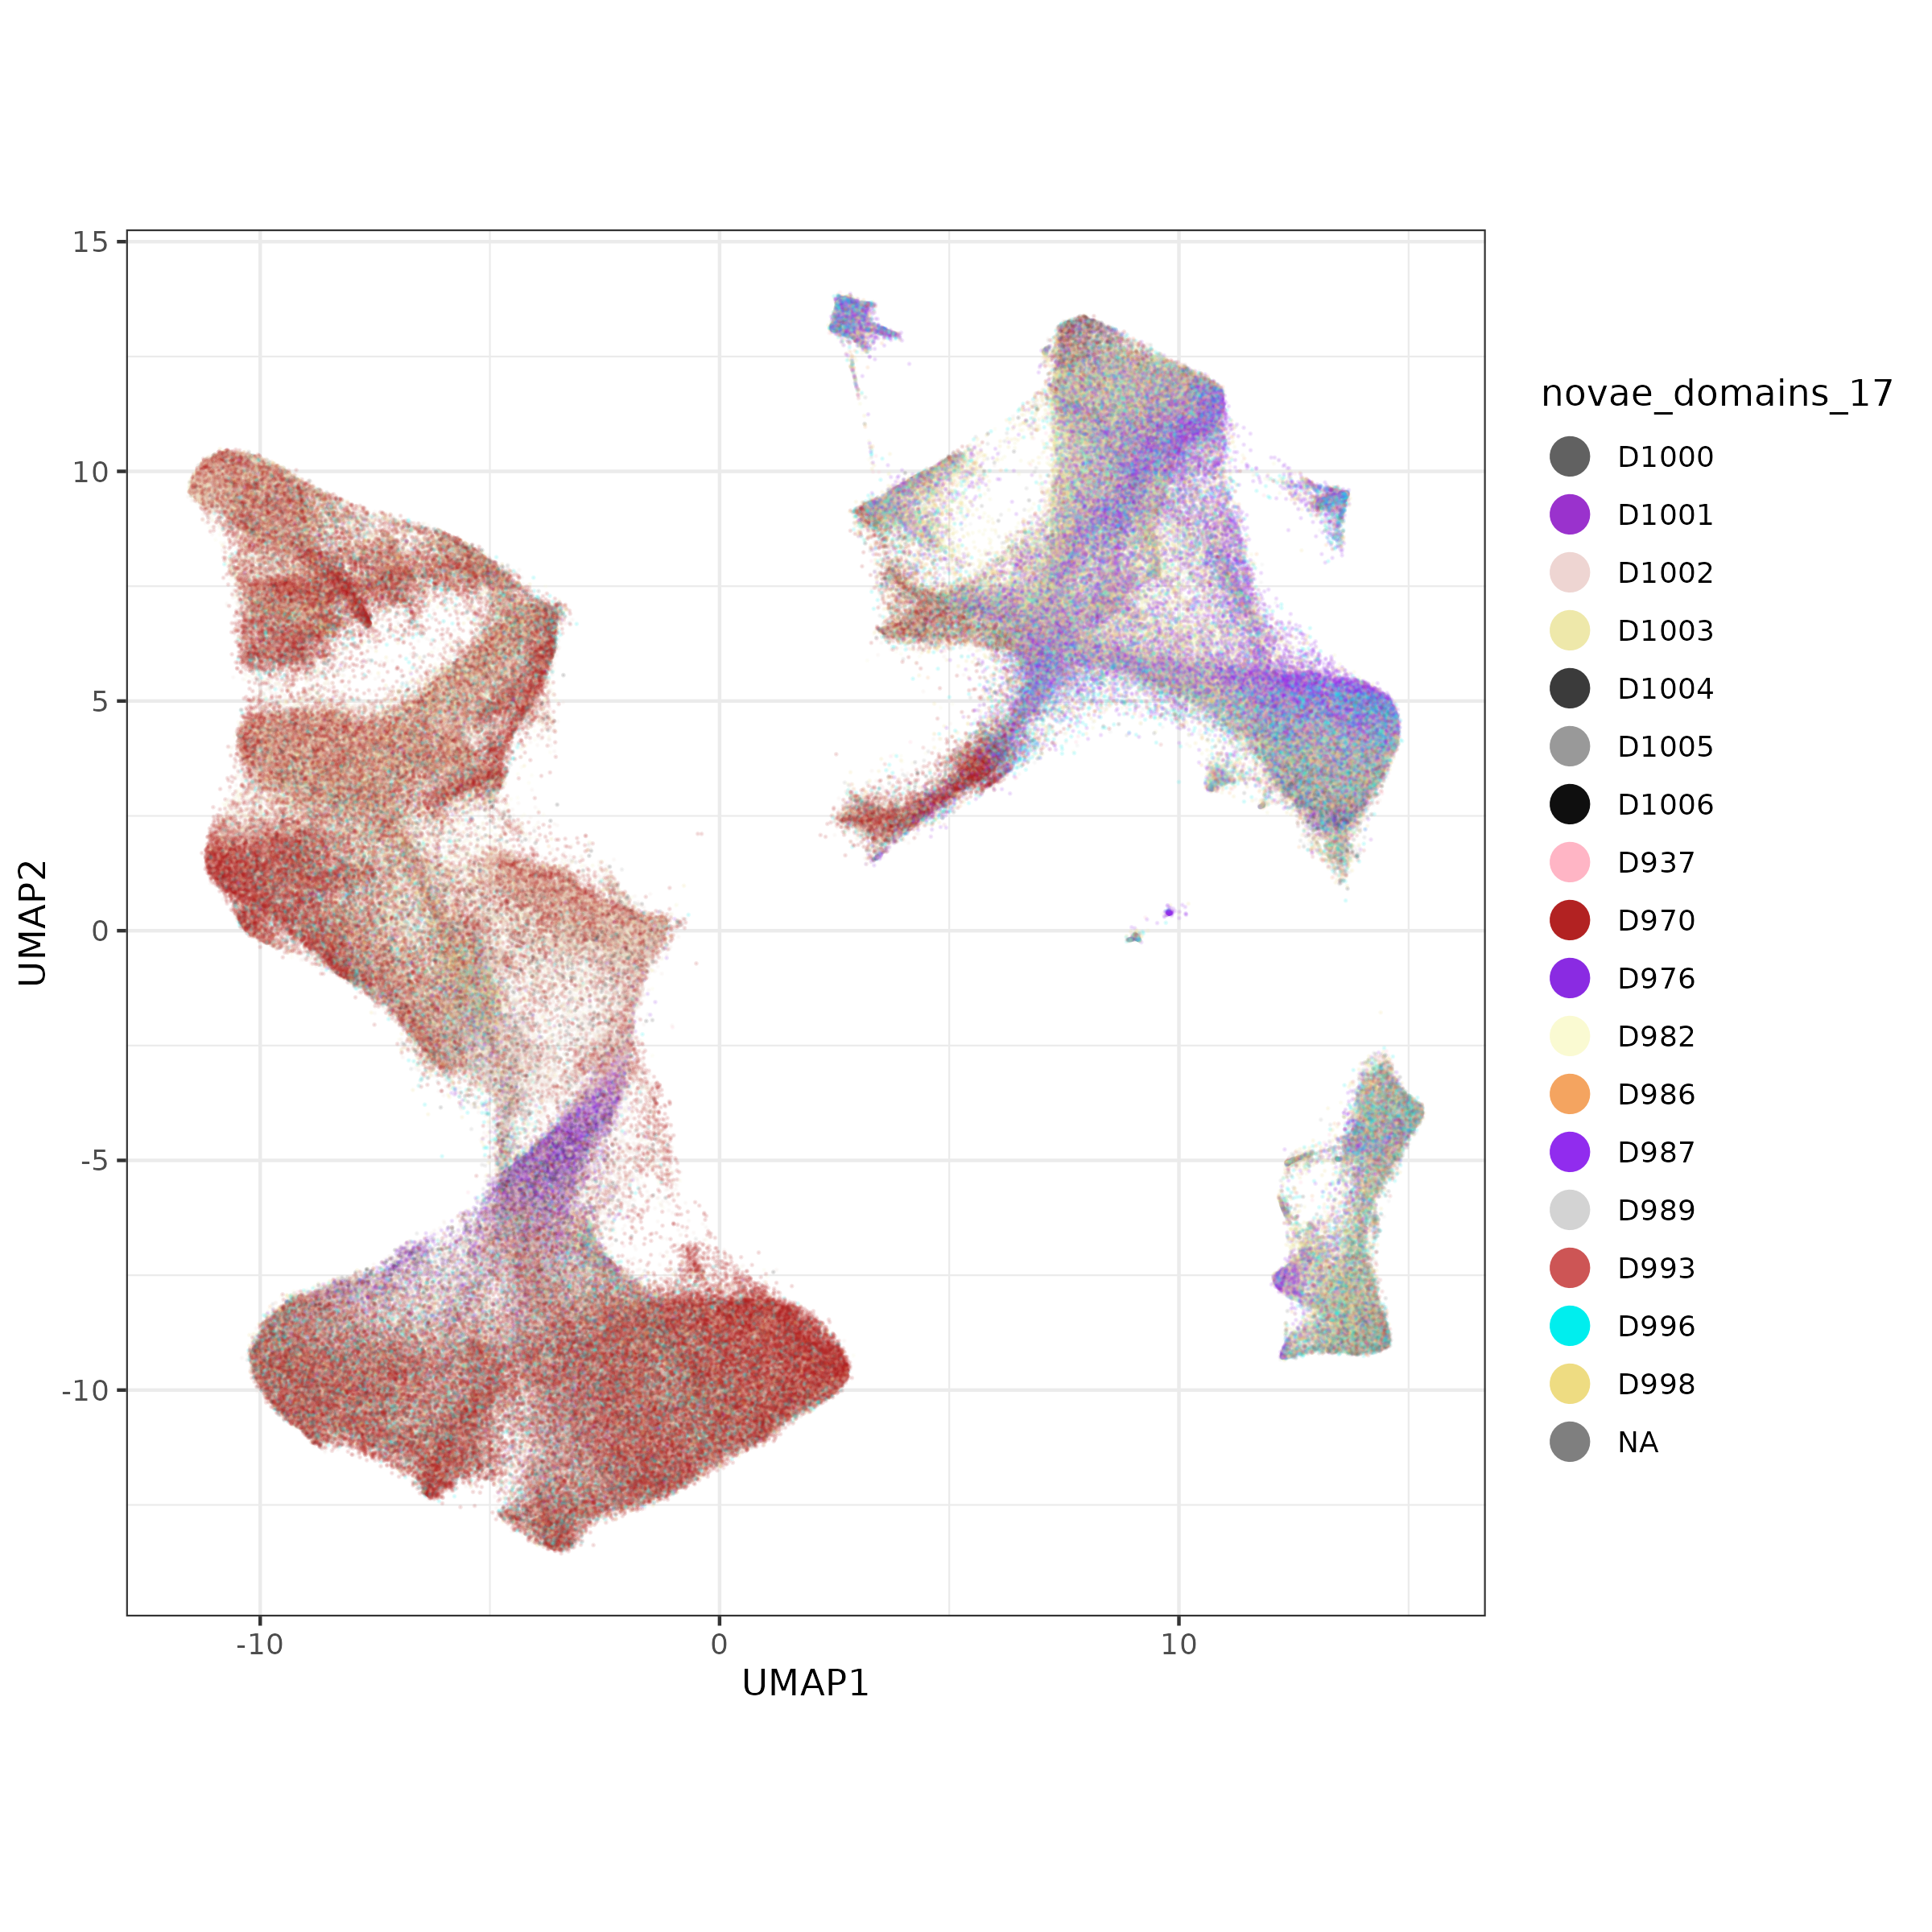
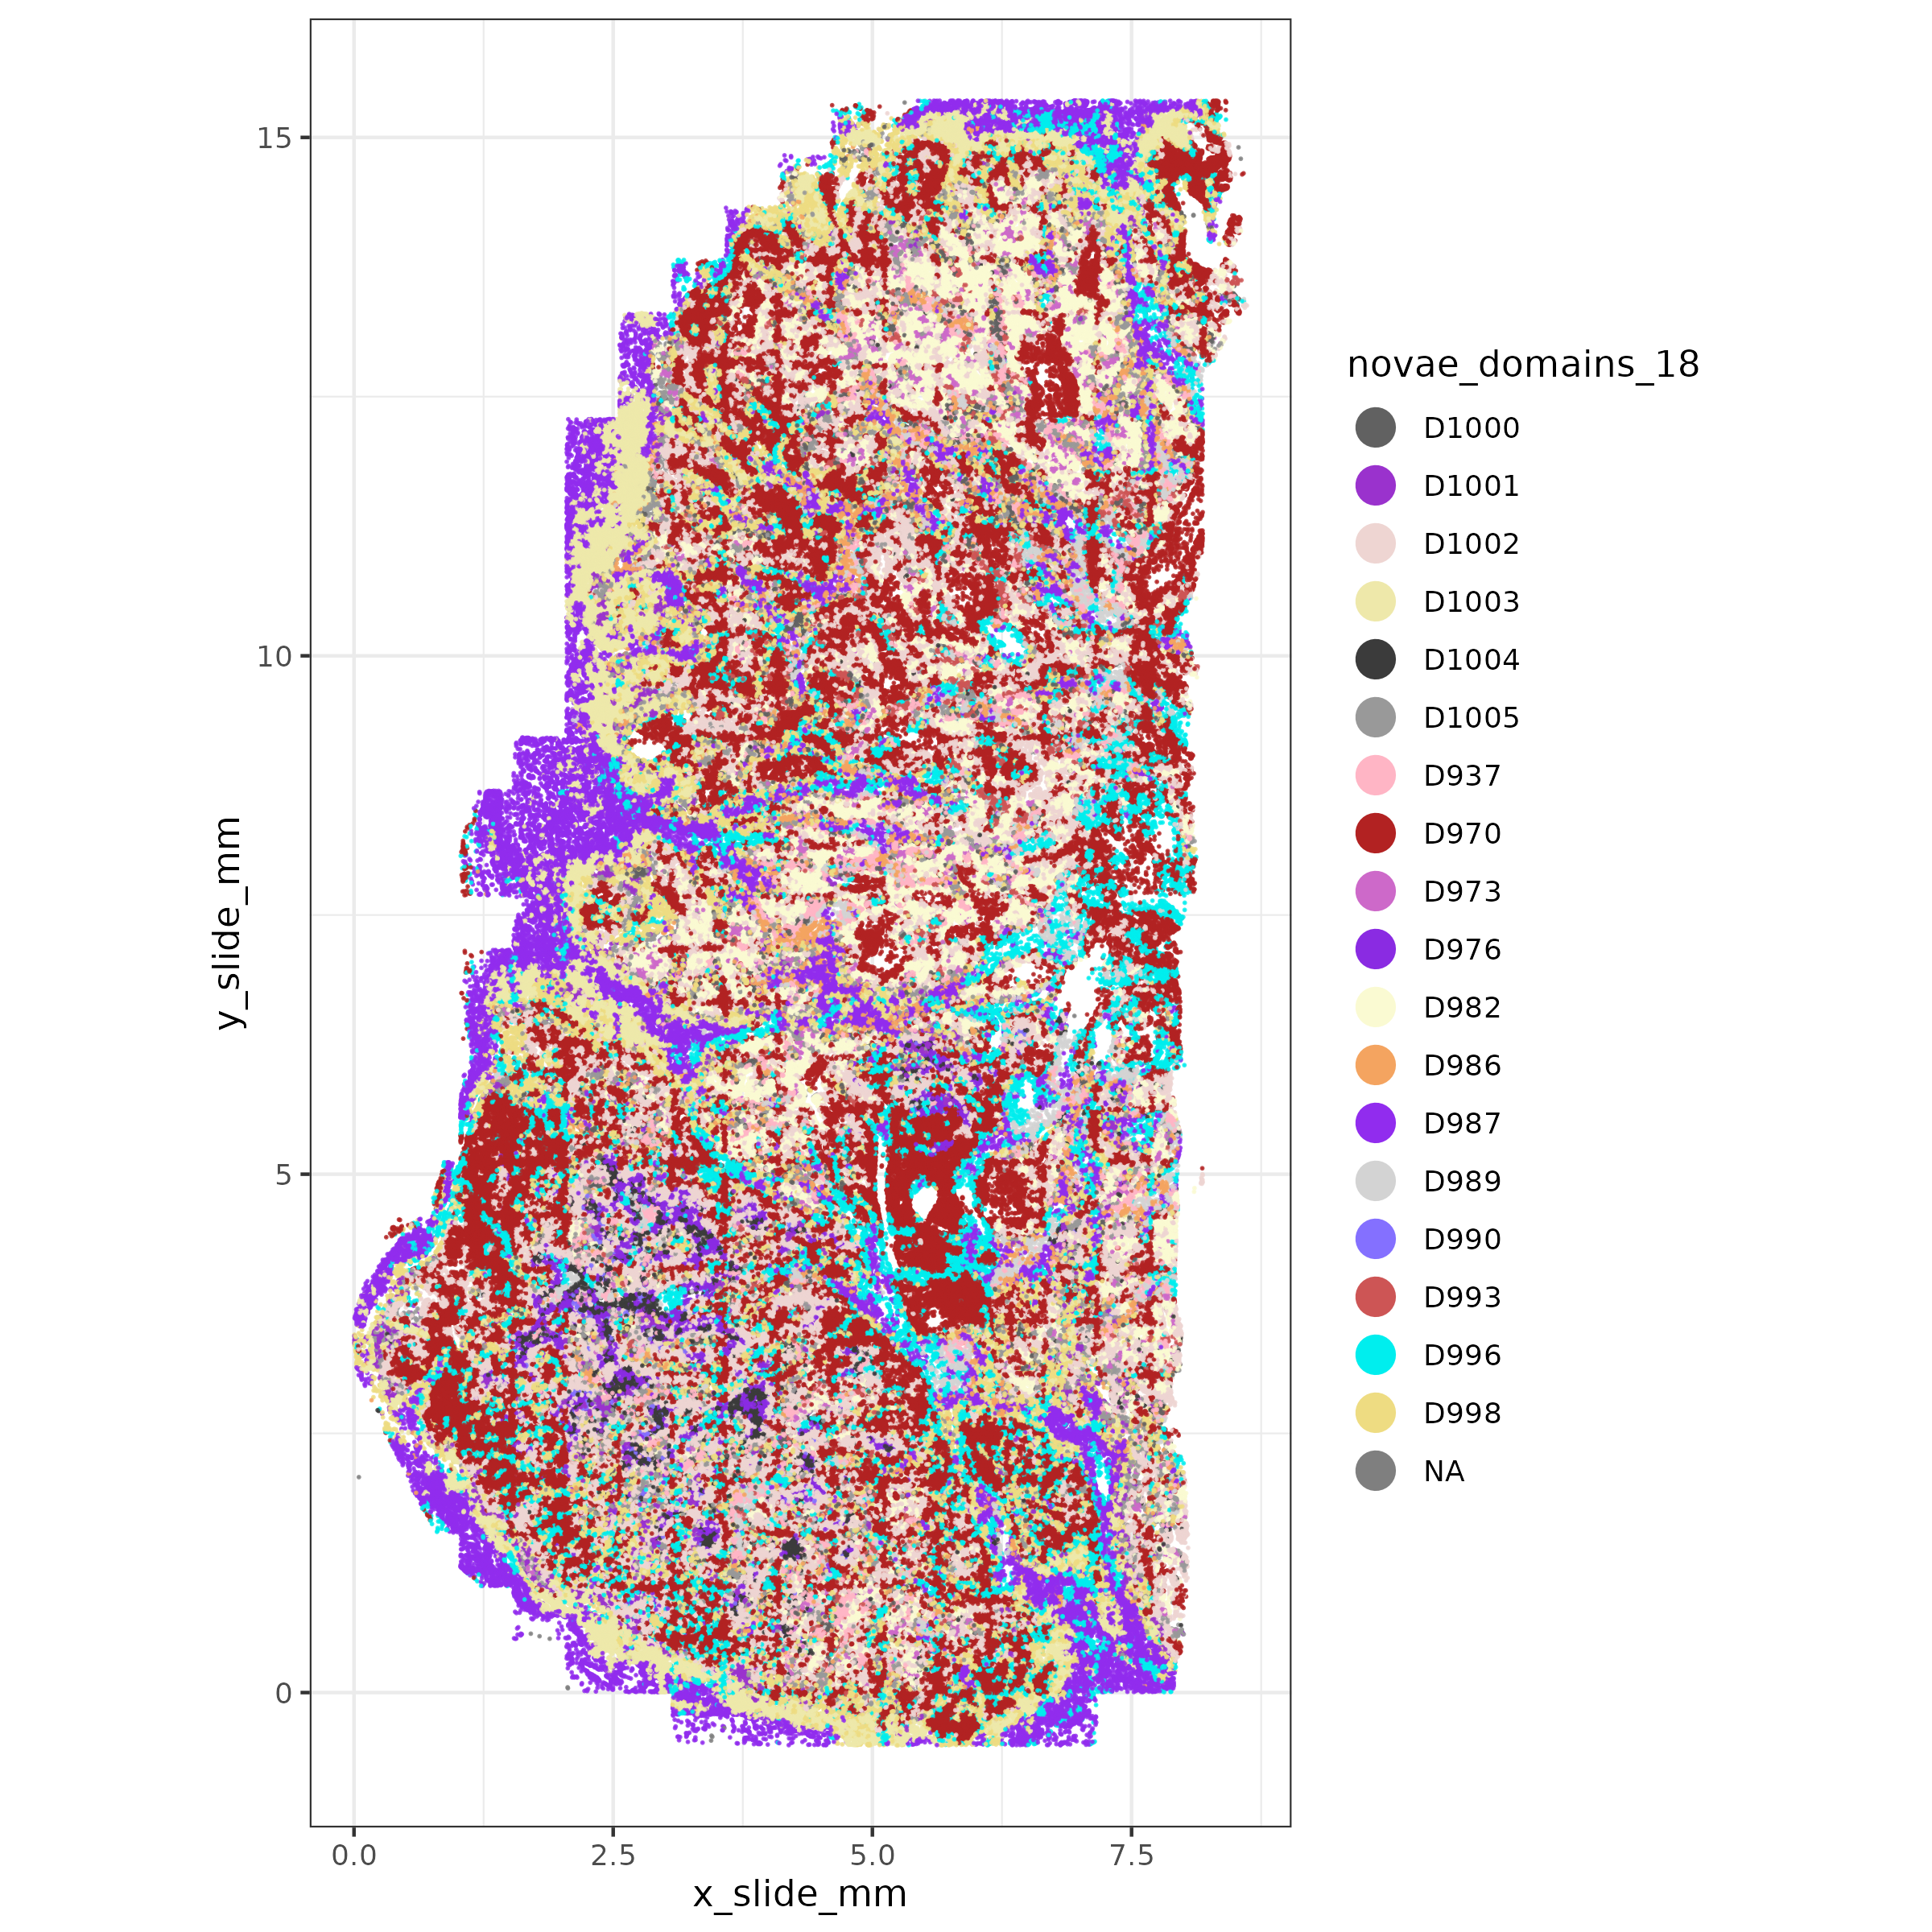
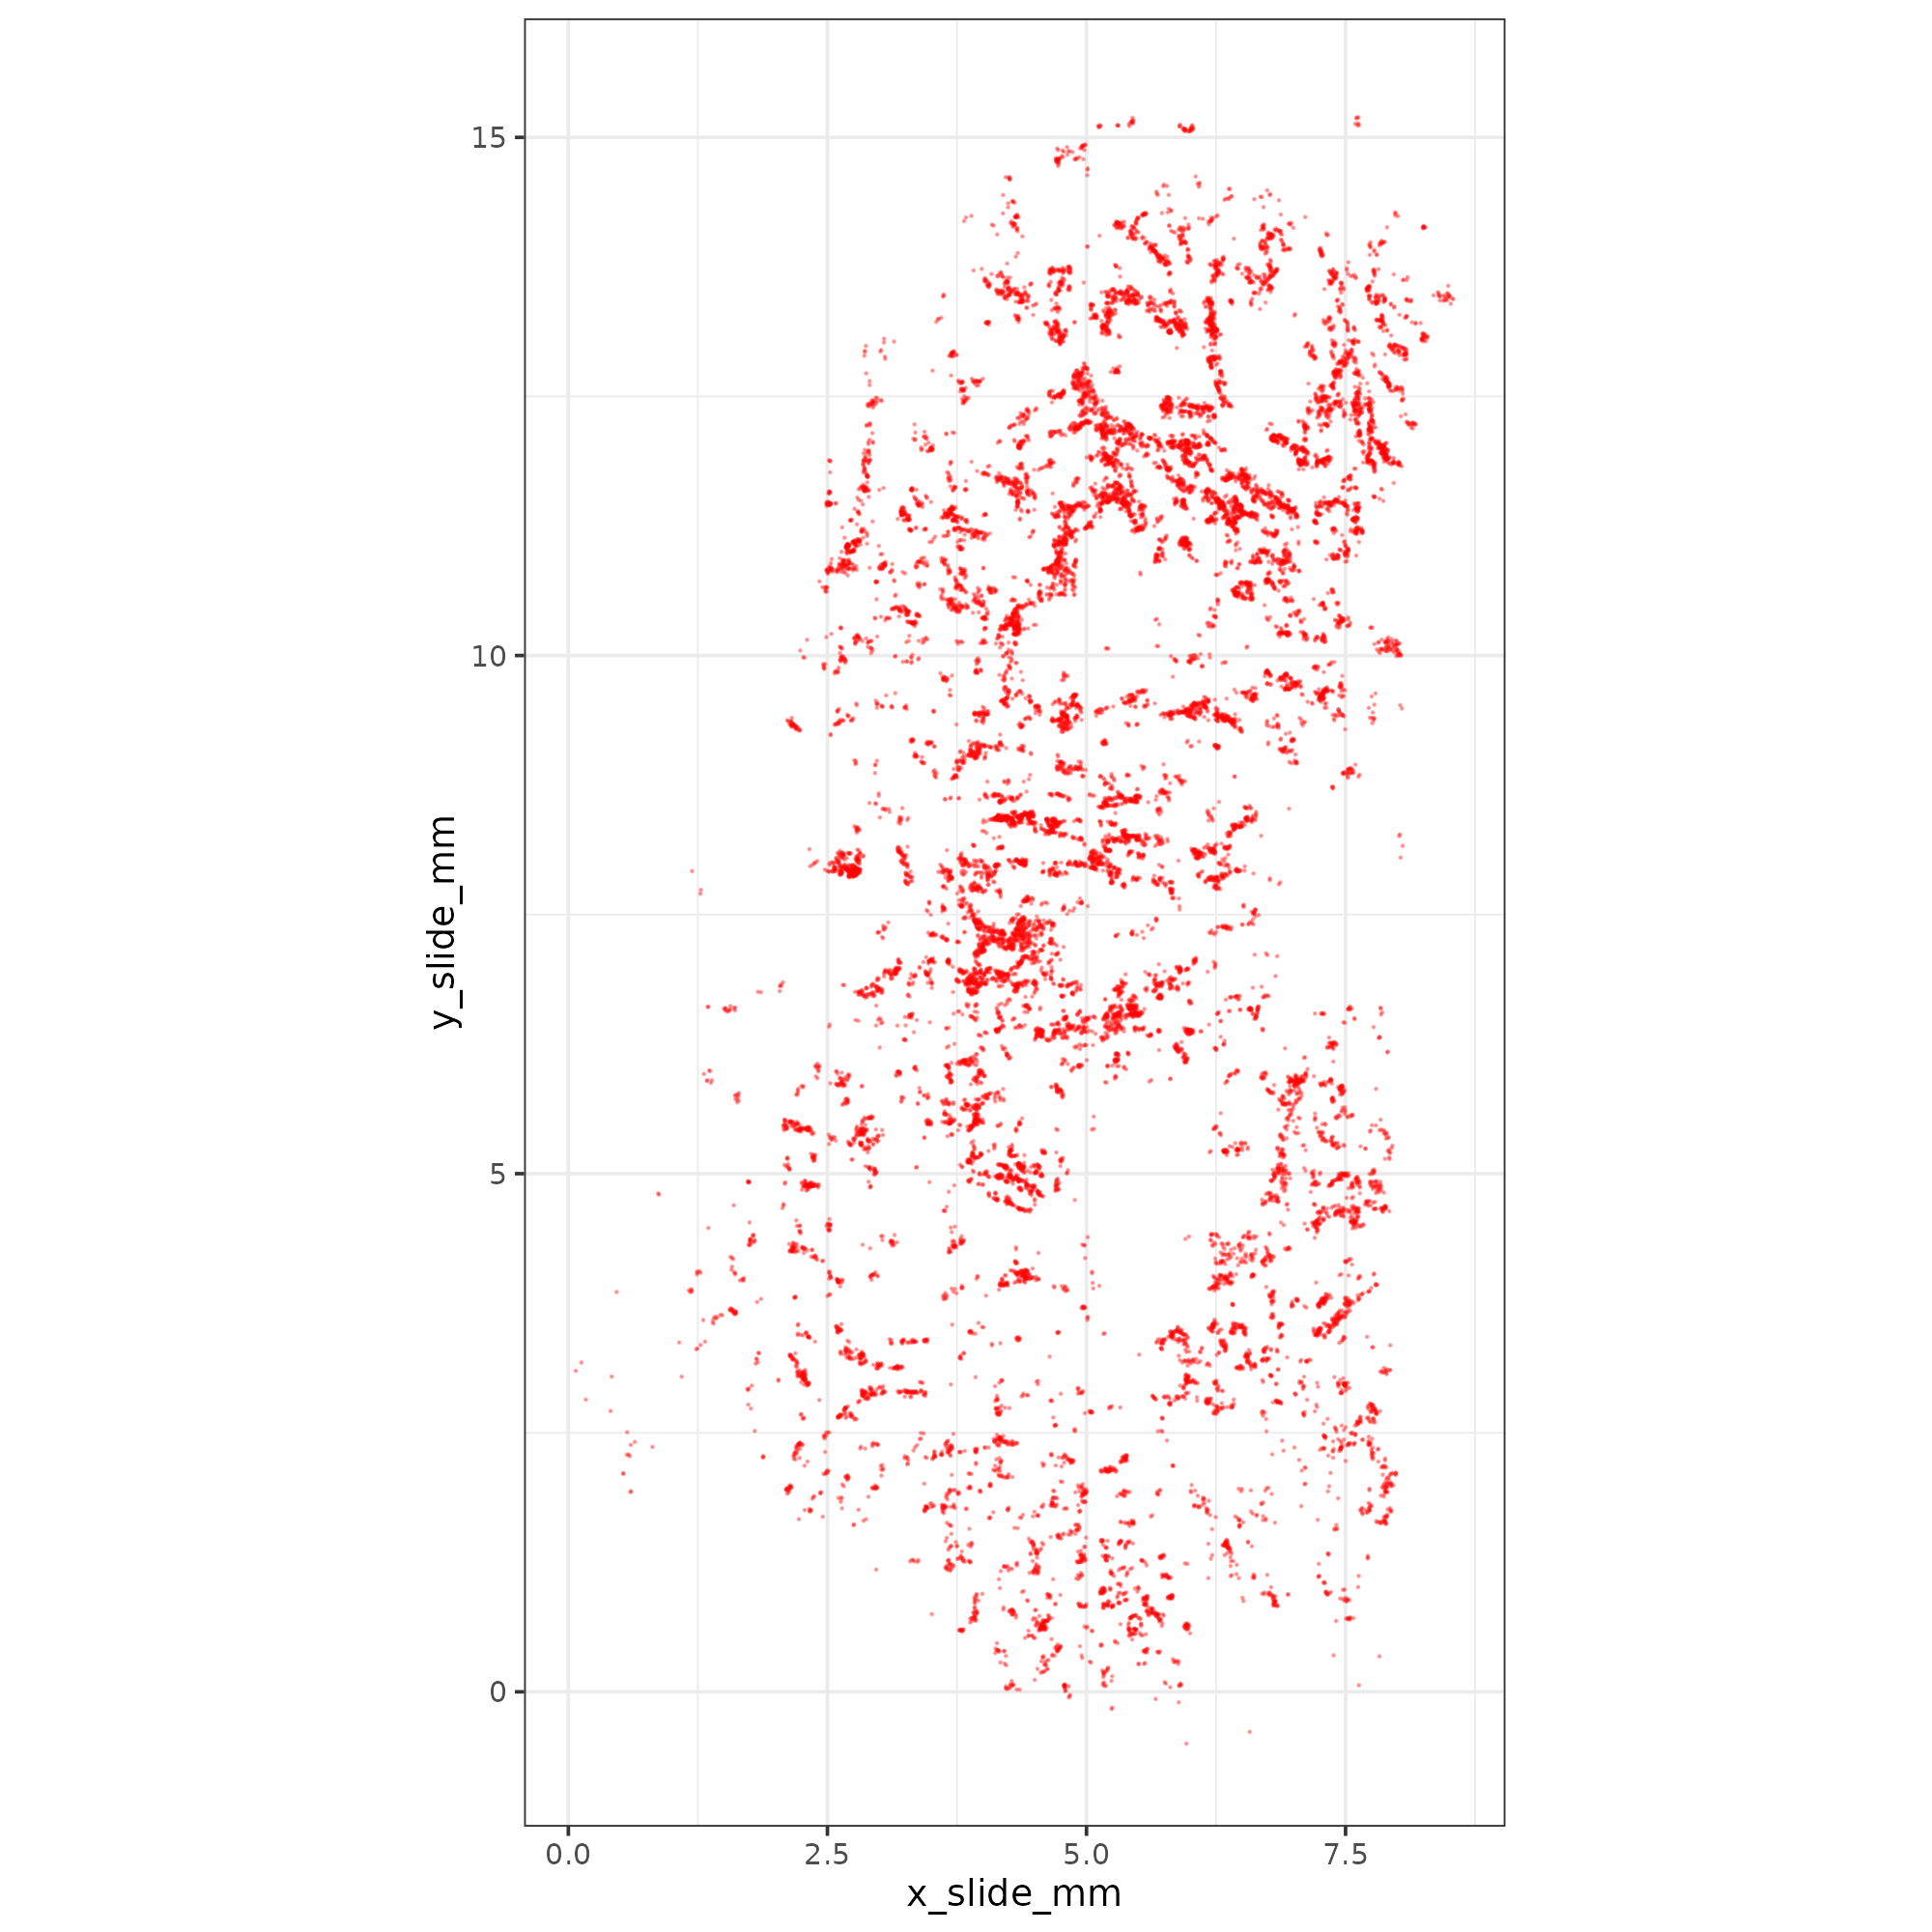
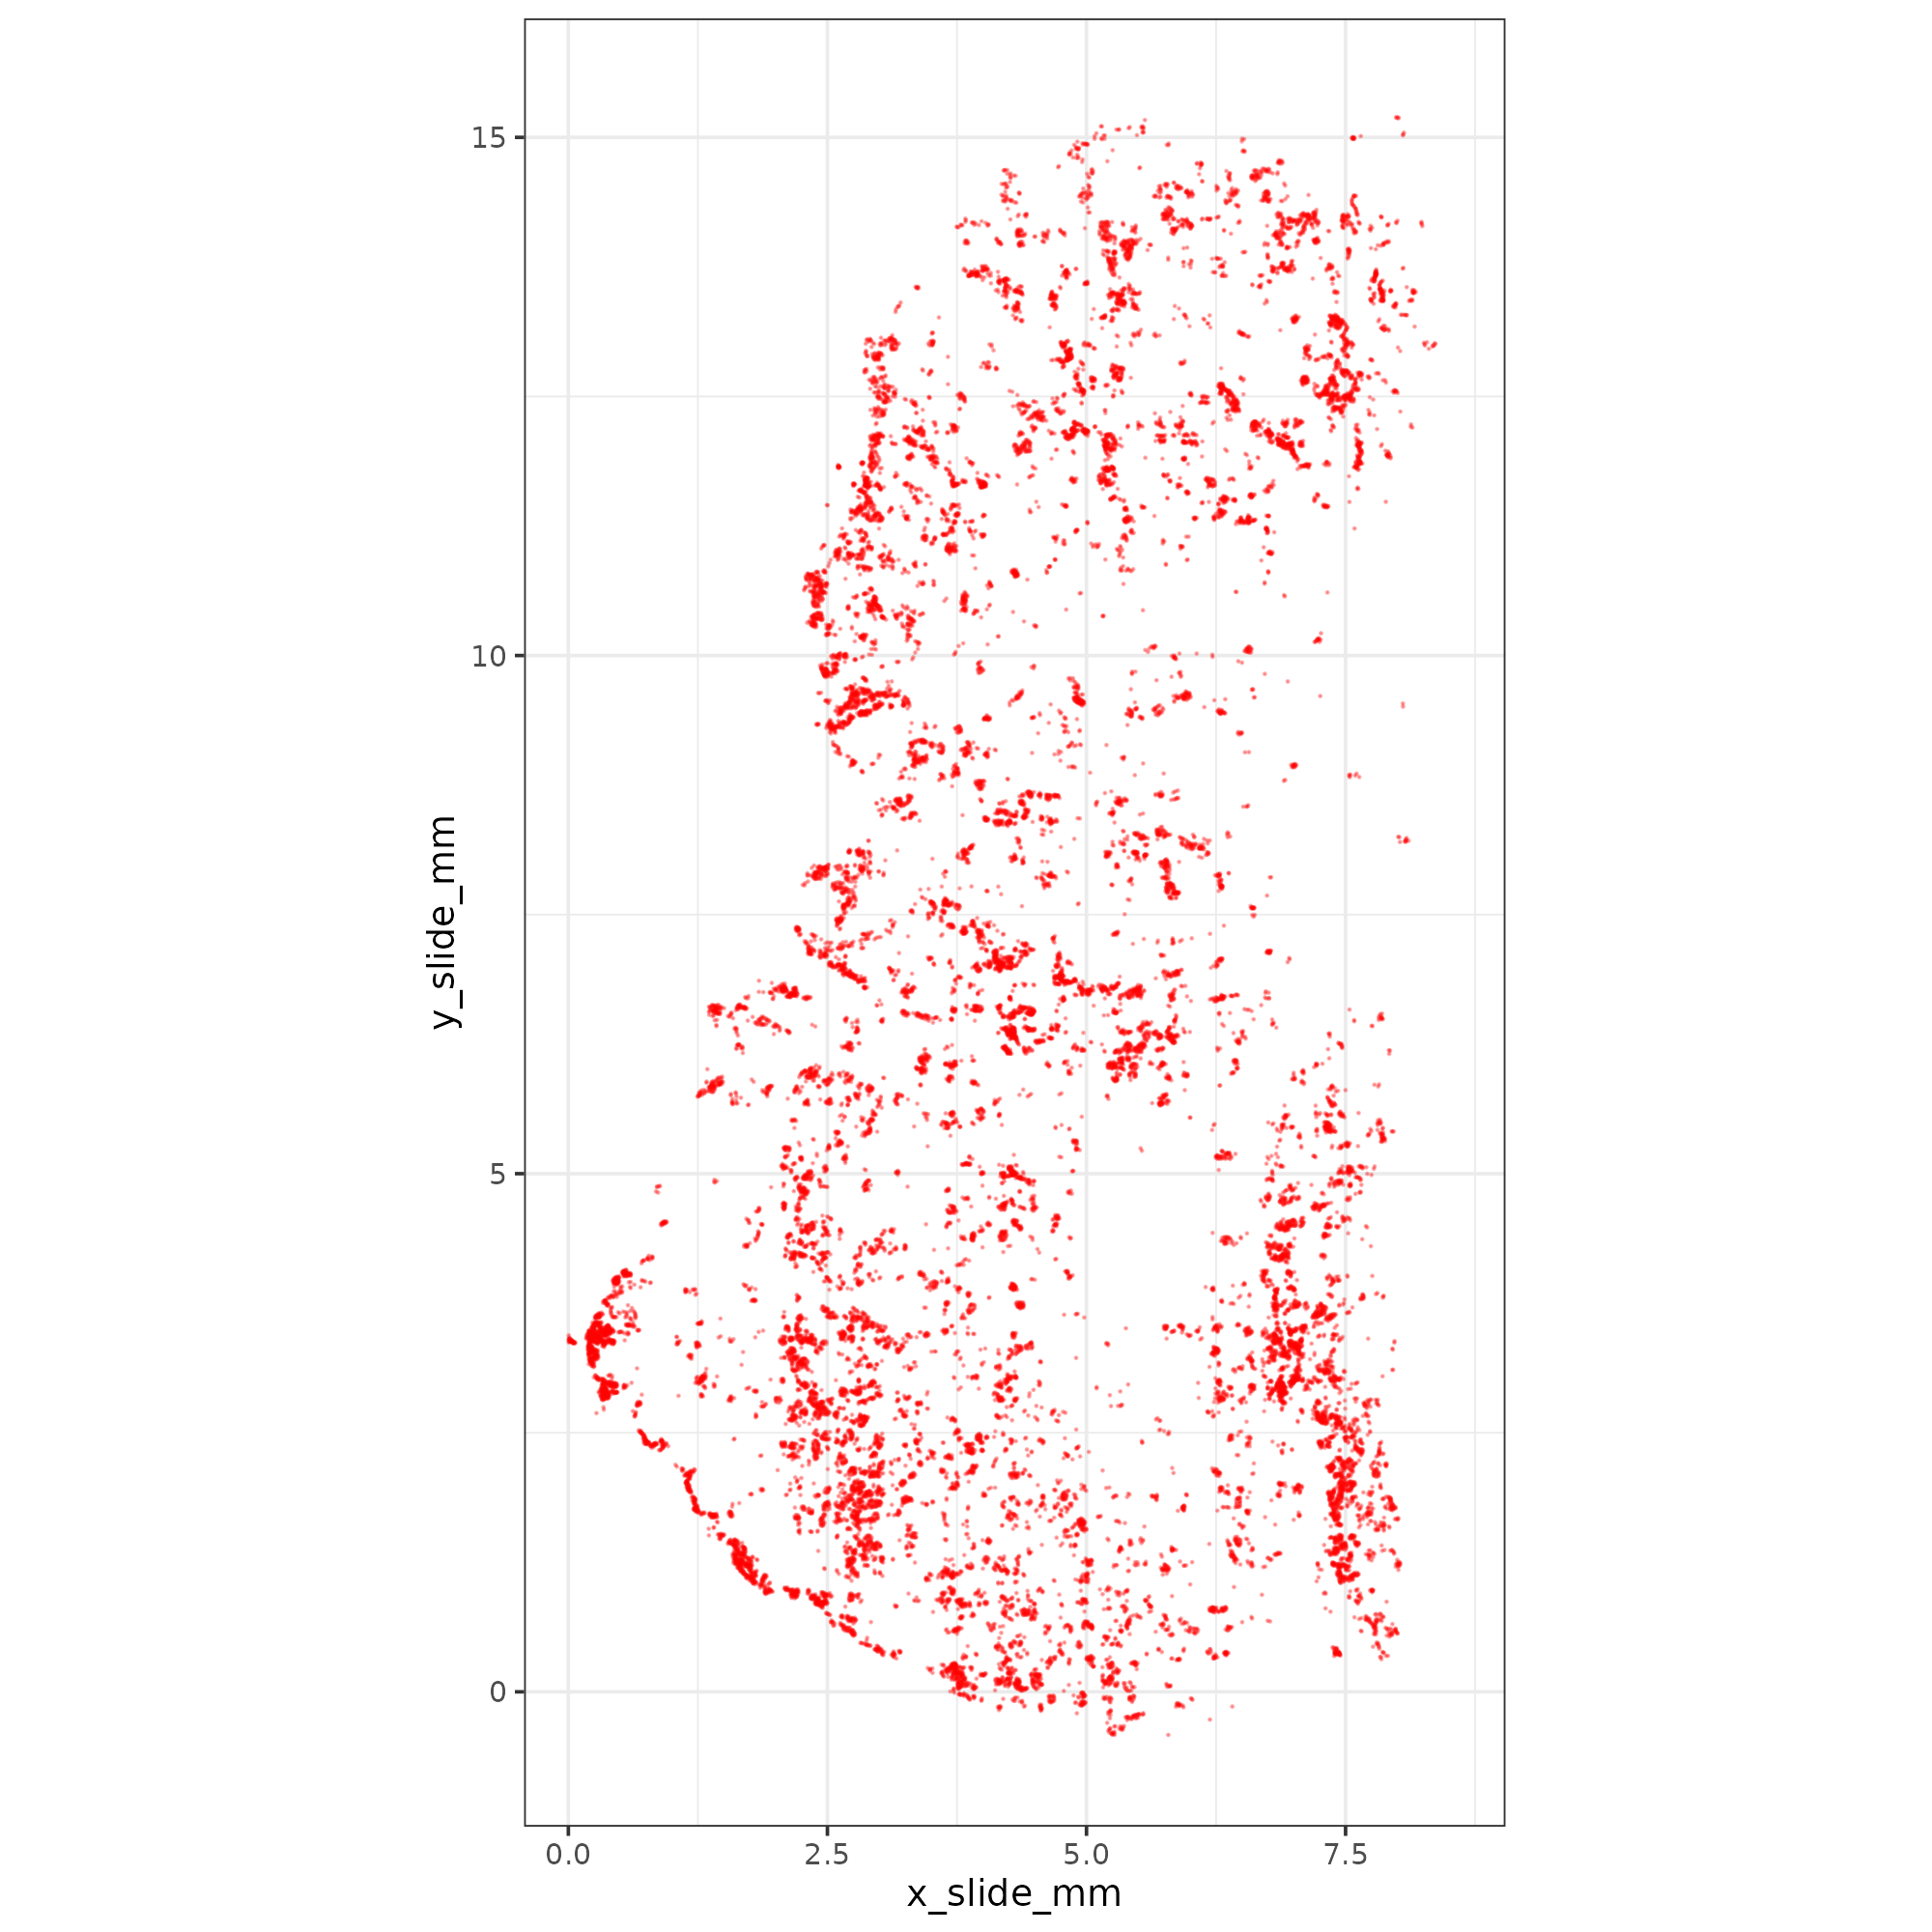
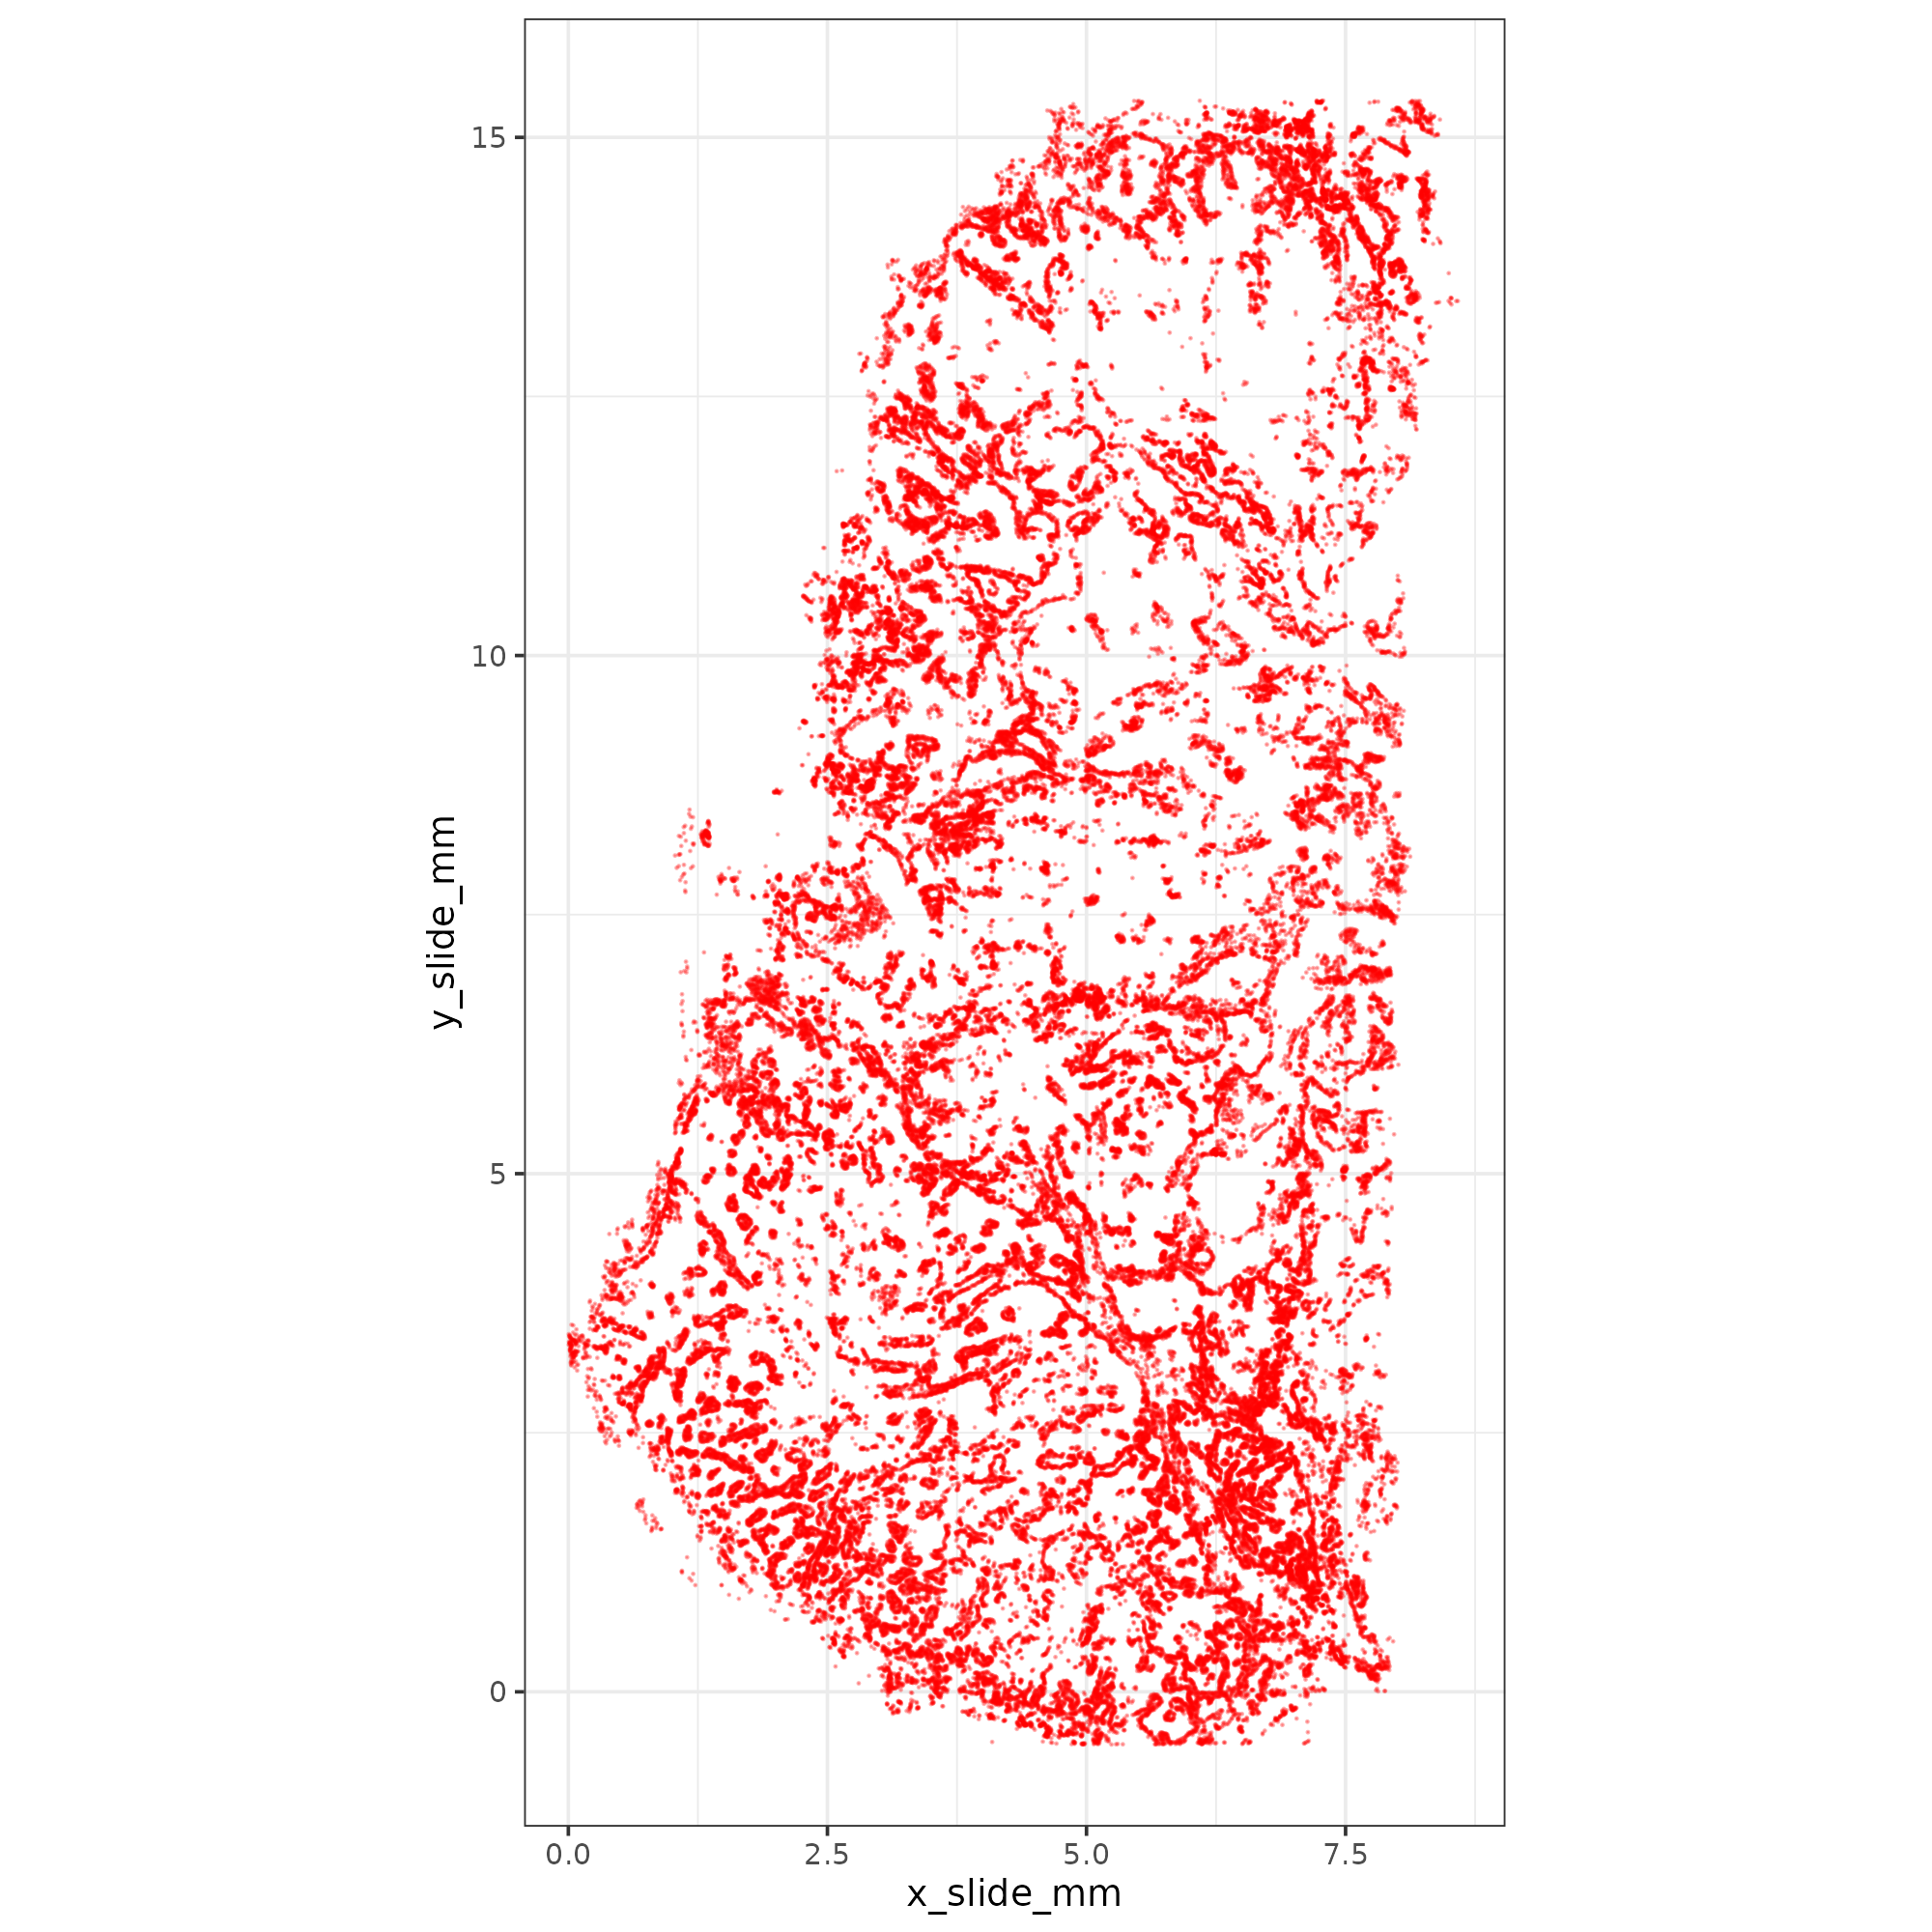
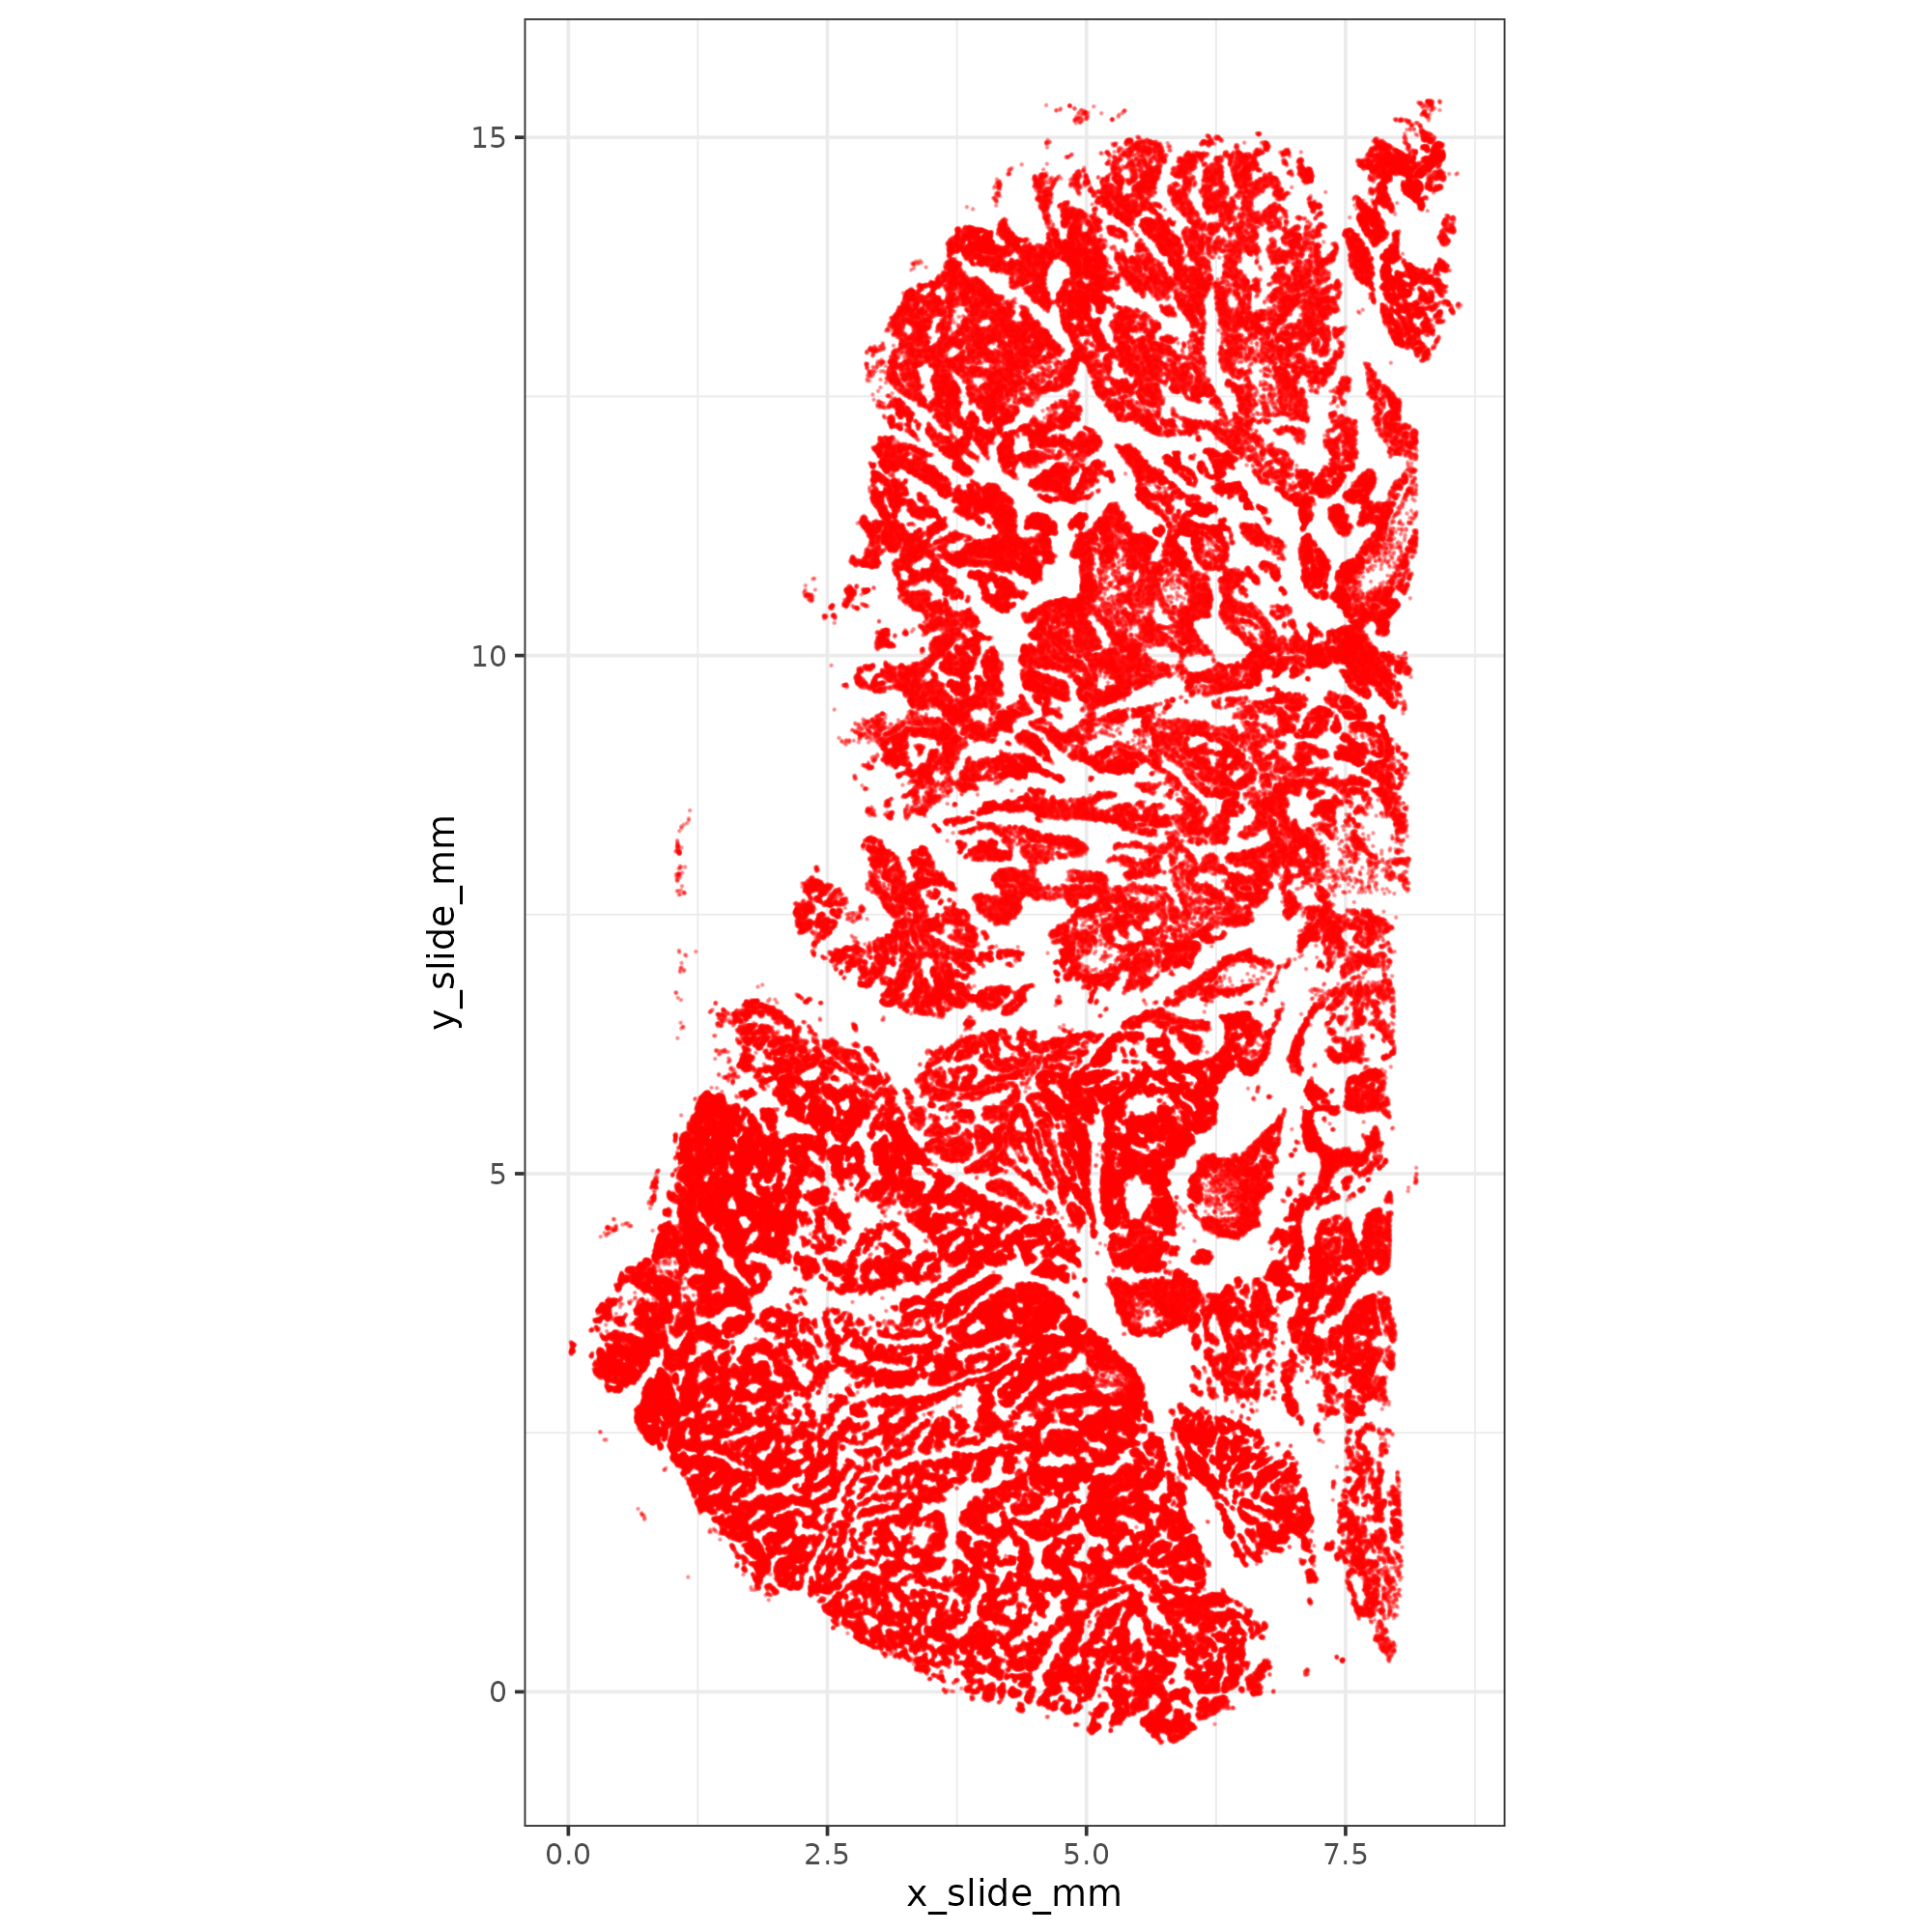
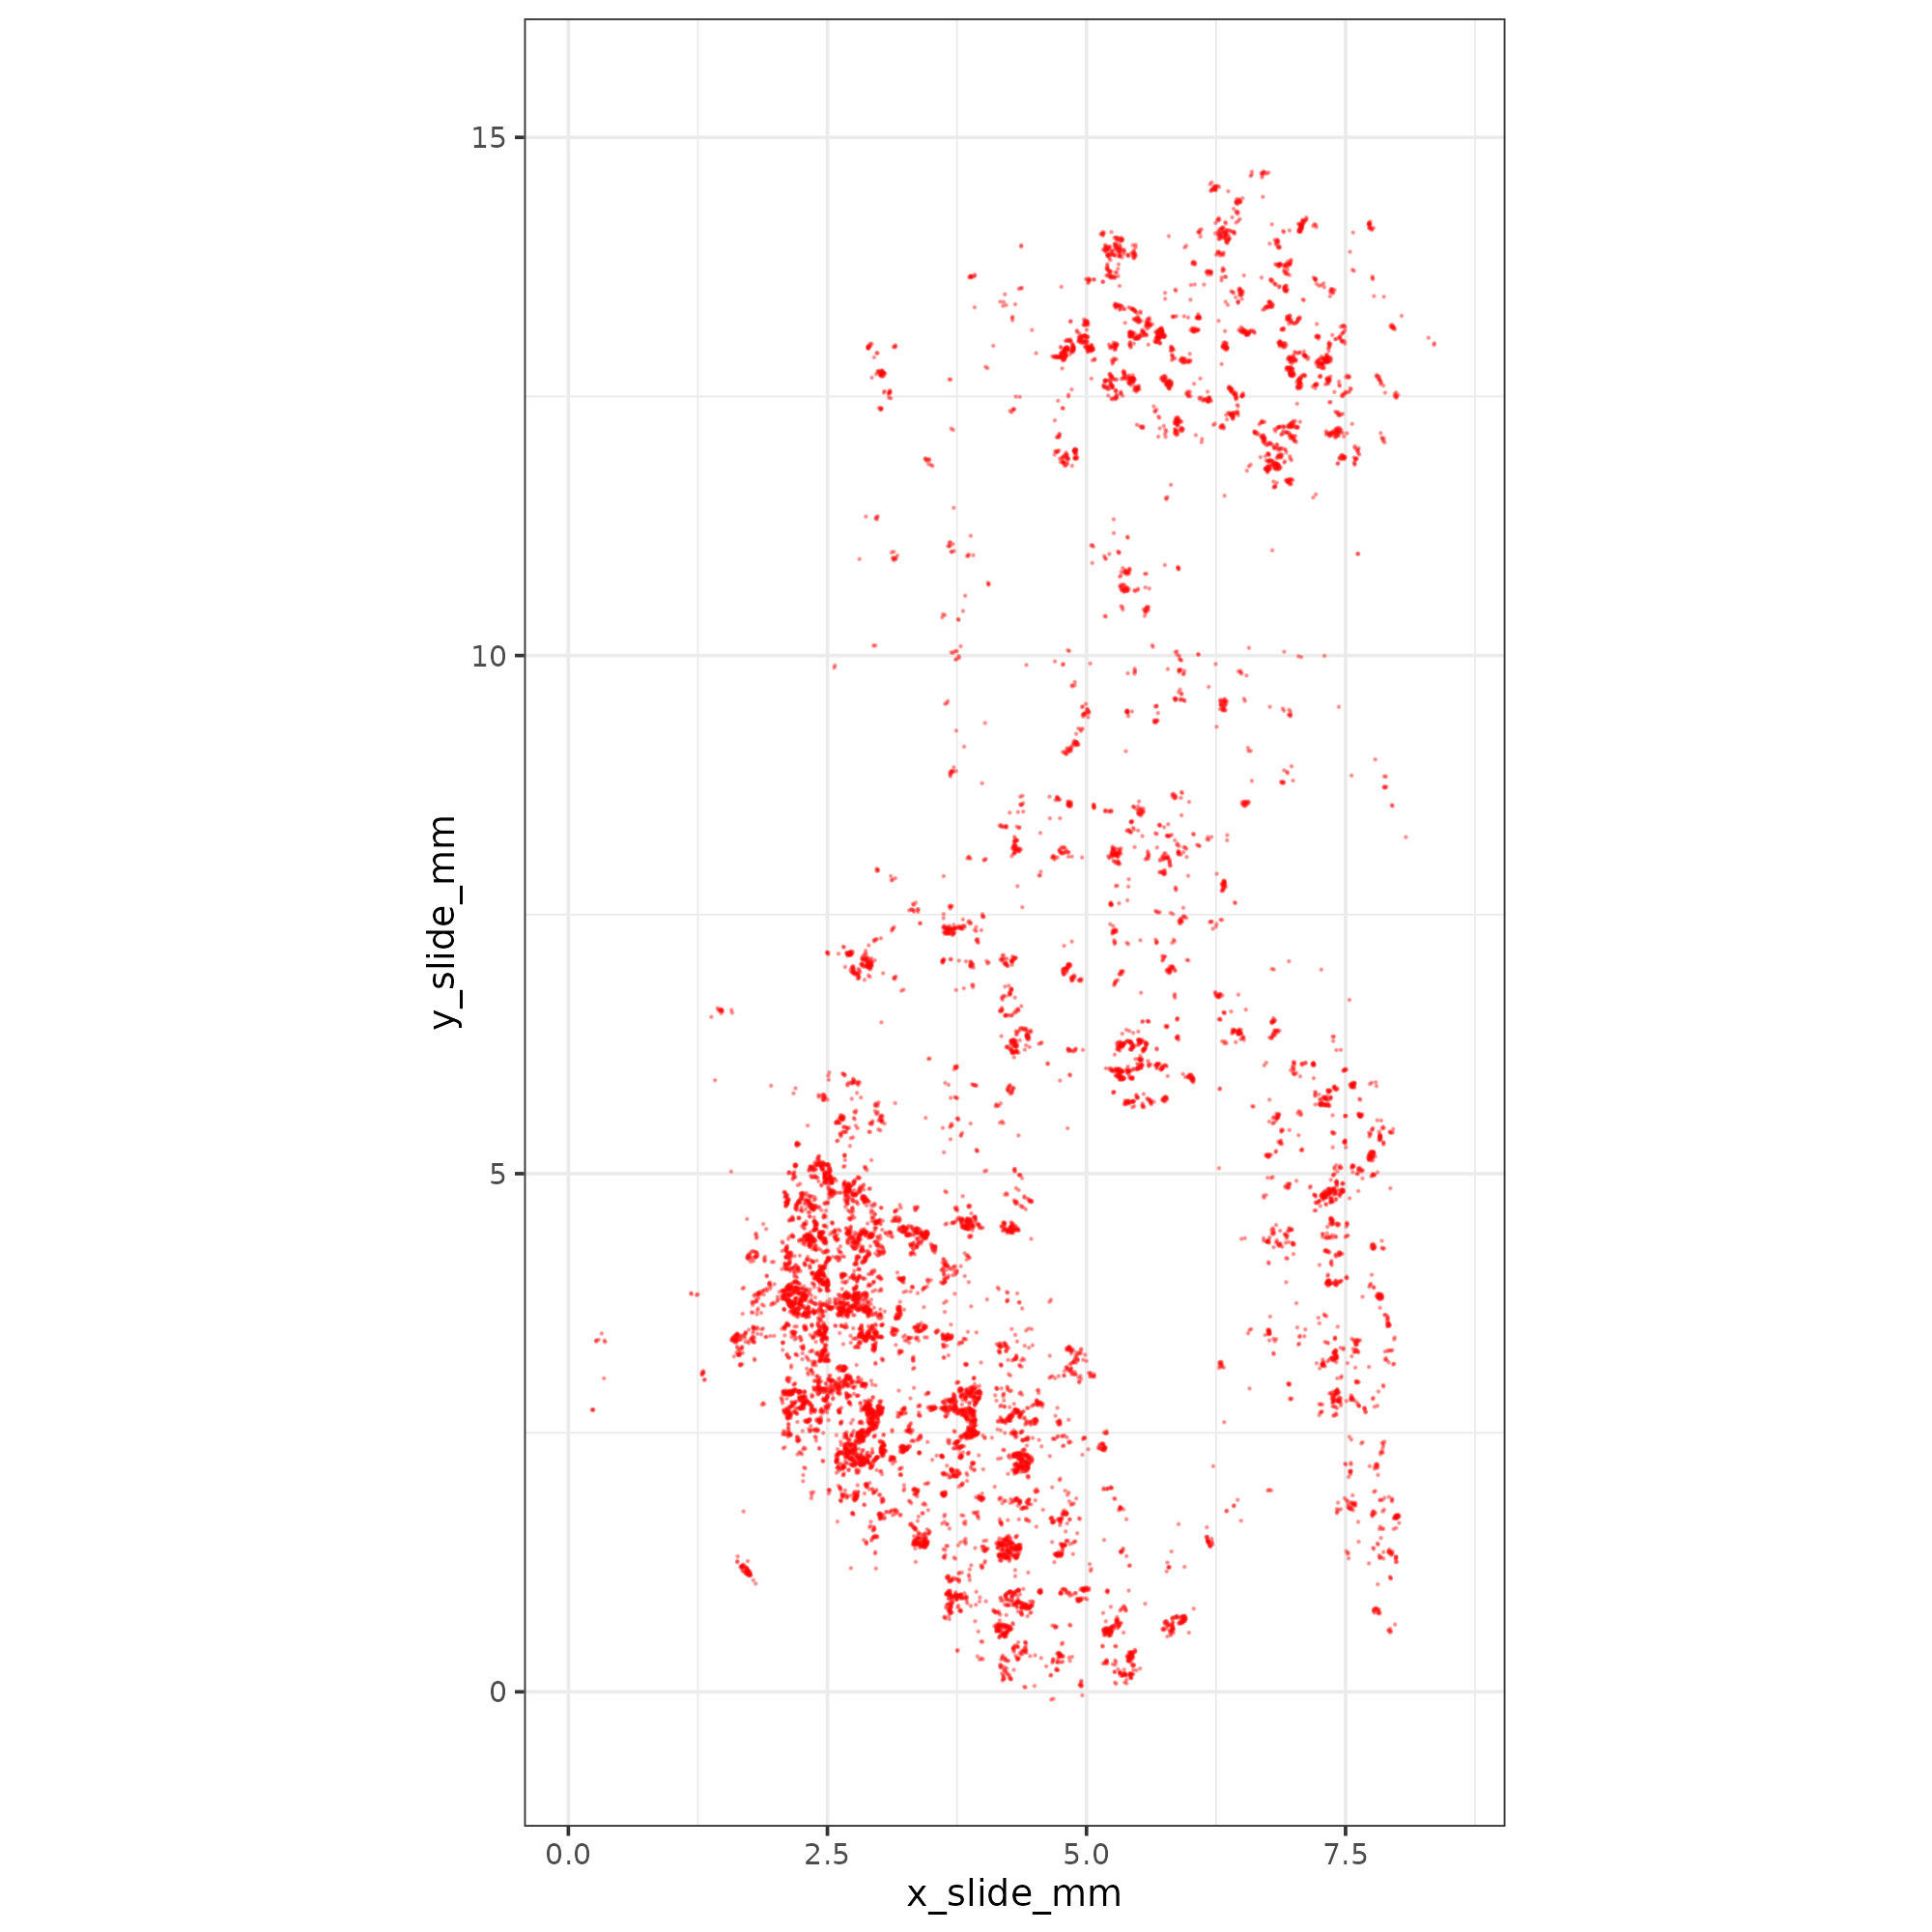
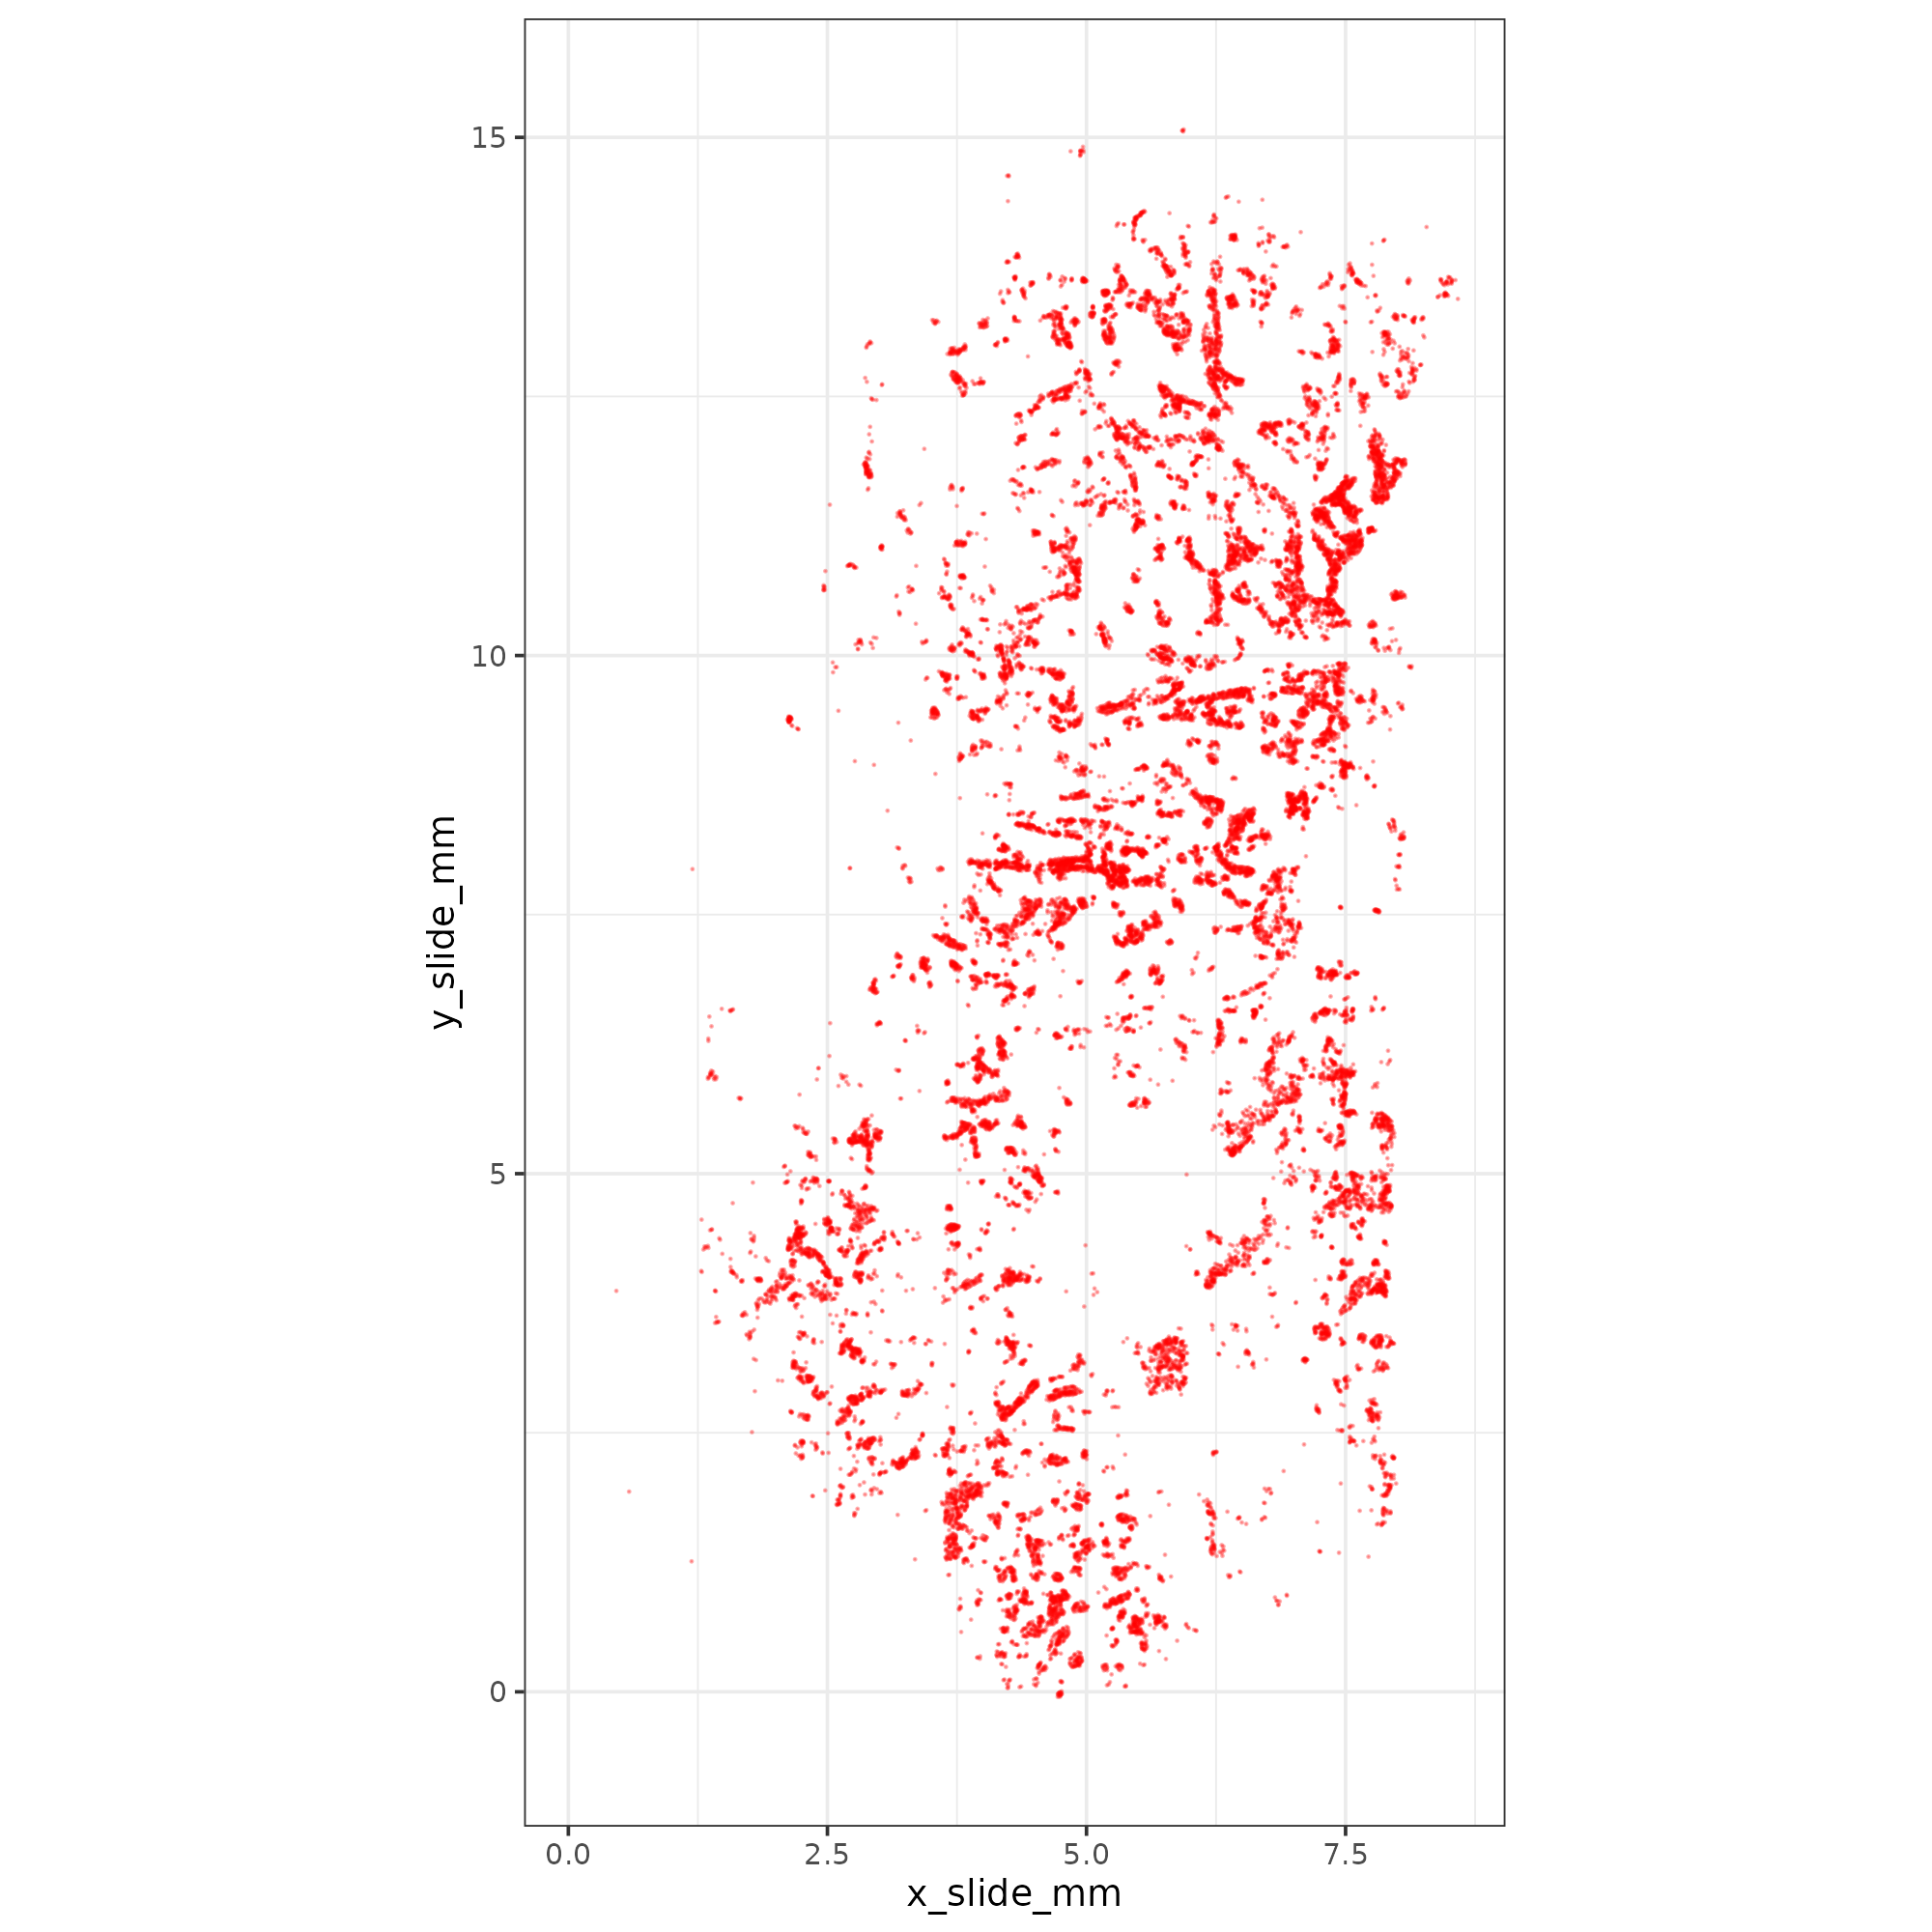
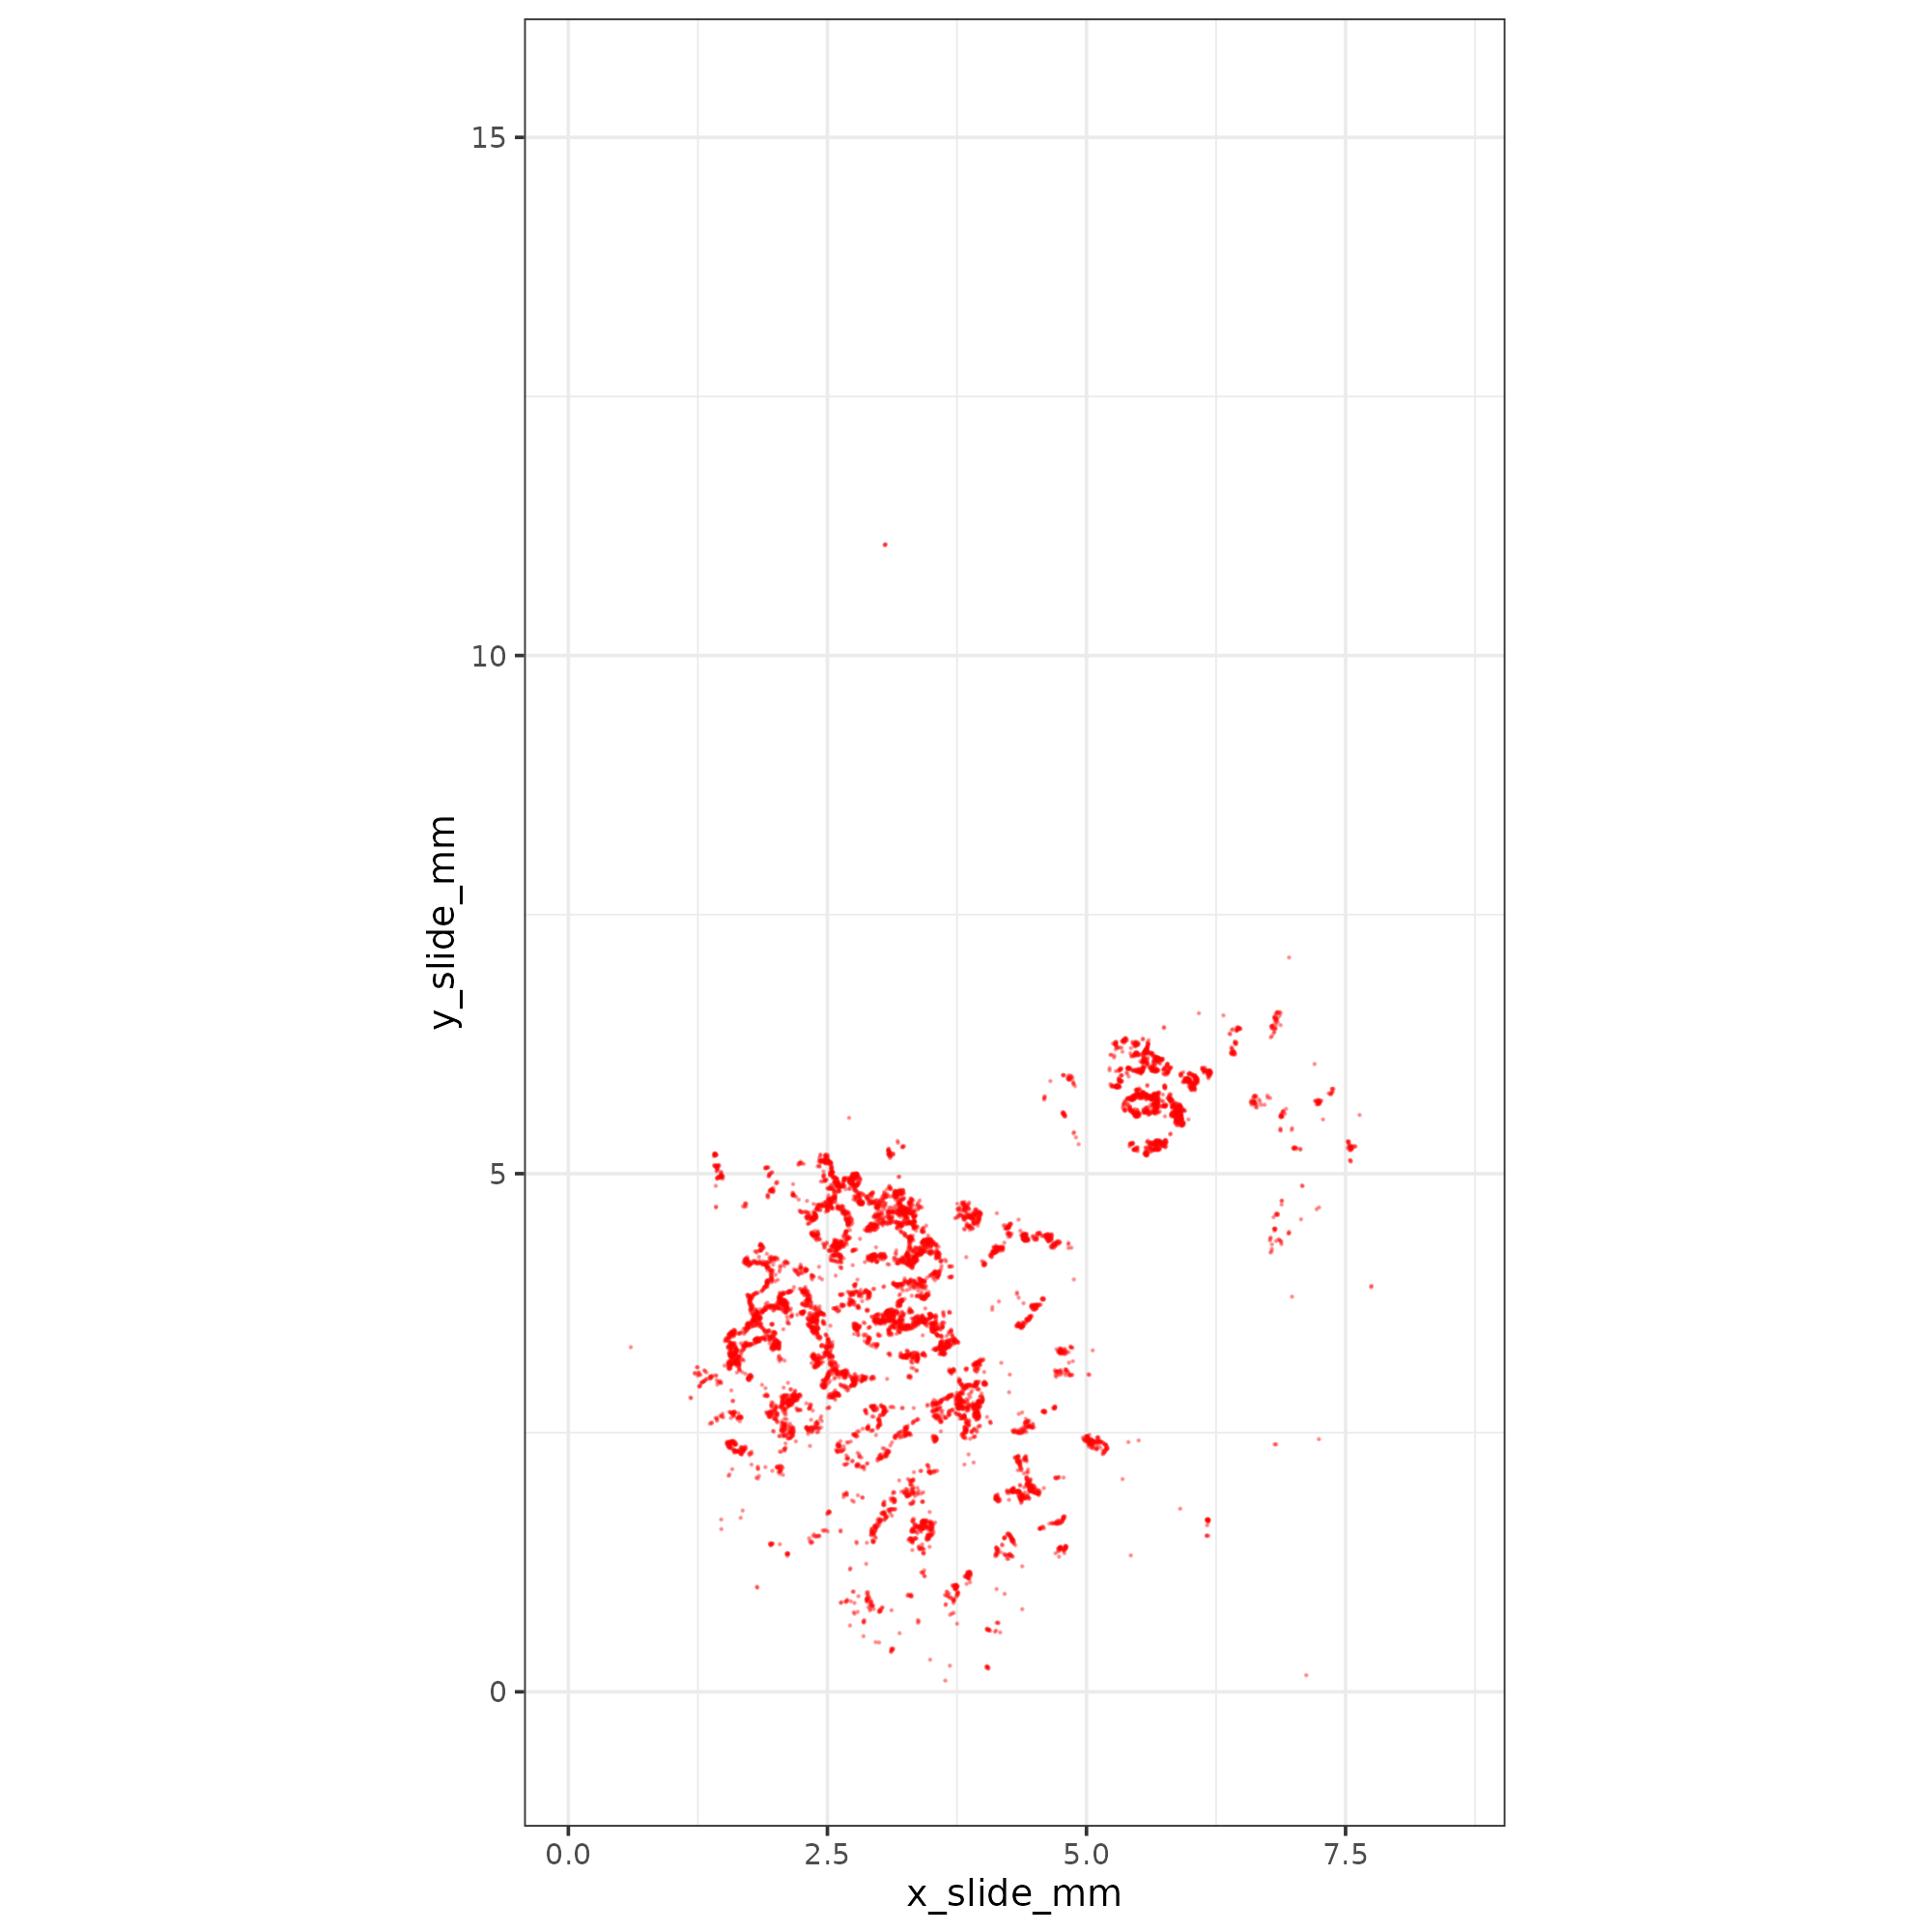
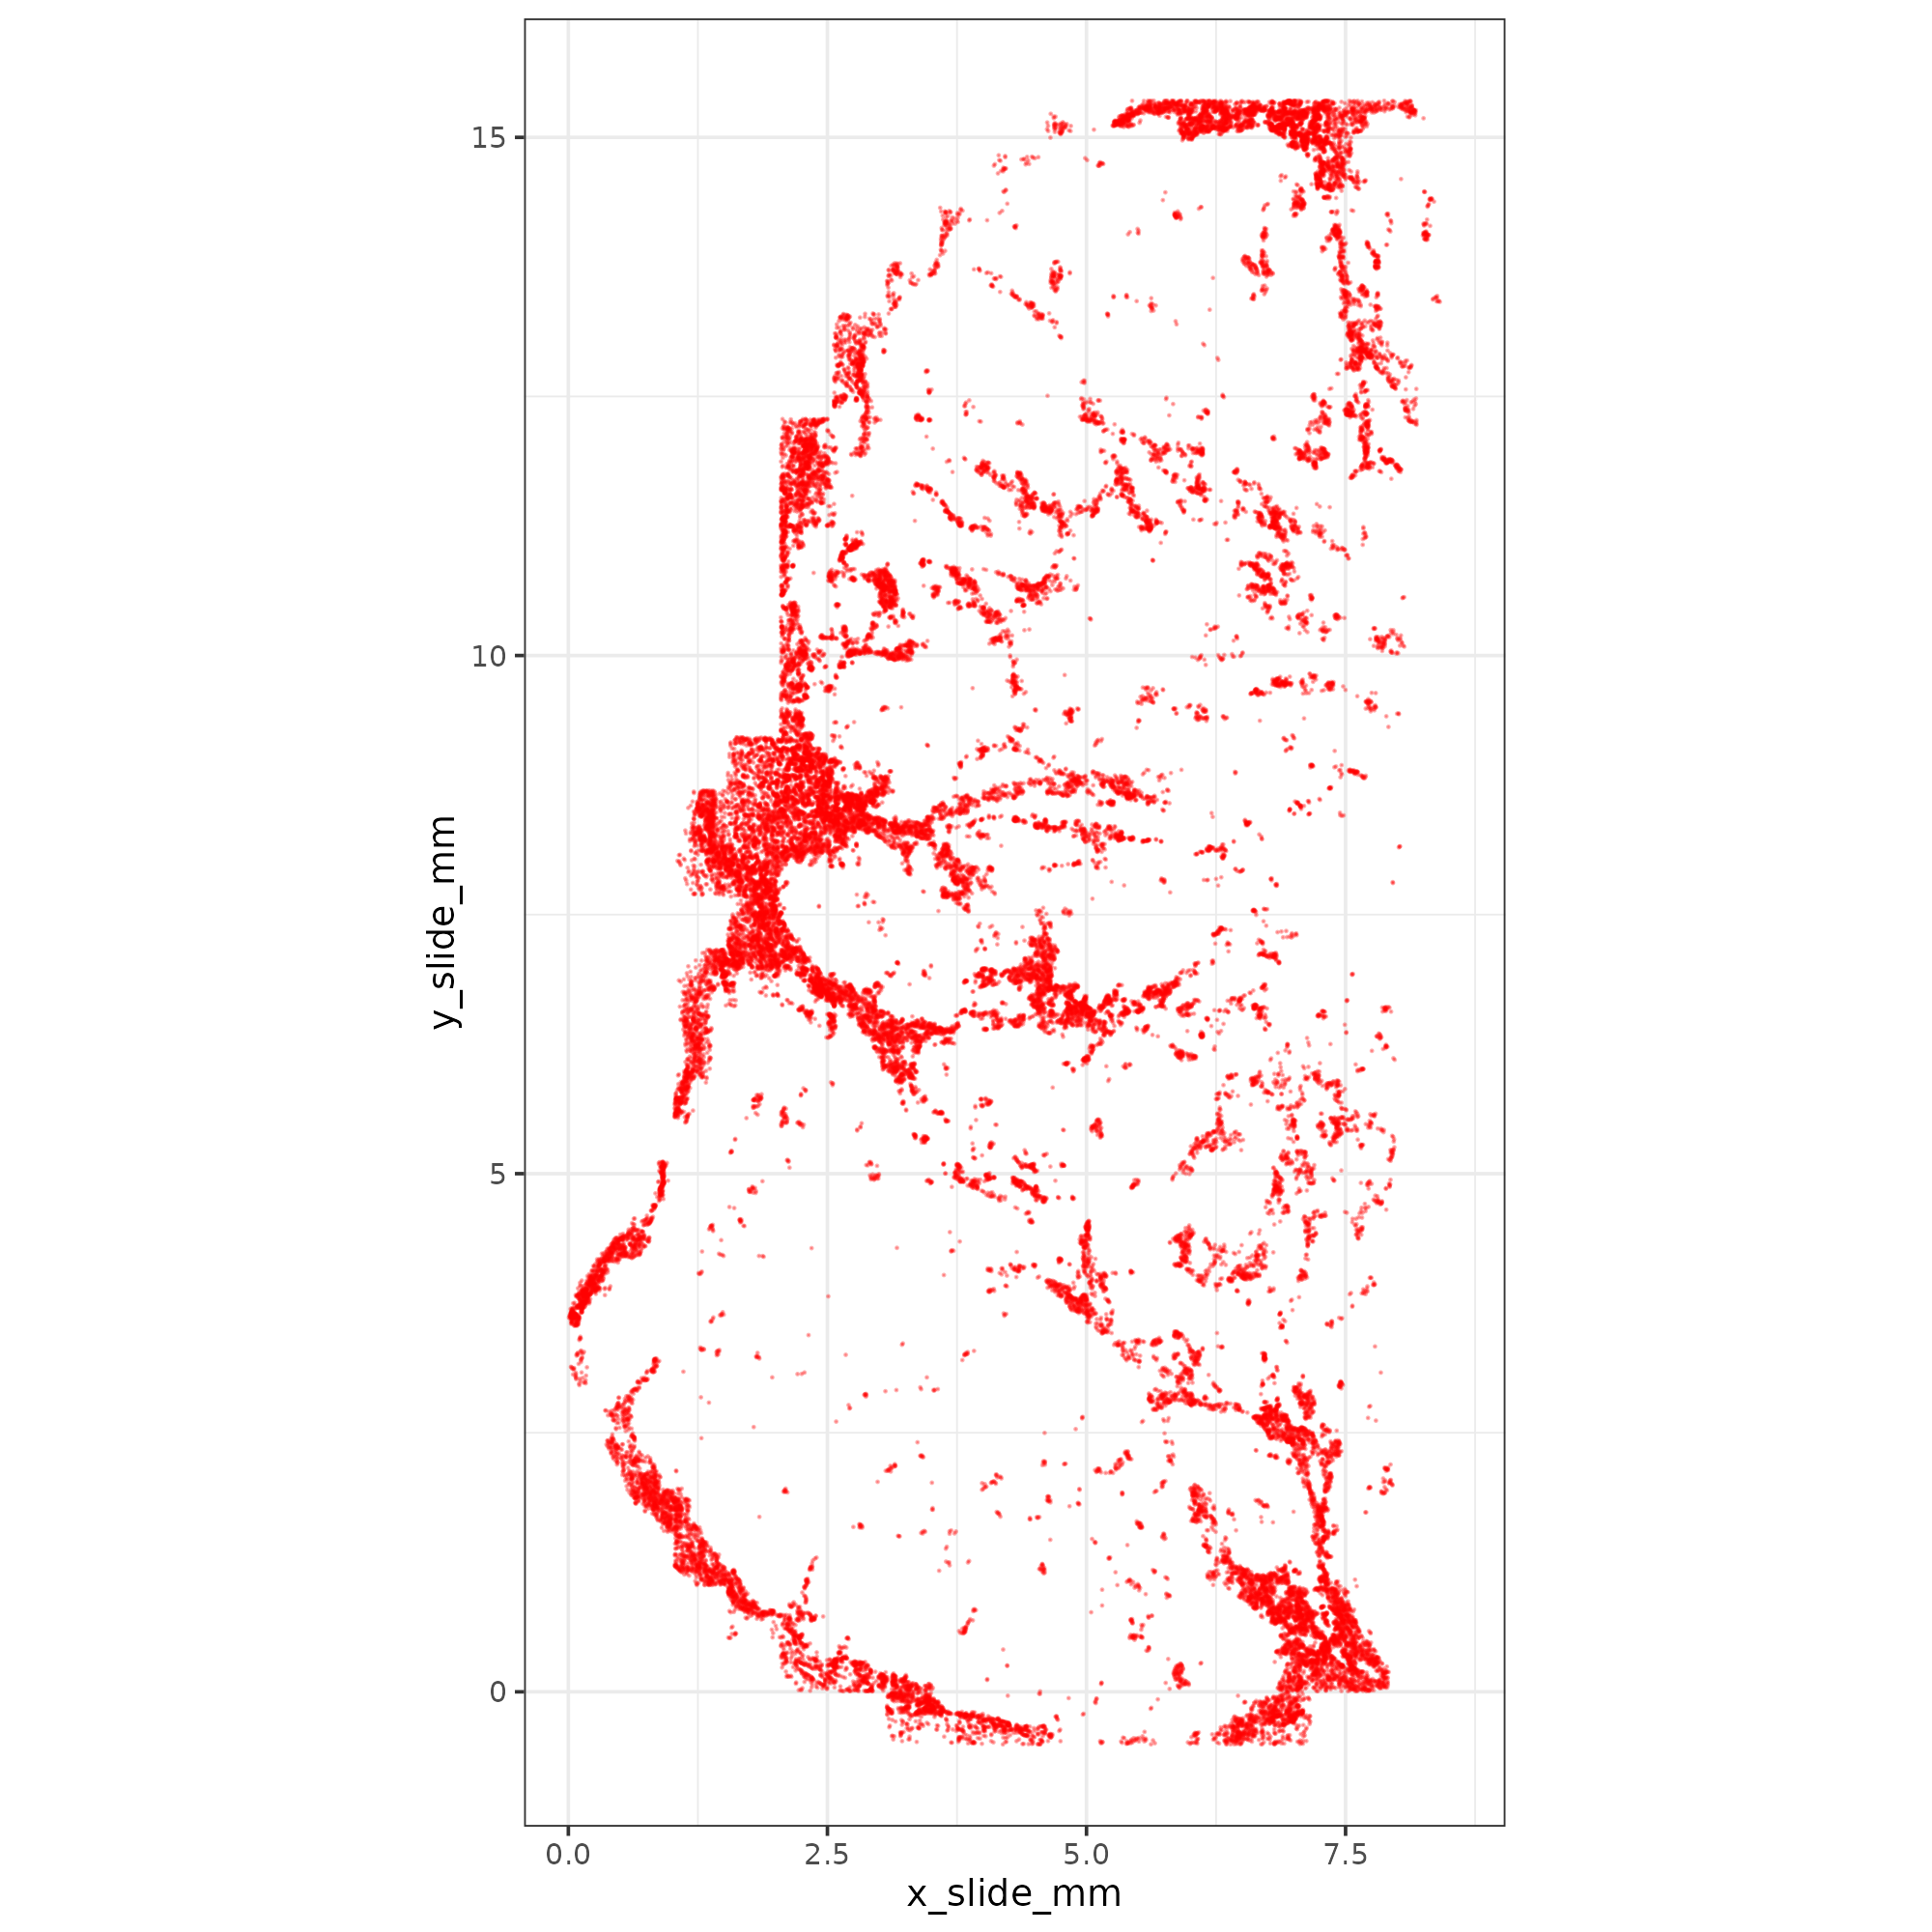
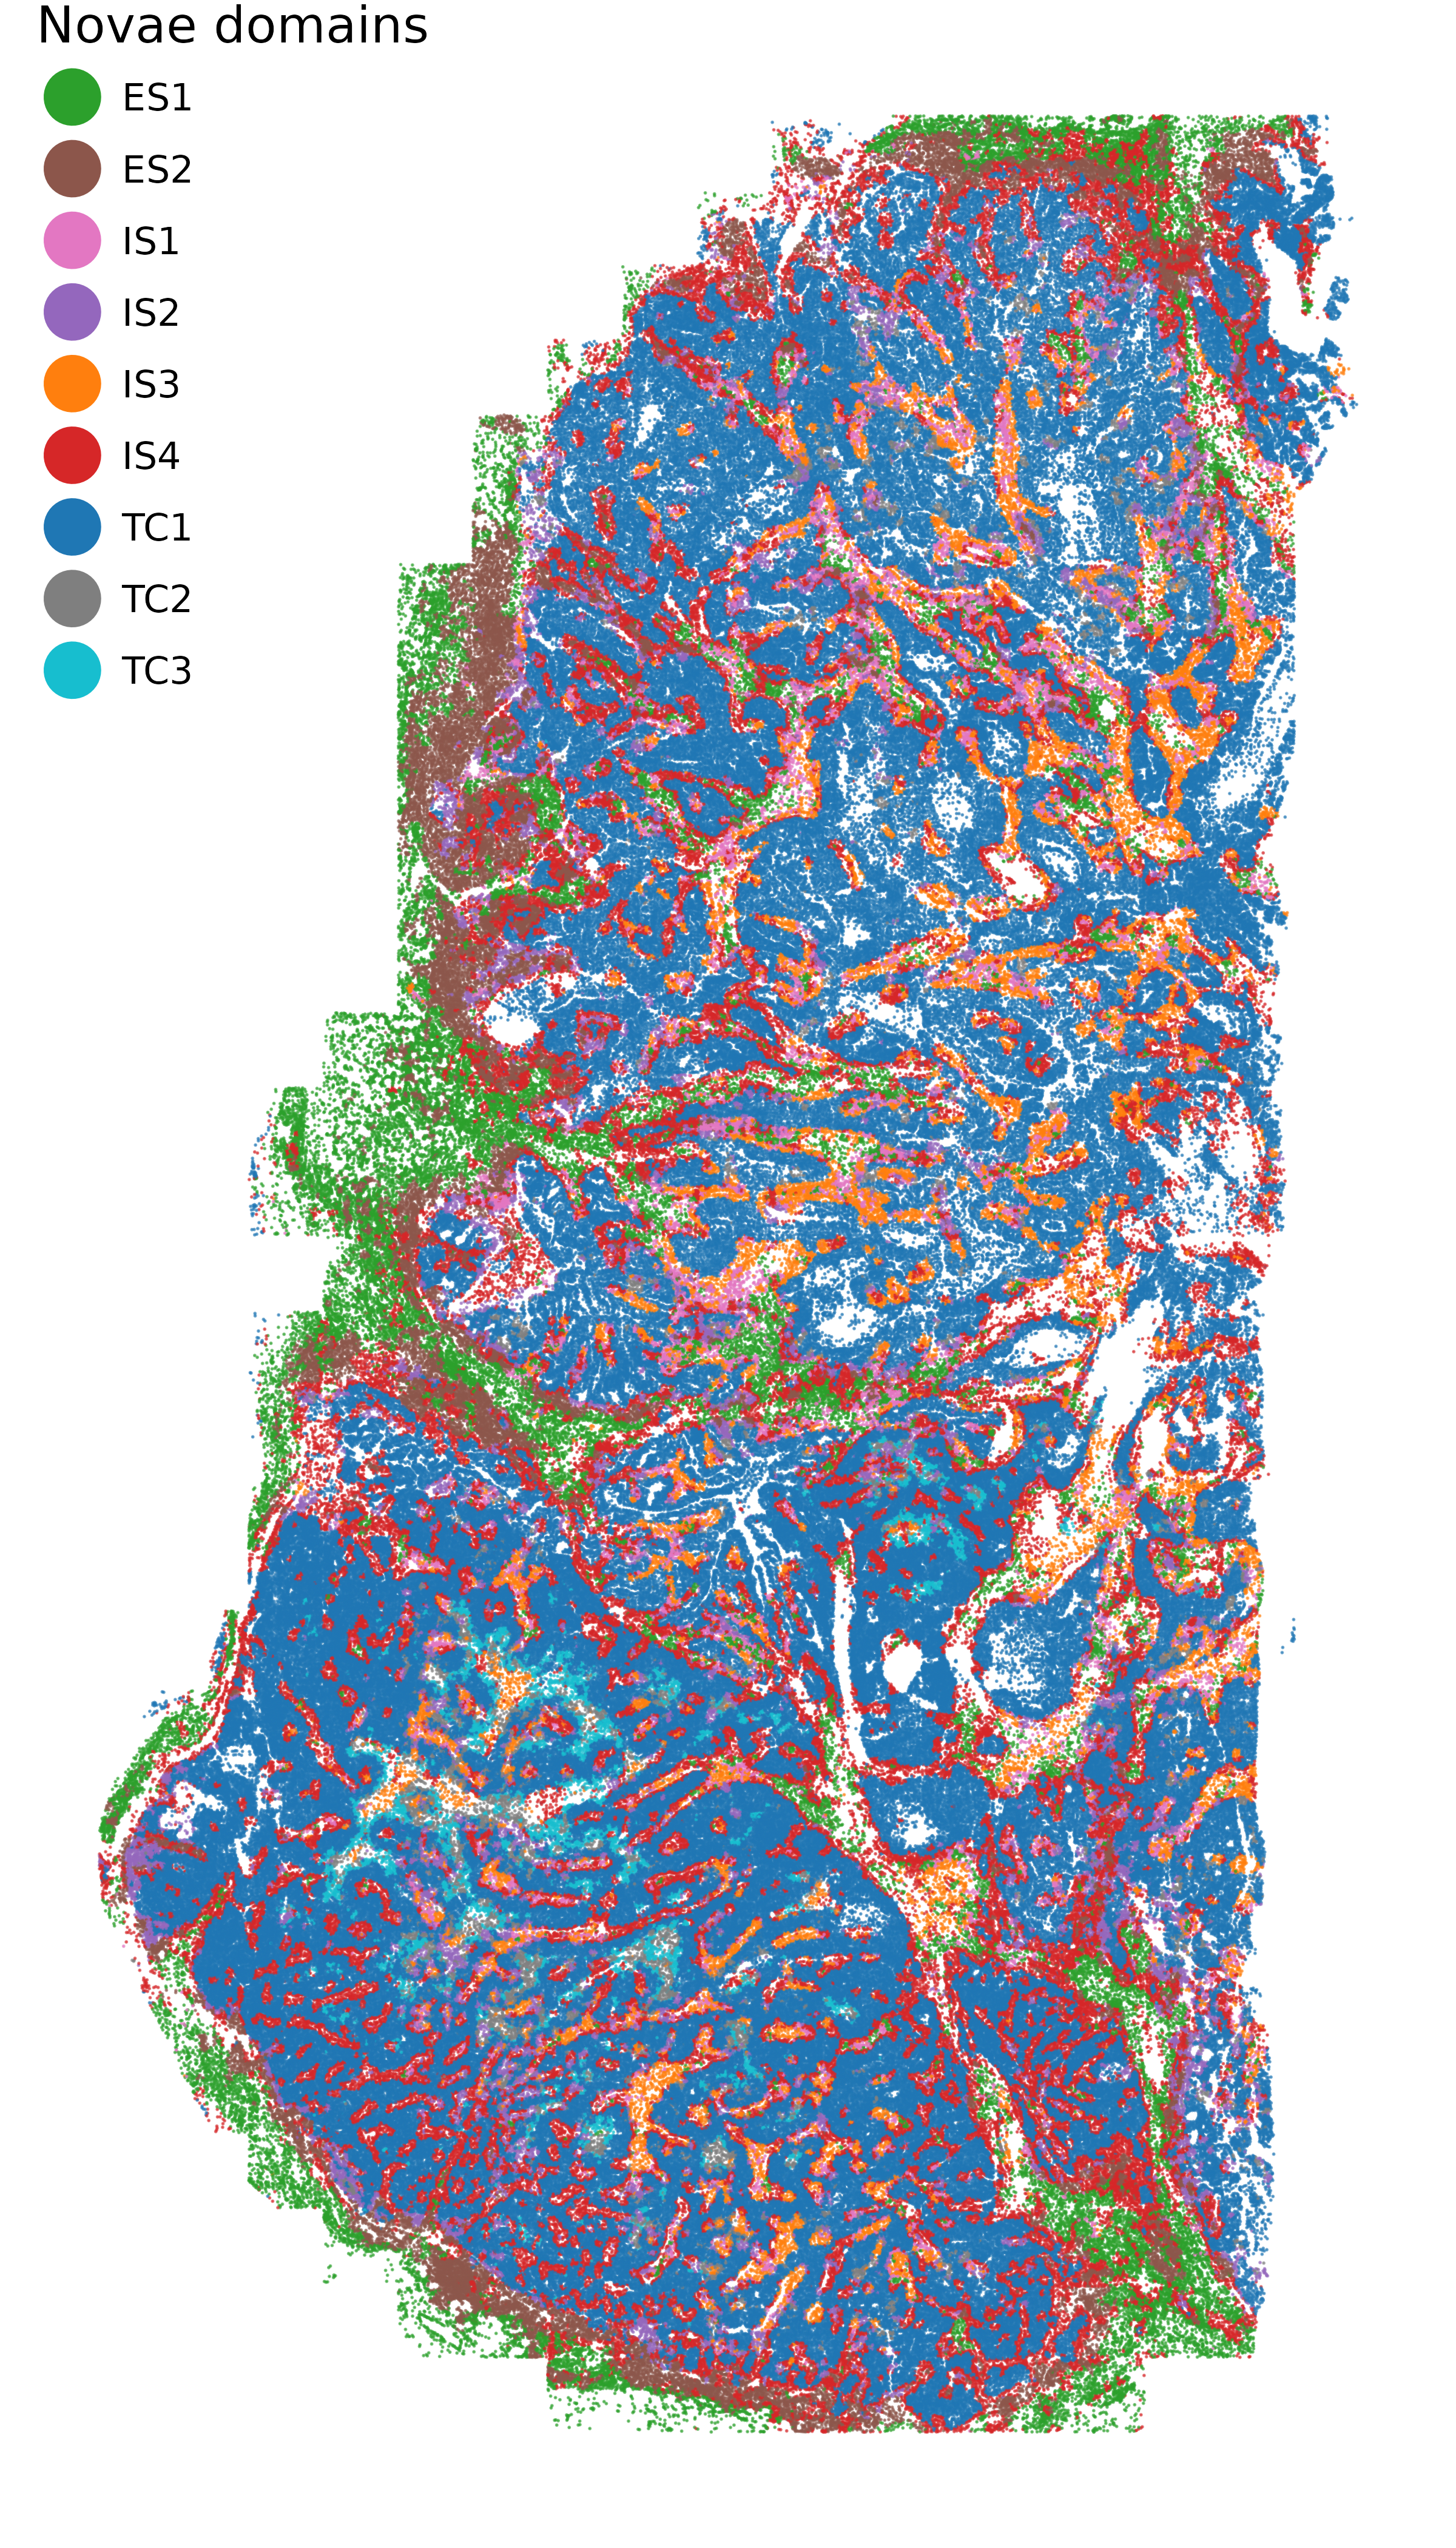
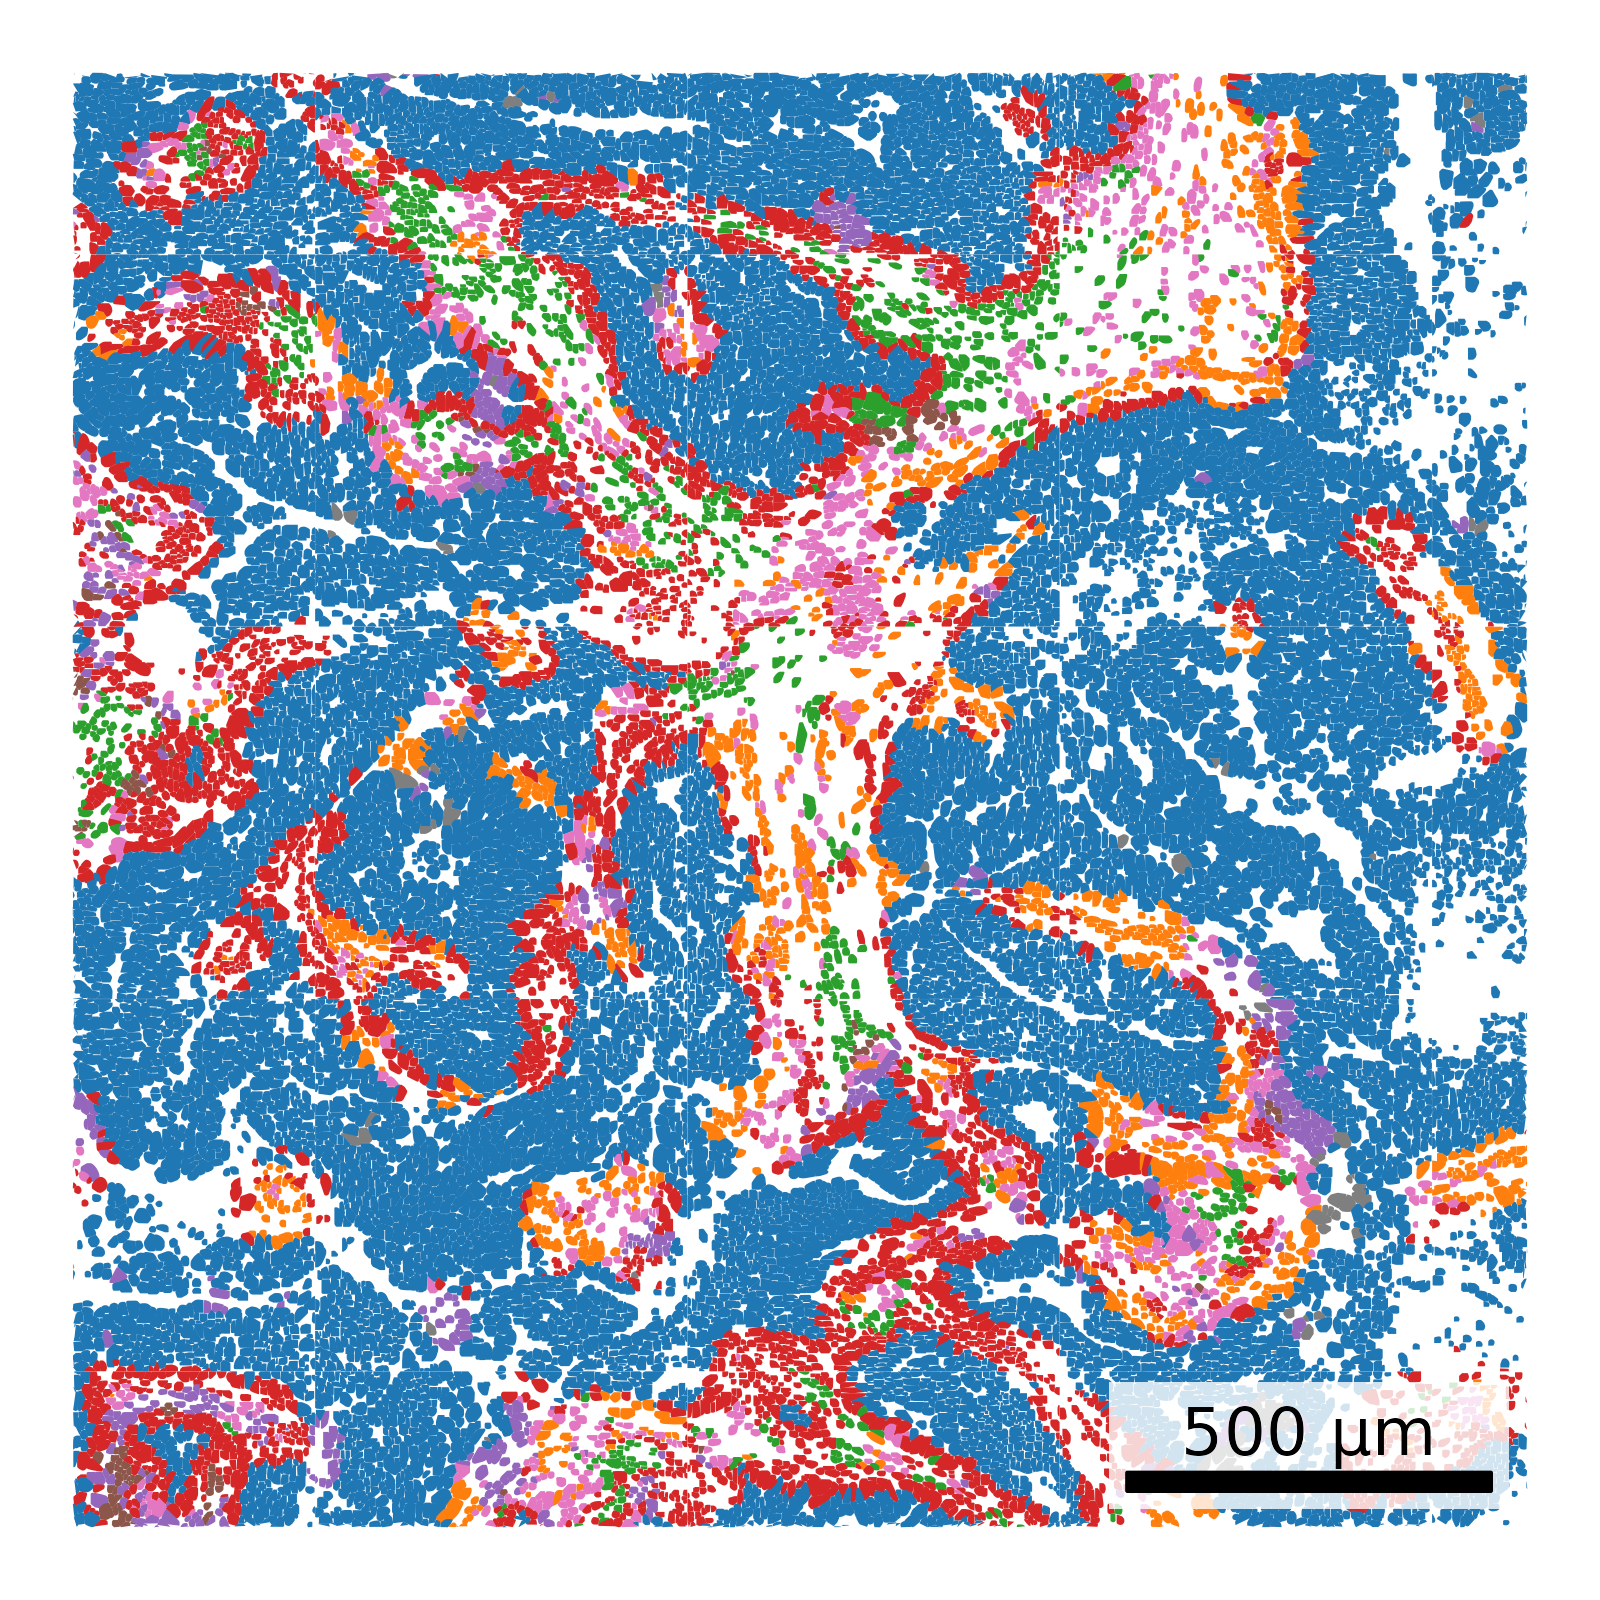
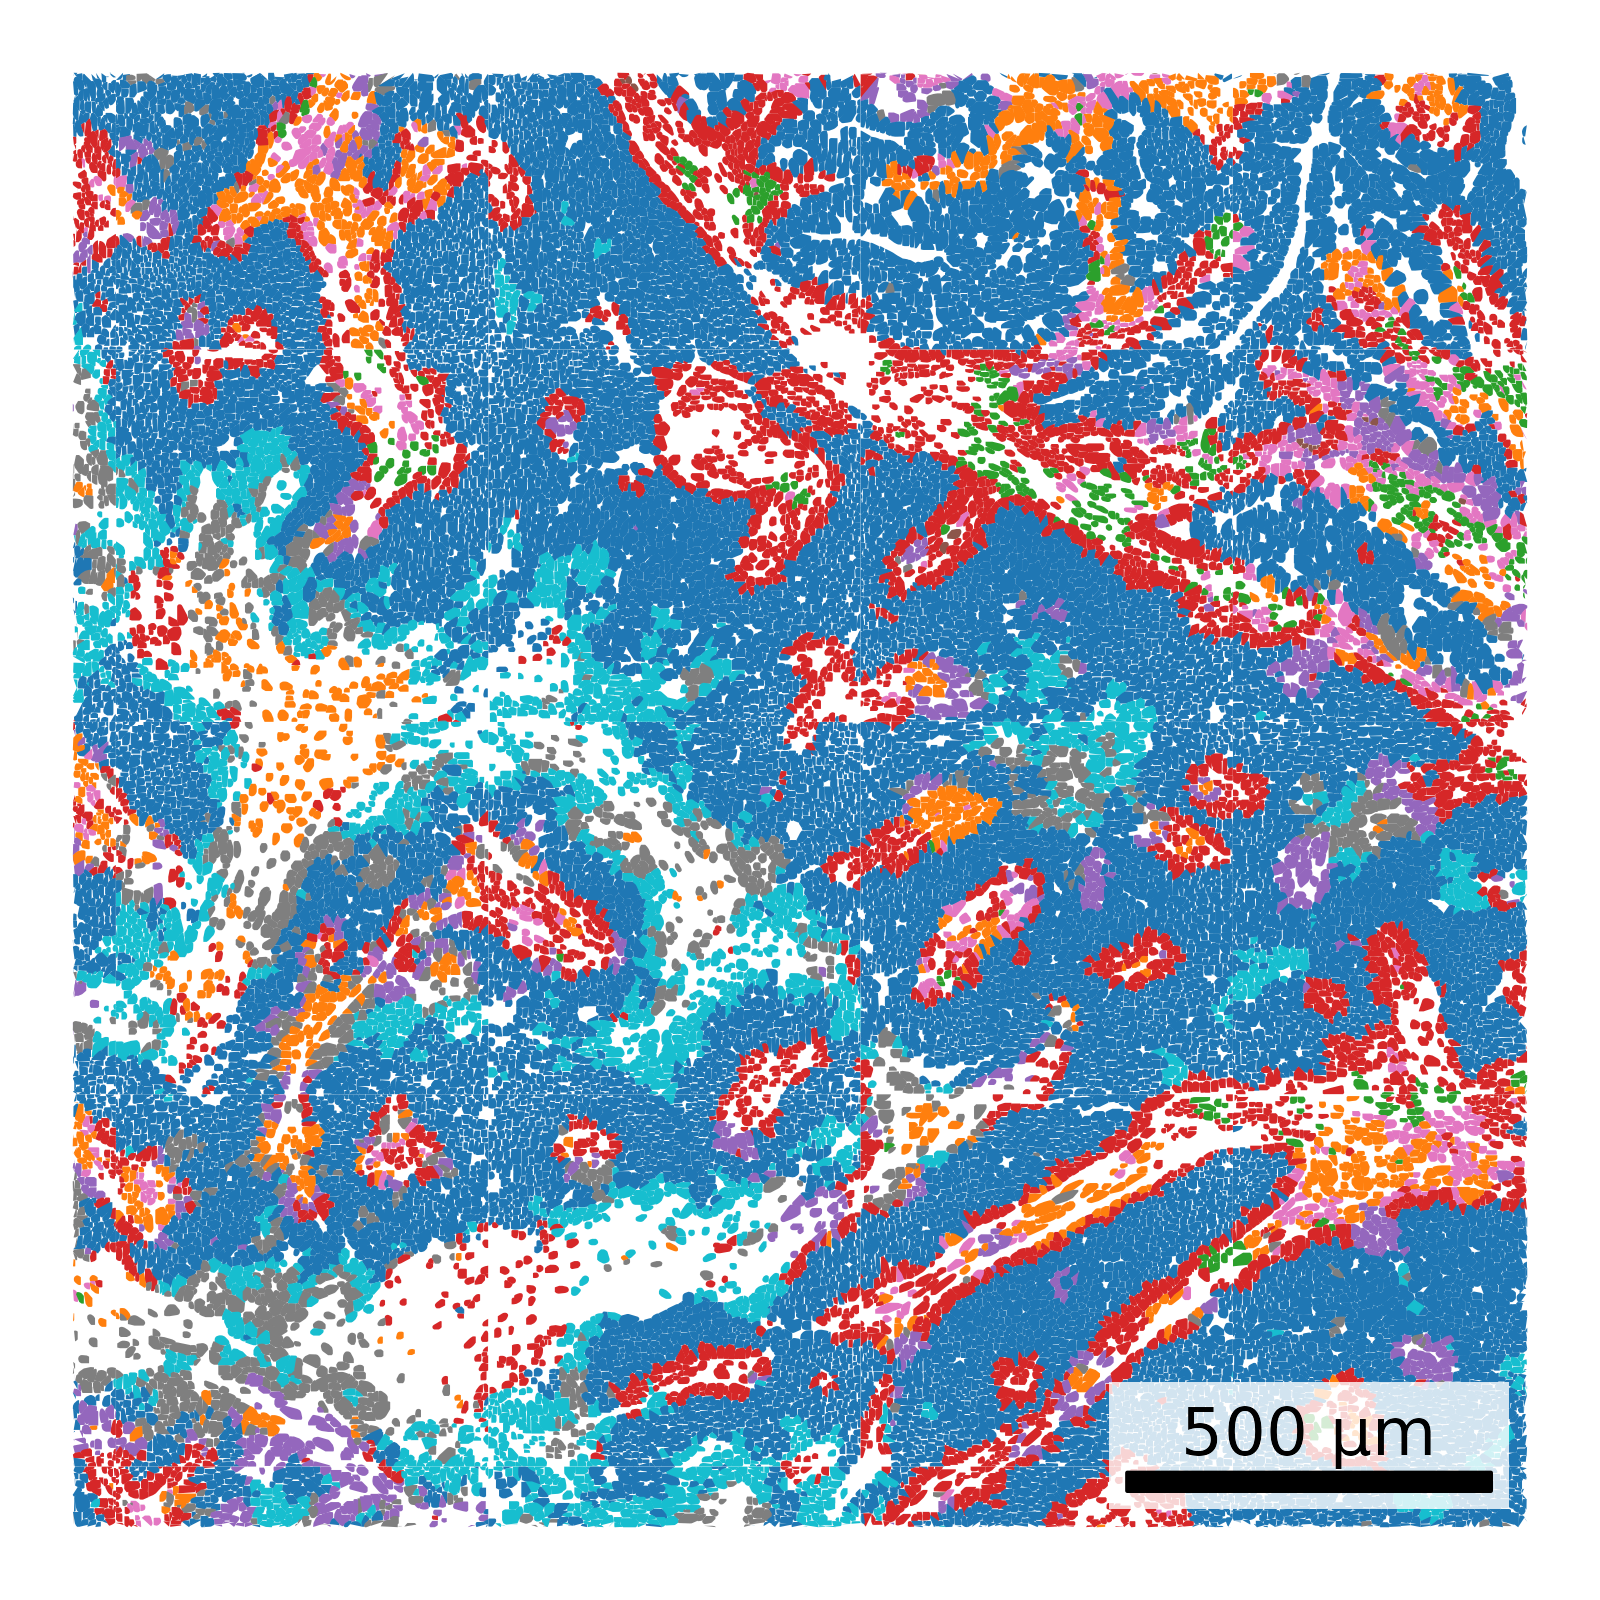
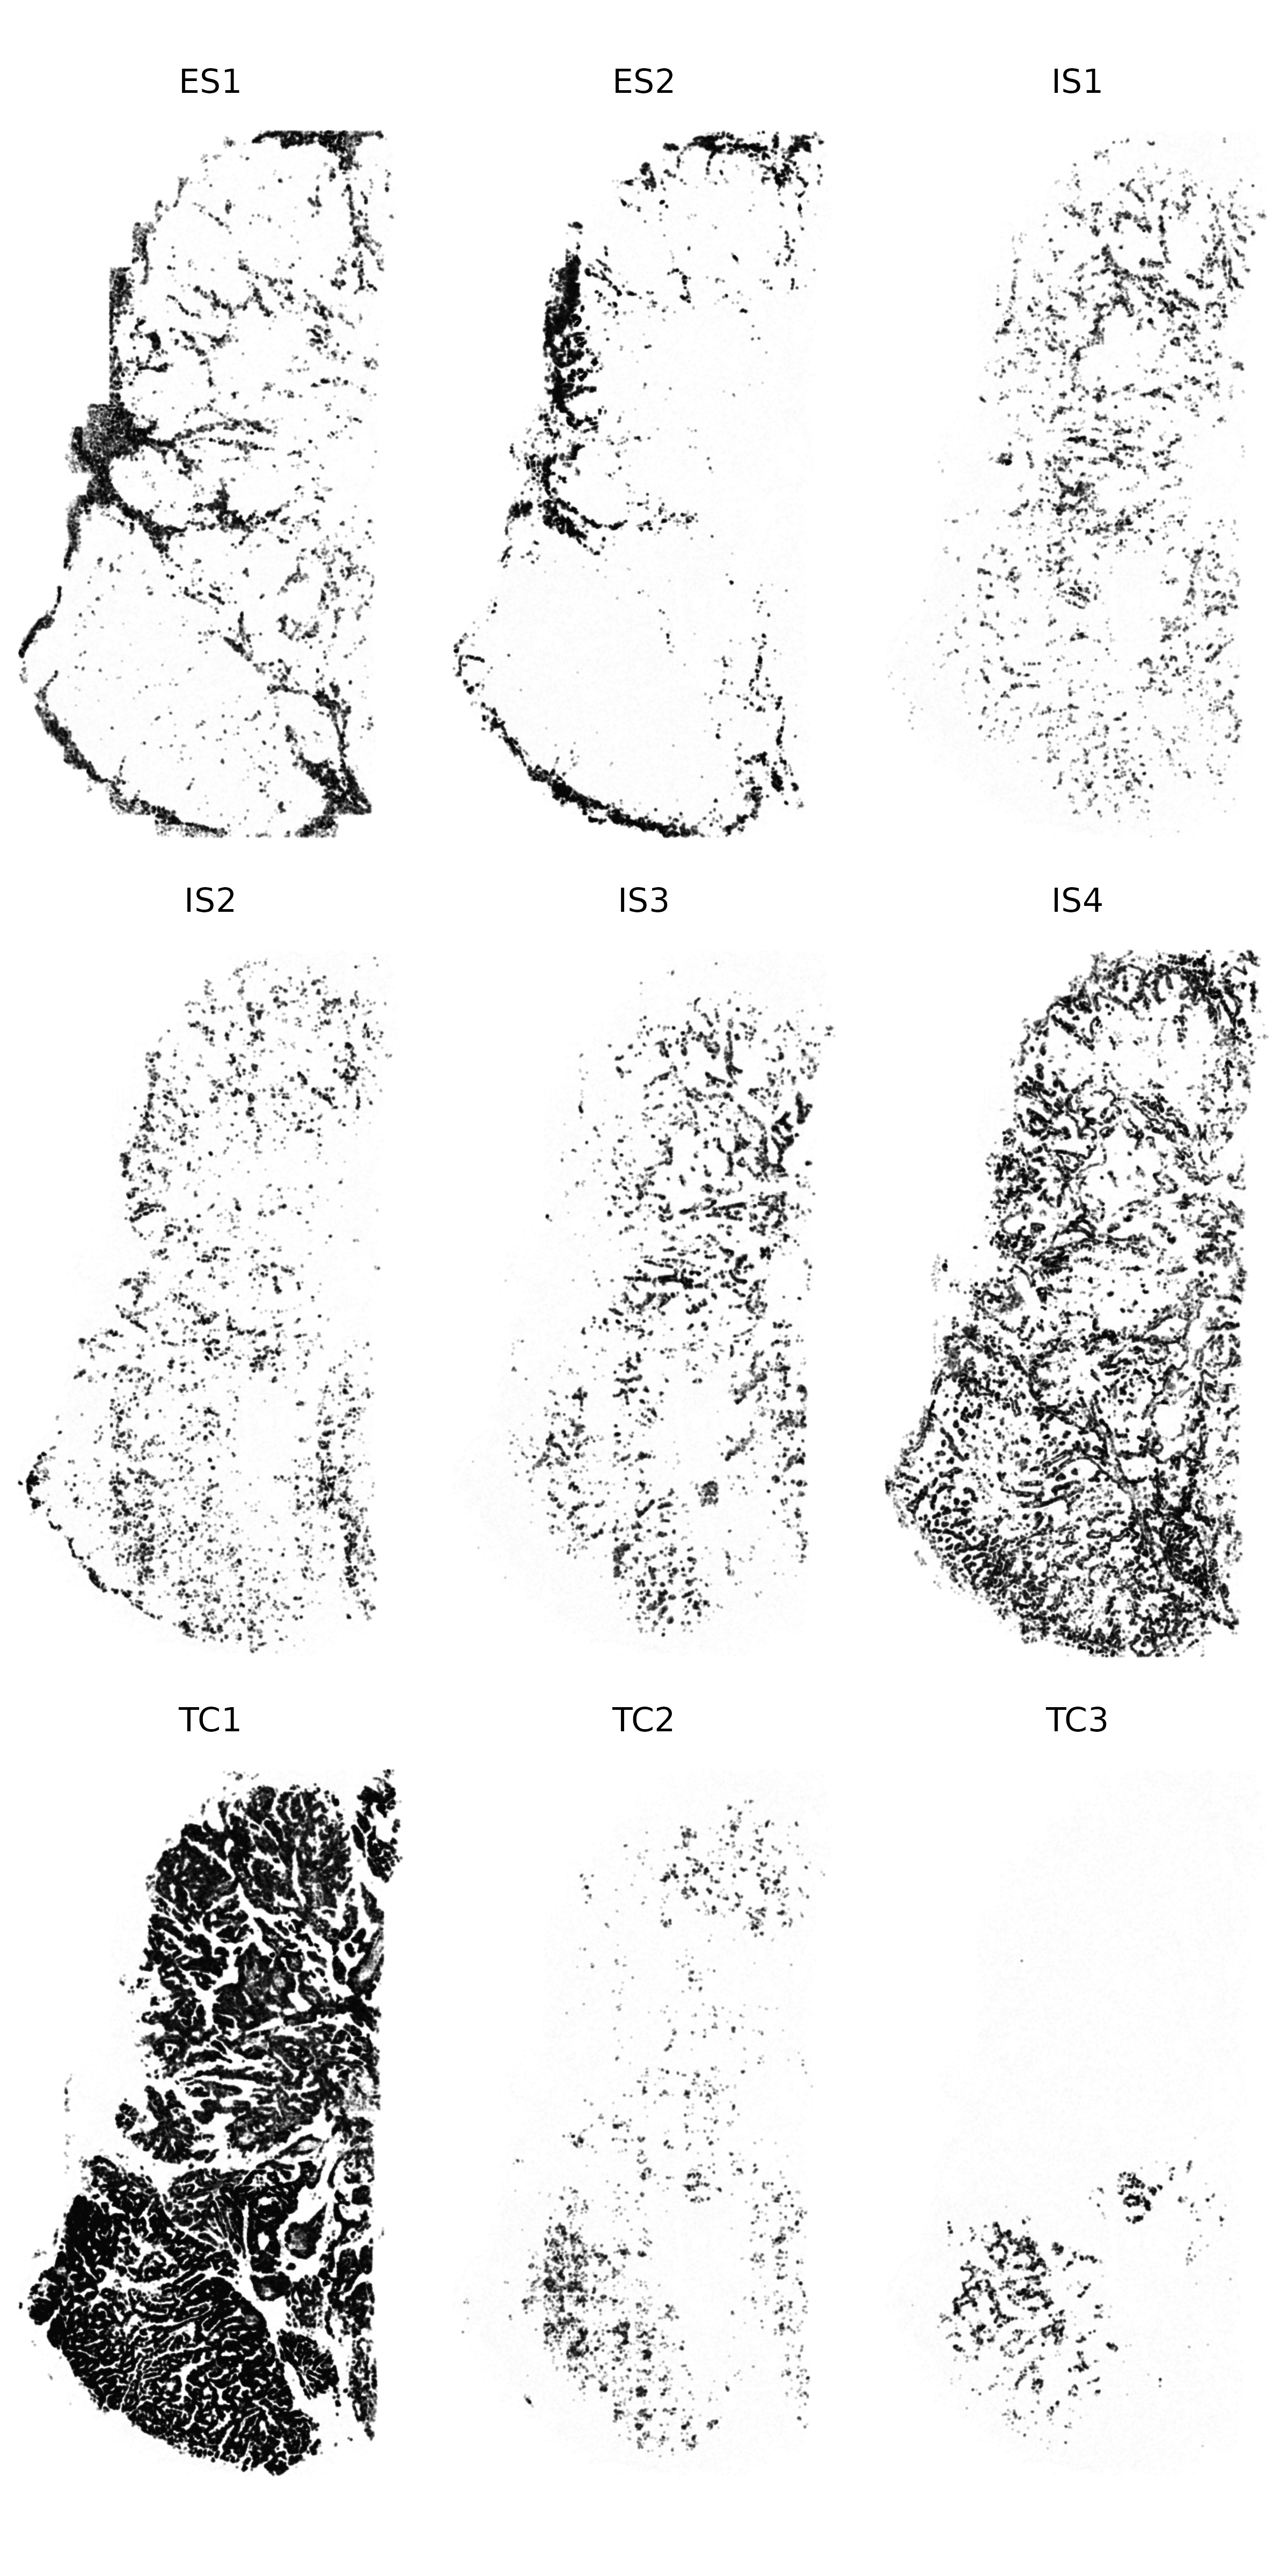
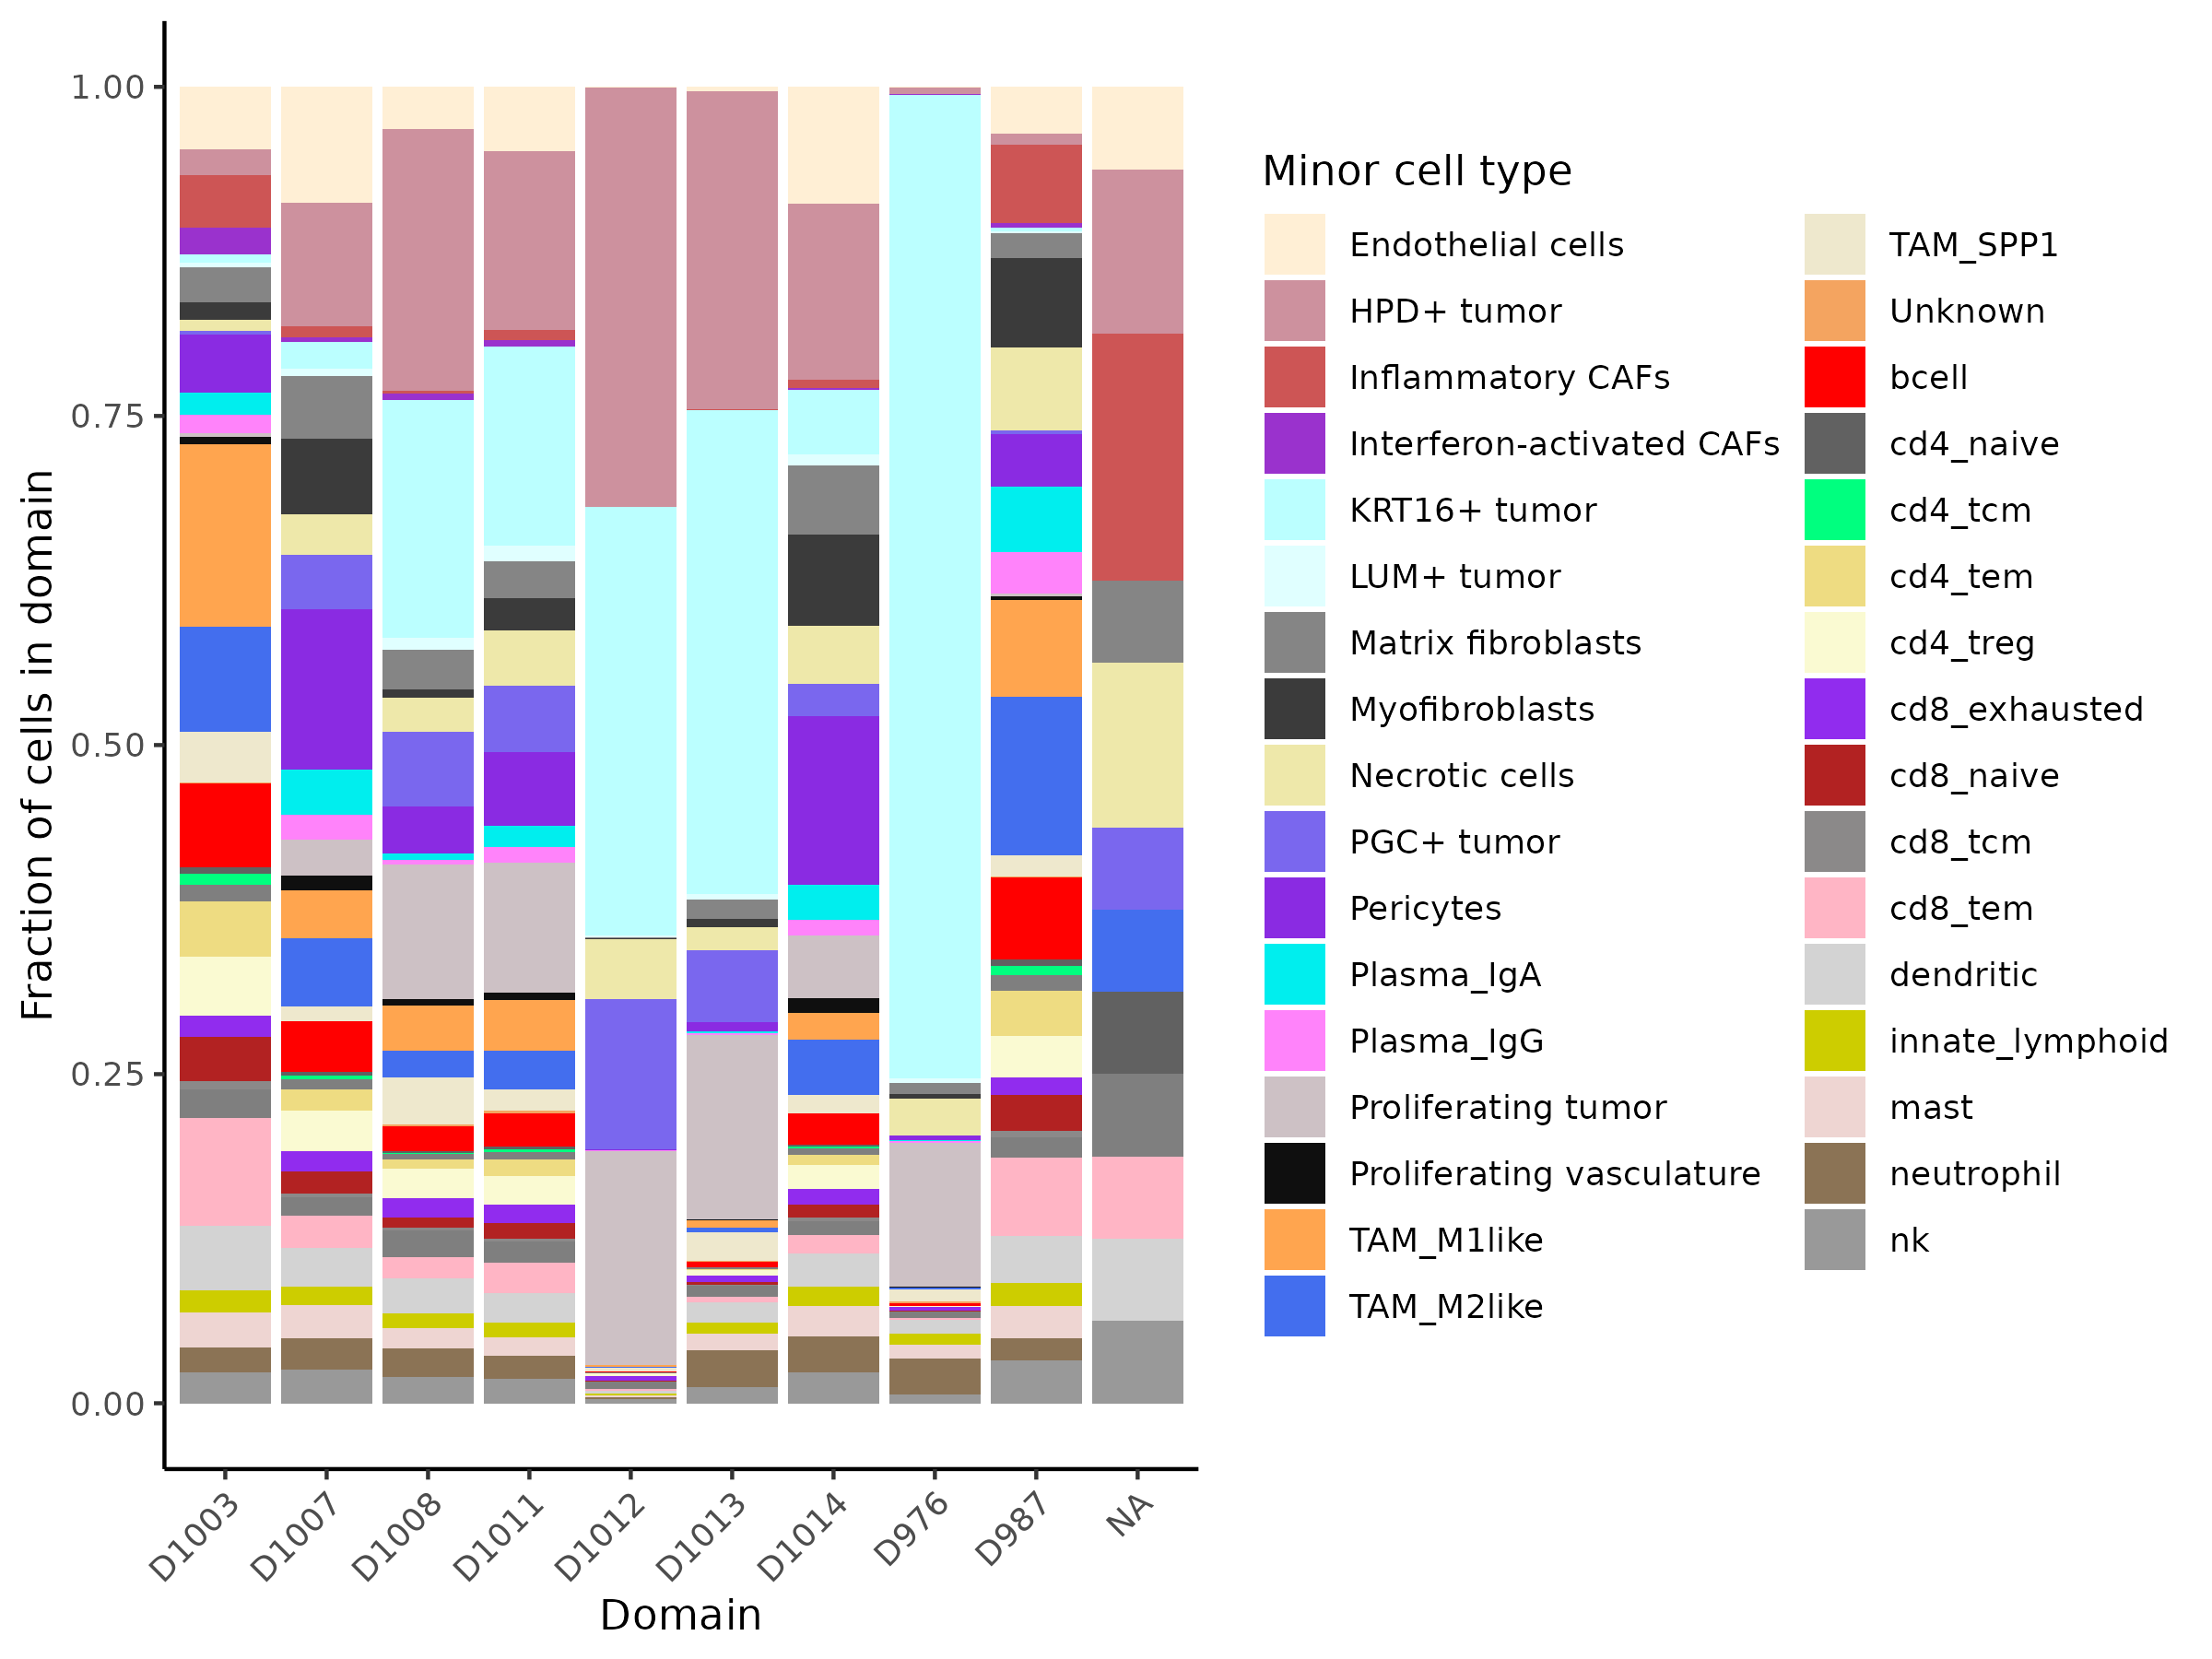
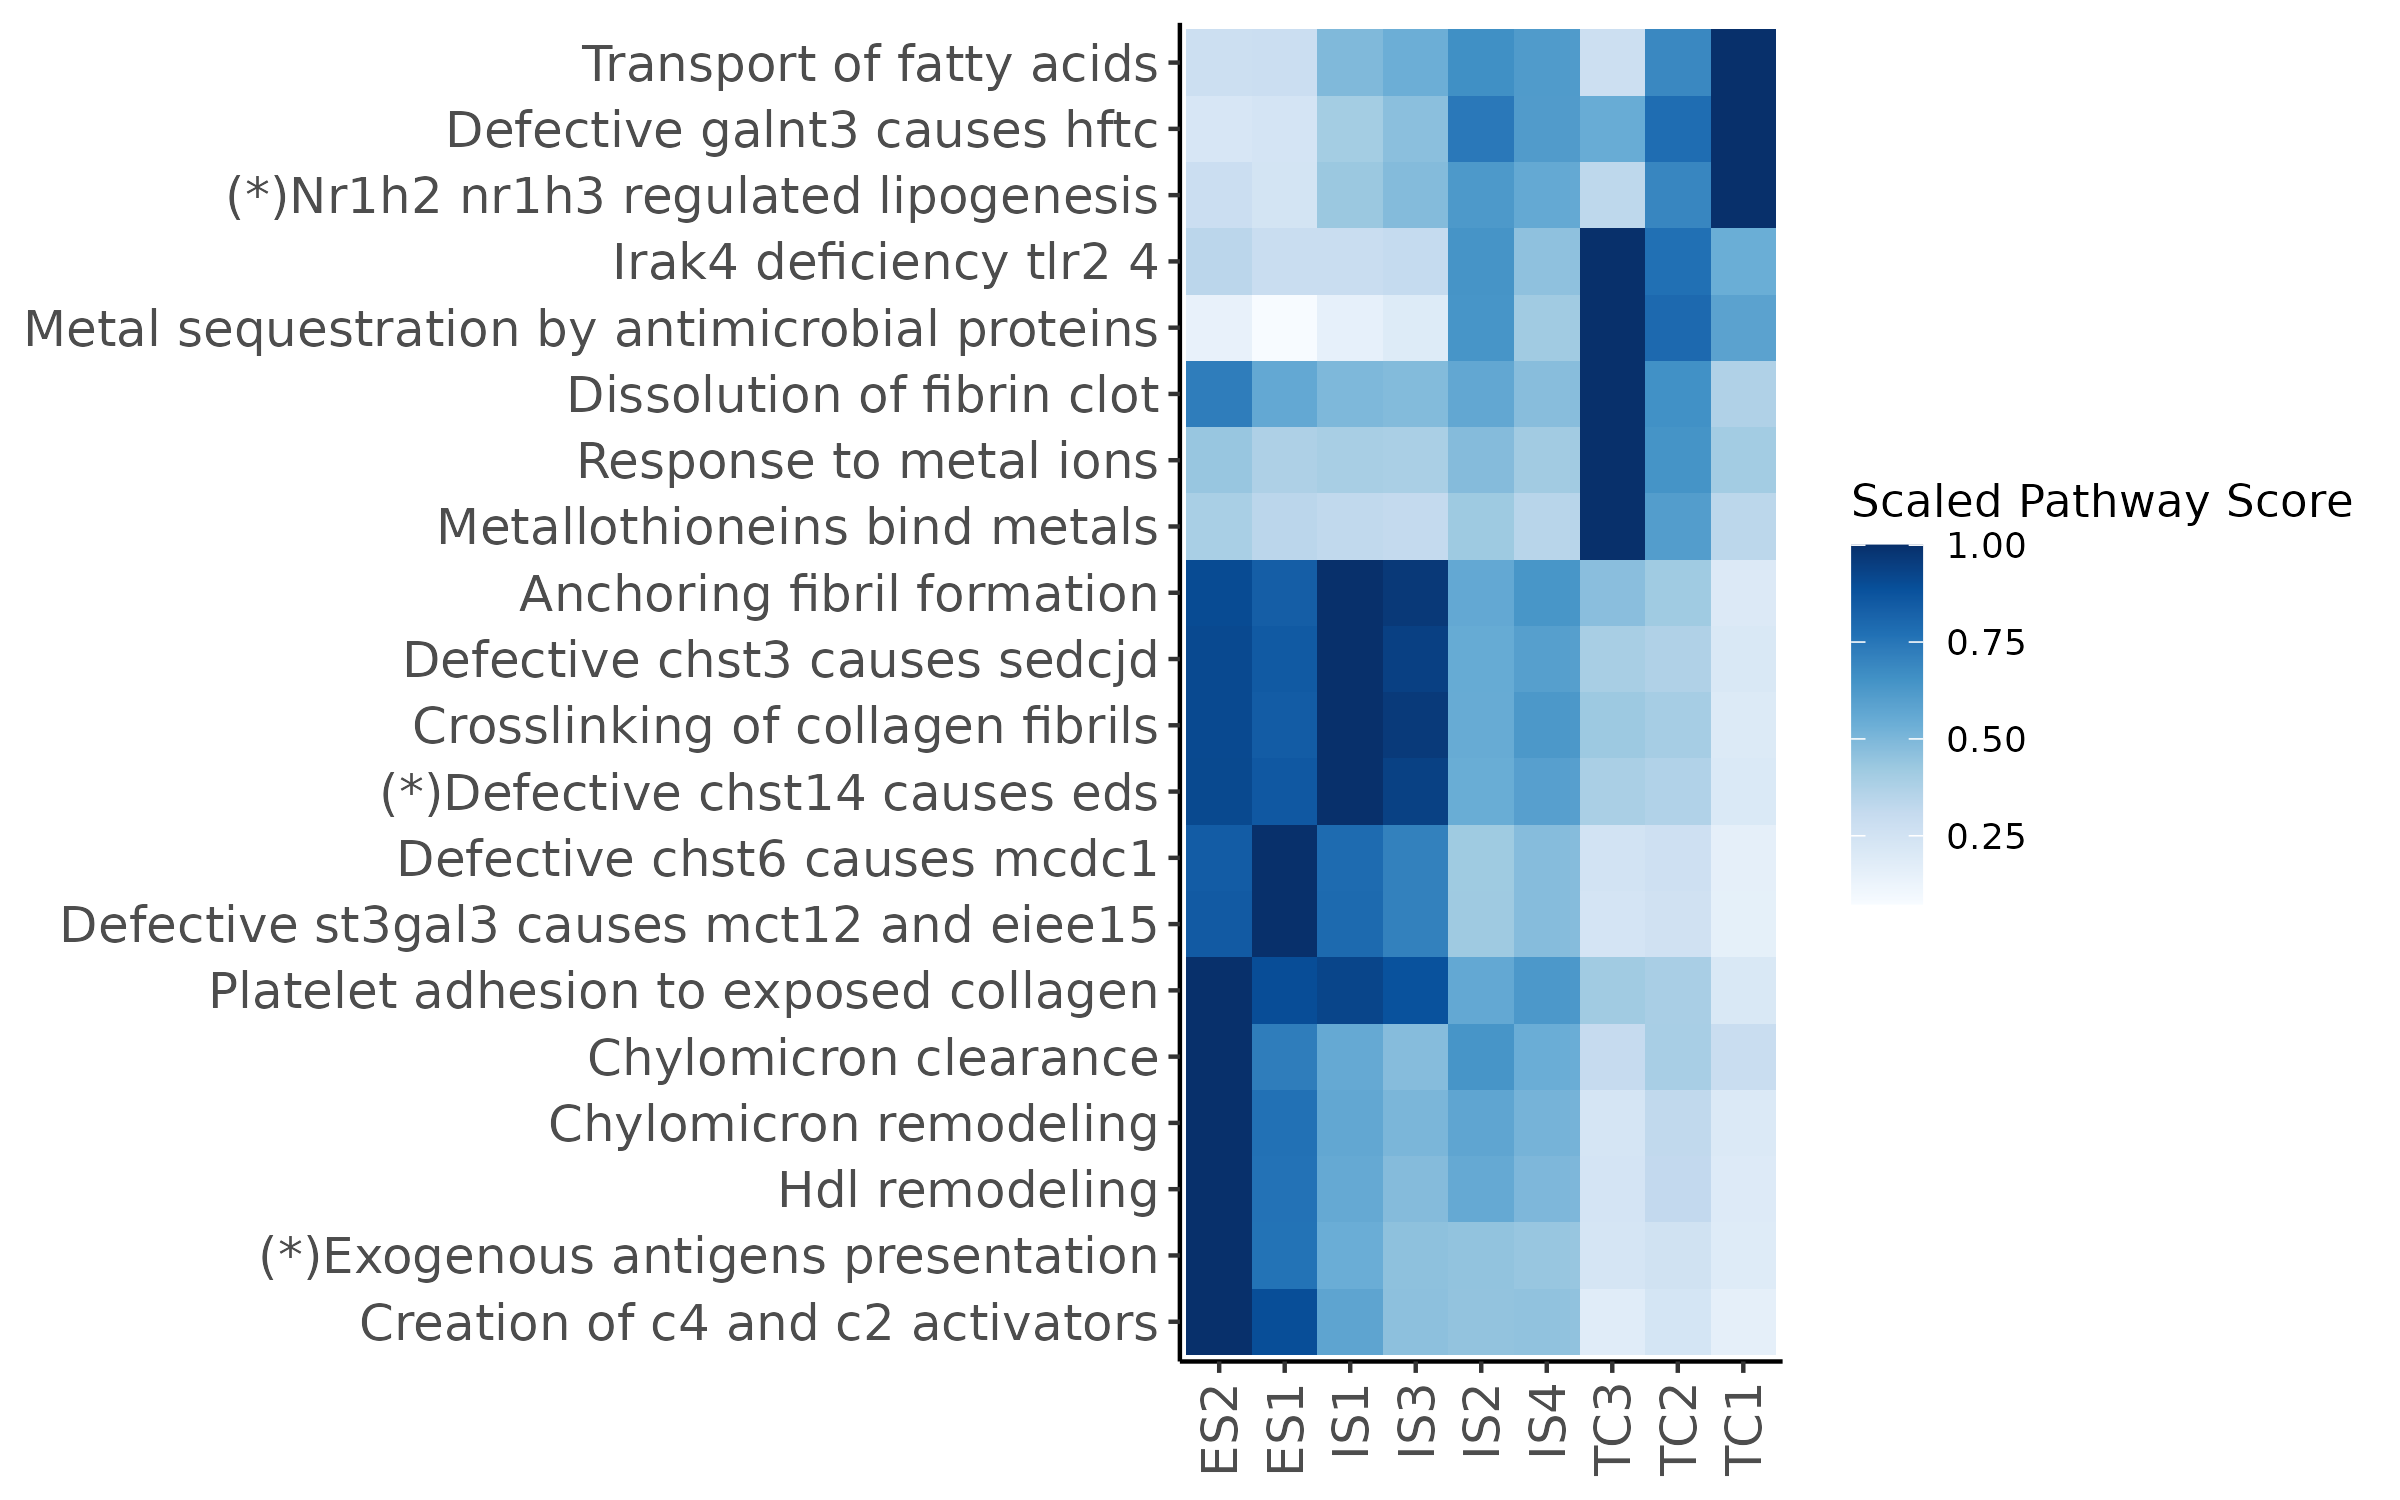
In this section, we use Novae to identify spatial domains within this dataset.
As this package is written in python, we start by generating an adata object from our filtered Seurat object.
Show the code
# if there's no seurat object, read it inif (!("seu.obj"%in%ls())){ seu.obj <-readRDS(results_list$seurat_file_postCellTyping)}# Convert to single cell experimentsce <-as.SingleCellExperiment(seu.obj)# Save as h5adh5ad_path <-paste0(objects_dir, "/assay_data.h5ad")writeH5AD(sce, file = h5ad_path, X_name ="counts", assay ="counts")
Next, we switch into Python and run novae to generate spatial domains.
Show the code
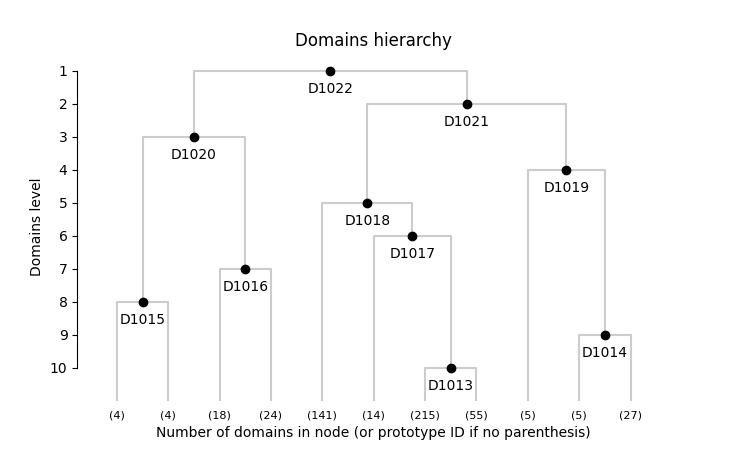
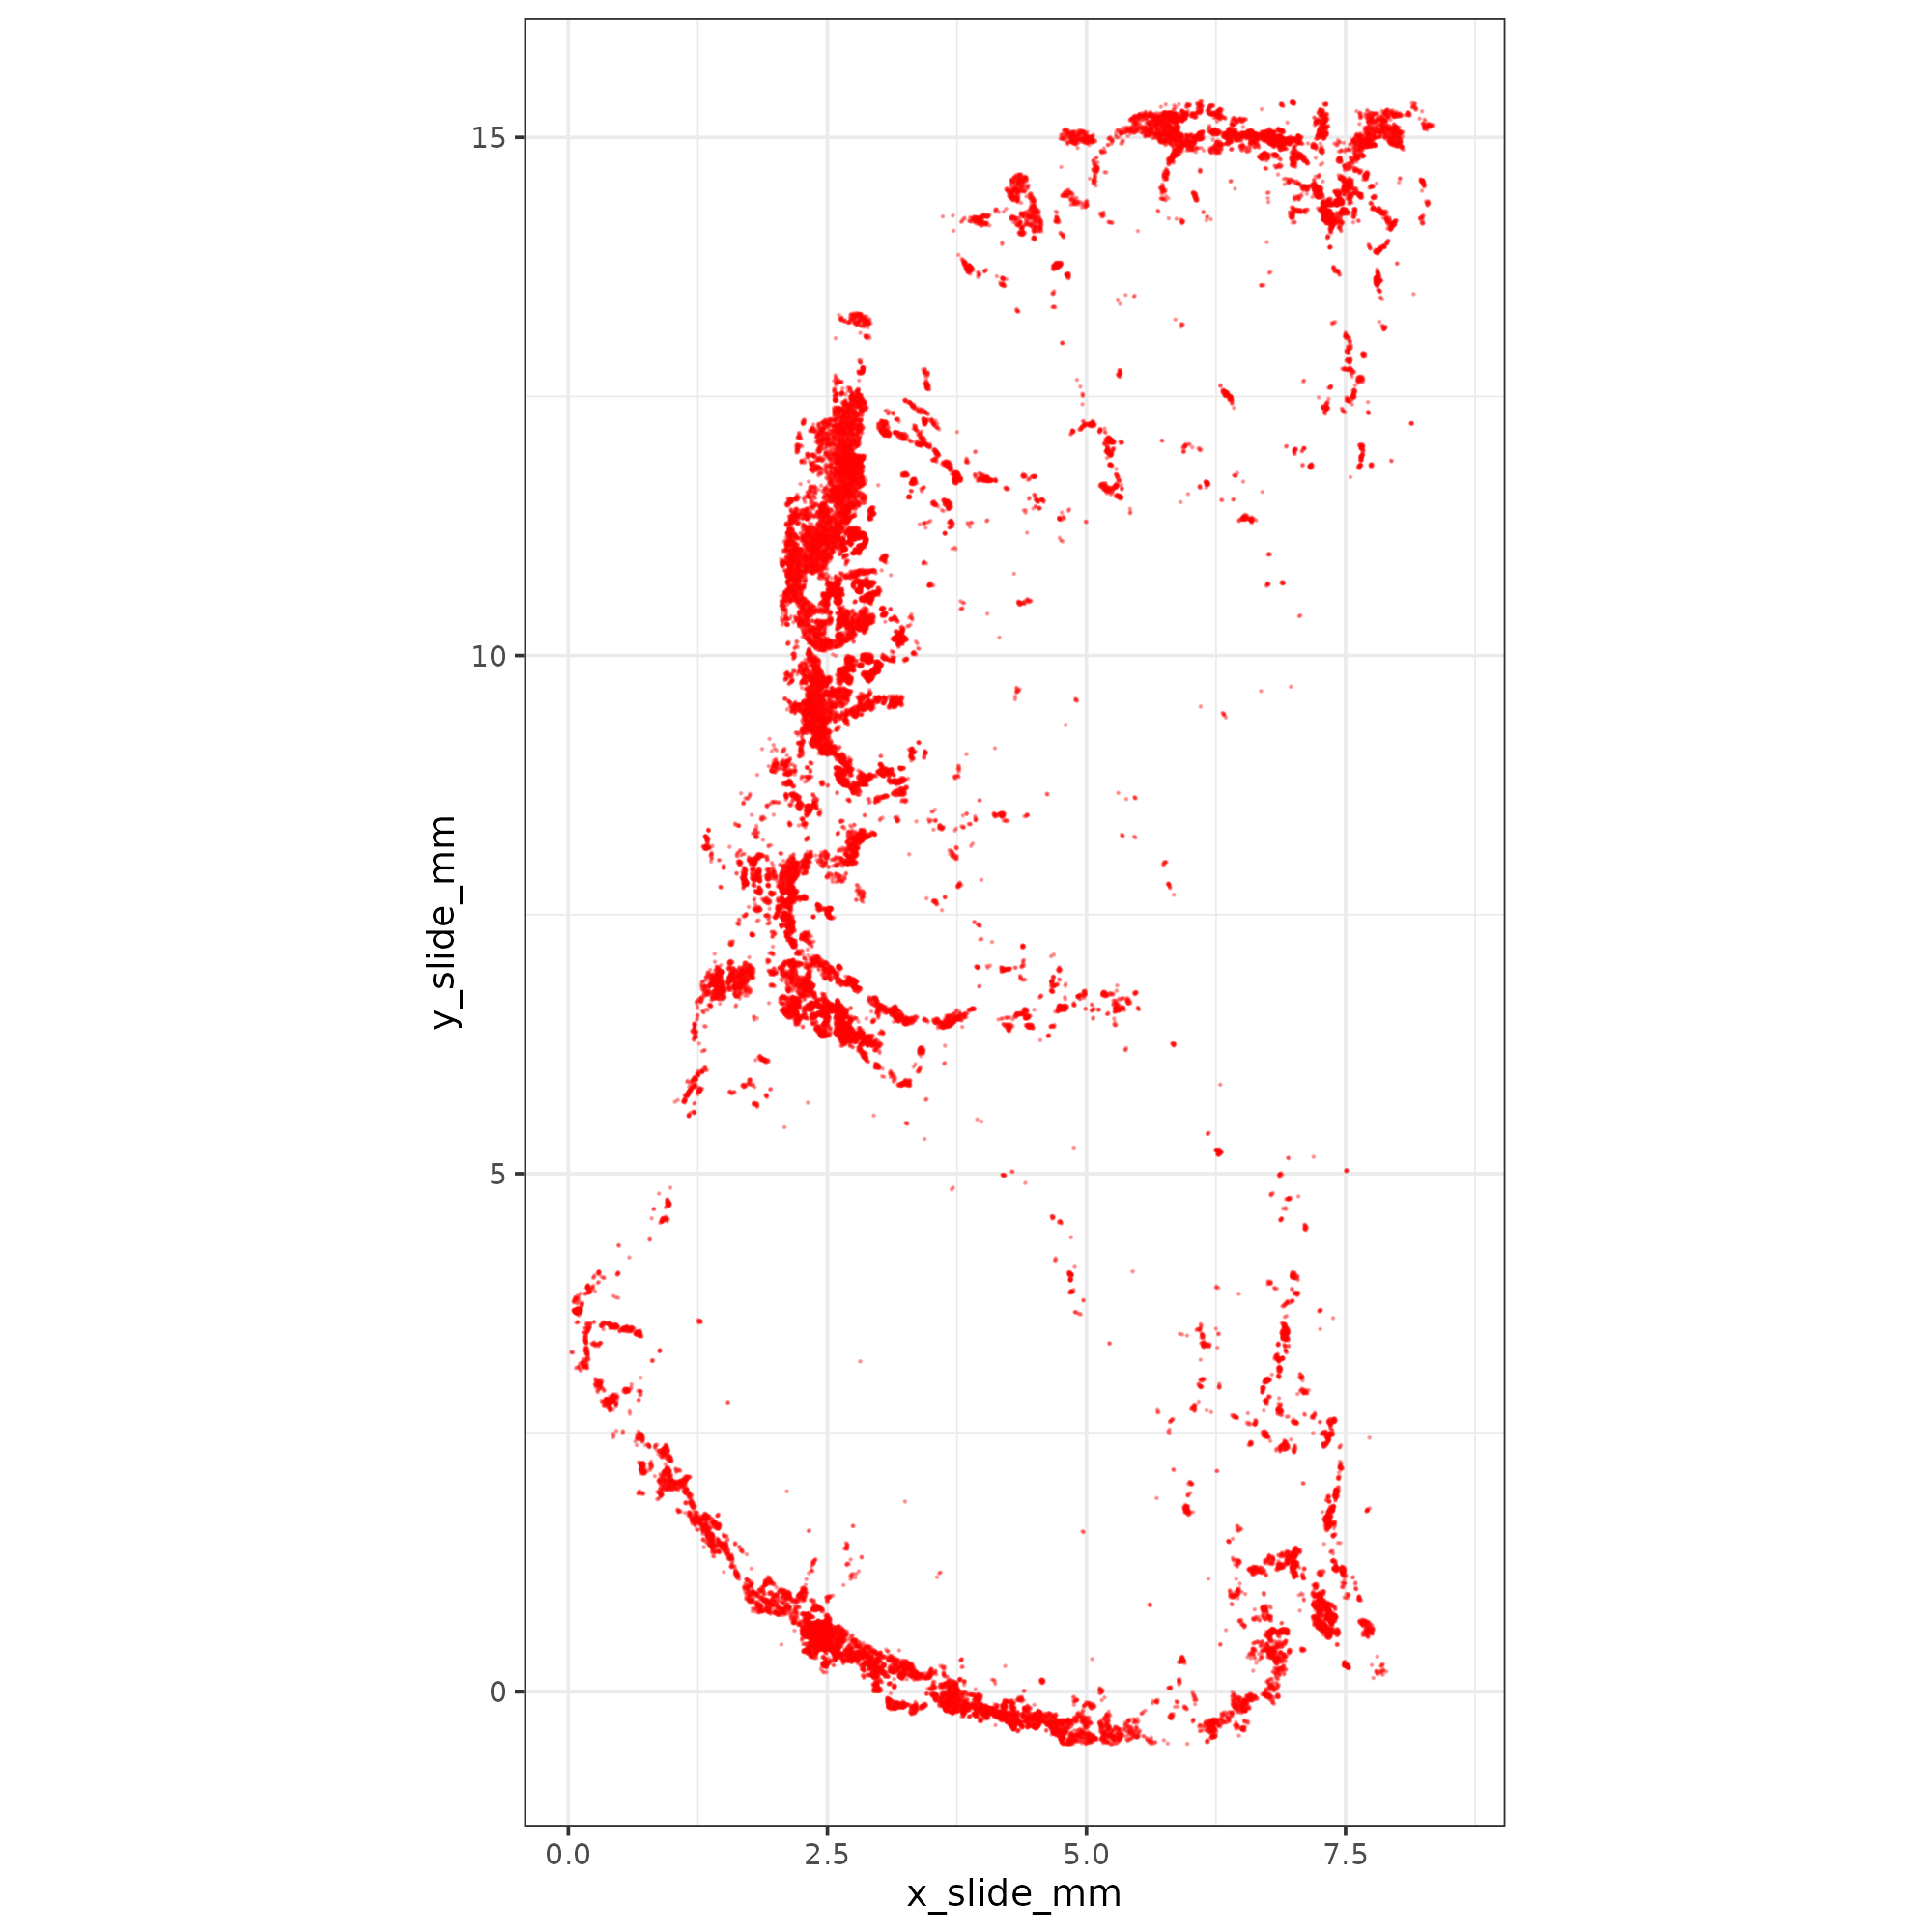
import novaeimport igraphimport matplotlibmatplotlib.use('Agg')import matplotlib.pyplot as pltimport scanpy as scimport numpy as npimport osimport hdf5pluginsc.settings.figdir = os.path.join(r.niche_dir, "Plots")novae.settings.auto_preprocessing =True# Read in sampleadata = sc.read_h5ad("analysis/Robjects/assay_data.h5ad")## convert spatial from mm to microns for novae# Extract coordinates from obsx_mm = adata.obs["x_slide_mm"].to_numpy()y_mm = adata.obs["y_slide_mm"].to_numpy()# Create spatial_mm matrixspatial_mm = np.column_stack((x_mm, y_mm))adata.obsm["spatial_mm"] = spatial_mm# Convert to micronsspatial_um = spatial_mm *1000adata.obsm["spatial_um"] = spatial_um# Duplicate spatial_um to spatialadata.obsm["spatial"] = spatial_um## Start running novae# Create a Delaunay graph of the datanovae.spatial_neighbors(adata, radius=80, coord_type='generic')# Use a quick plot to ensure that neighbors were calculated appropriately# Looking for very few red (unconnected) cells that are only on the edges of tissuenovae.plot.connectivities(adata)# Load in pre-trained modelmodel1 = novae.Novae.from_pretrained("MICS-Lab/novae-human-0")# Fine tune model based on CosMx data in this studymodel1.fine_tune(adata, max_epochs=50, logger=True) model1.compute_representations(adata, zero_shot=False) for i inrange(1, 20): model1.assign_domains(adata, i)model1_dir = os.path.join(r.niche_dir, "novae_model_one")model1.save_pretrained(save_directory=model1_dir)import matplotlib.pyplot as pltdh = model1.plot_domains_hierarchy()plt.savefig(os.path.join(r.niche_dir, "Plots", "novae_model1_hierarchy.png"))plt.close()adata.write_h5ad( os.path.join(r.objects_dir, "anndata-plus-novae.h5ad"), compression=hdf5plugin.FILTERS["zstd"], compression_opts=hdf5plugin.Zstd(clevel=5).filter_options)
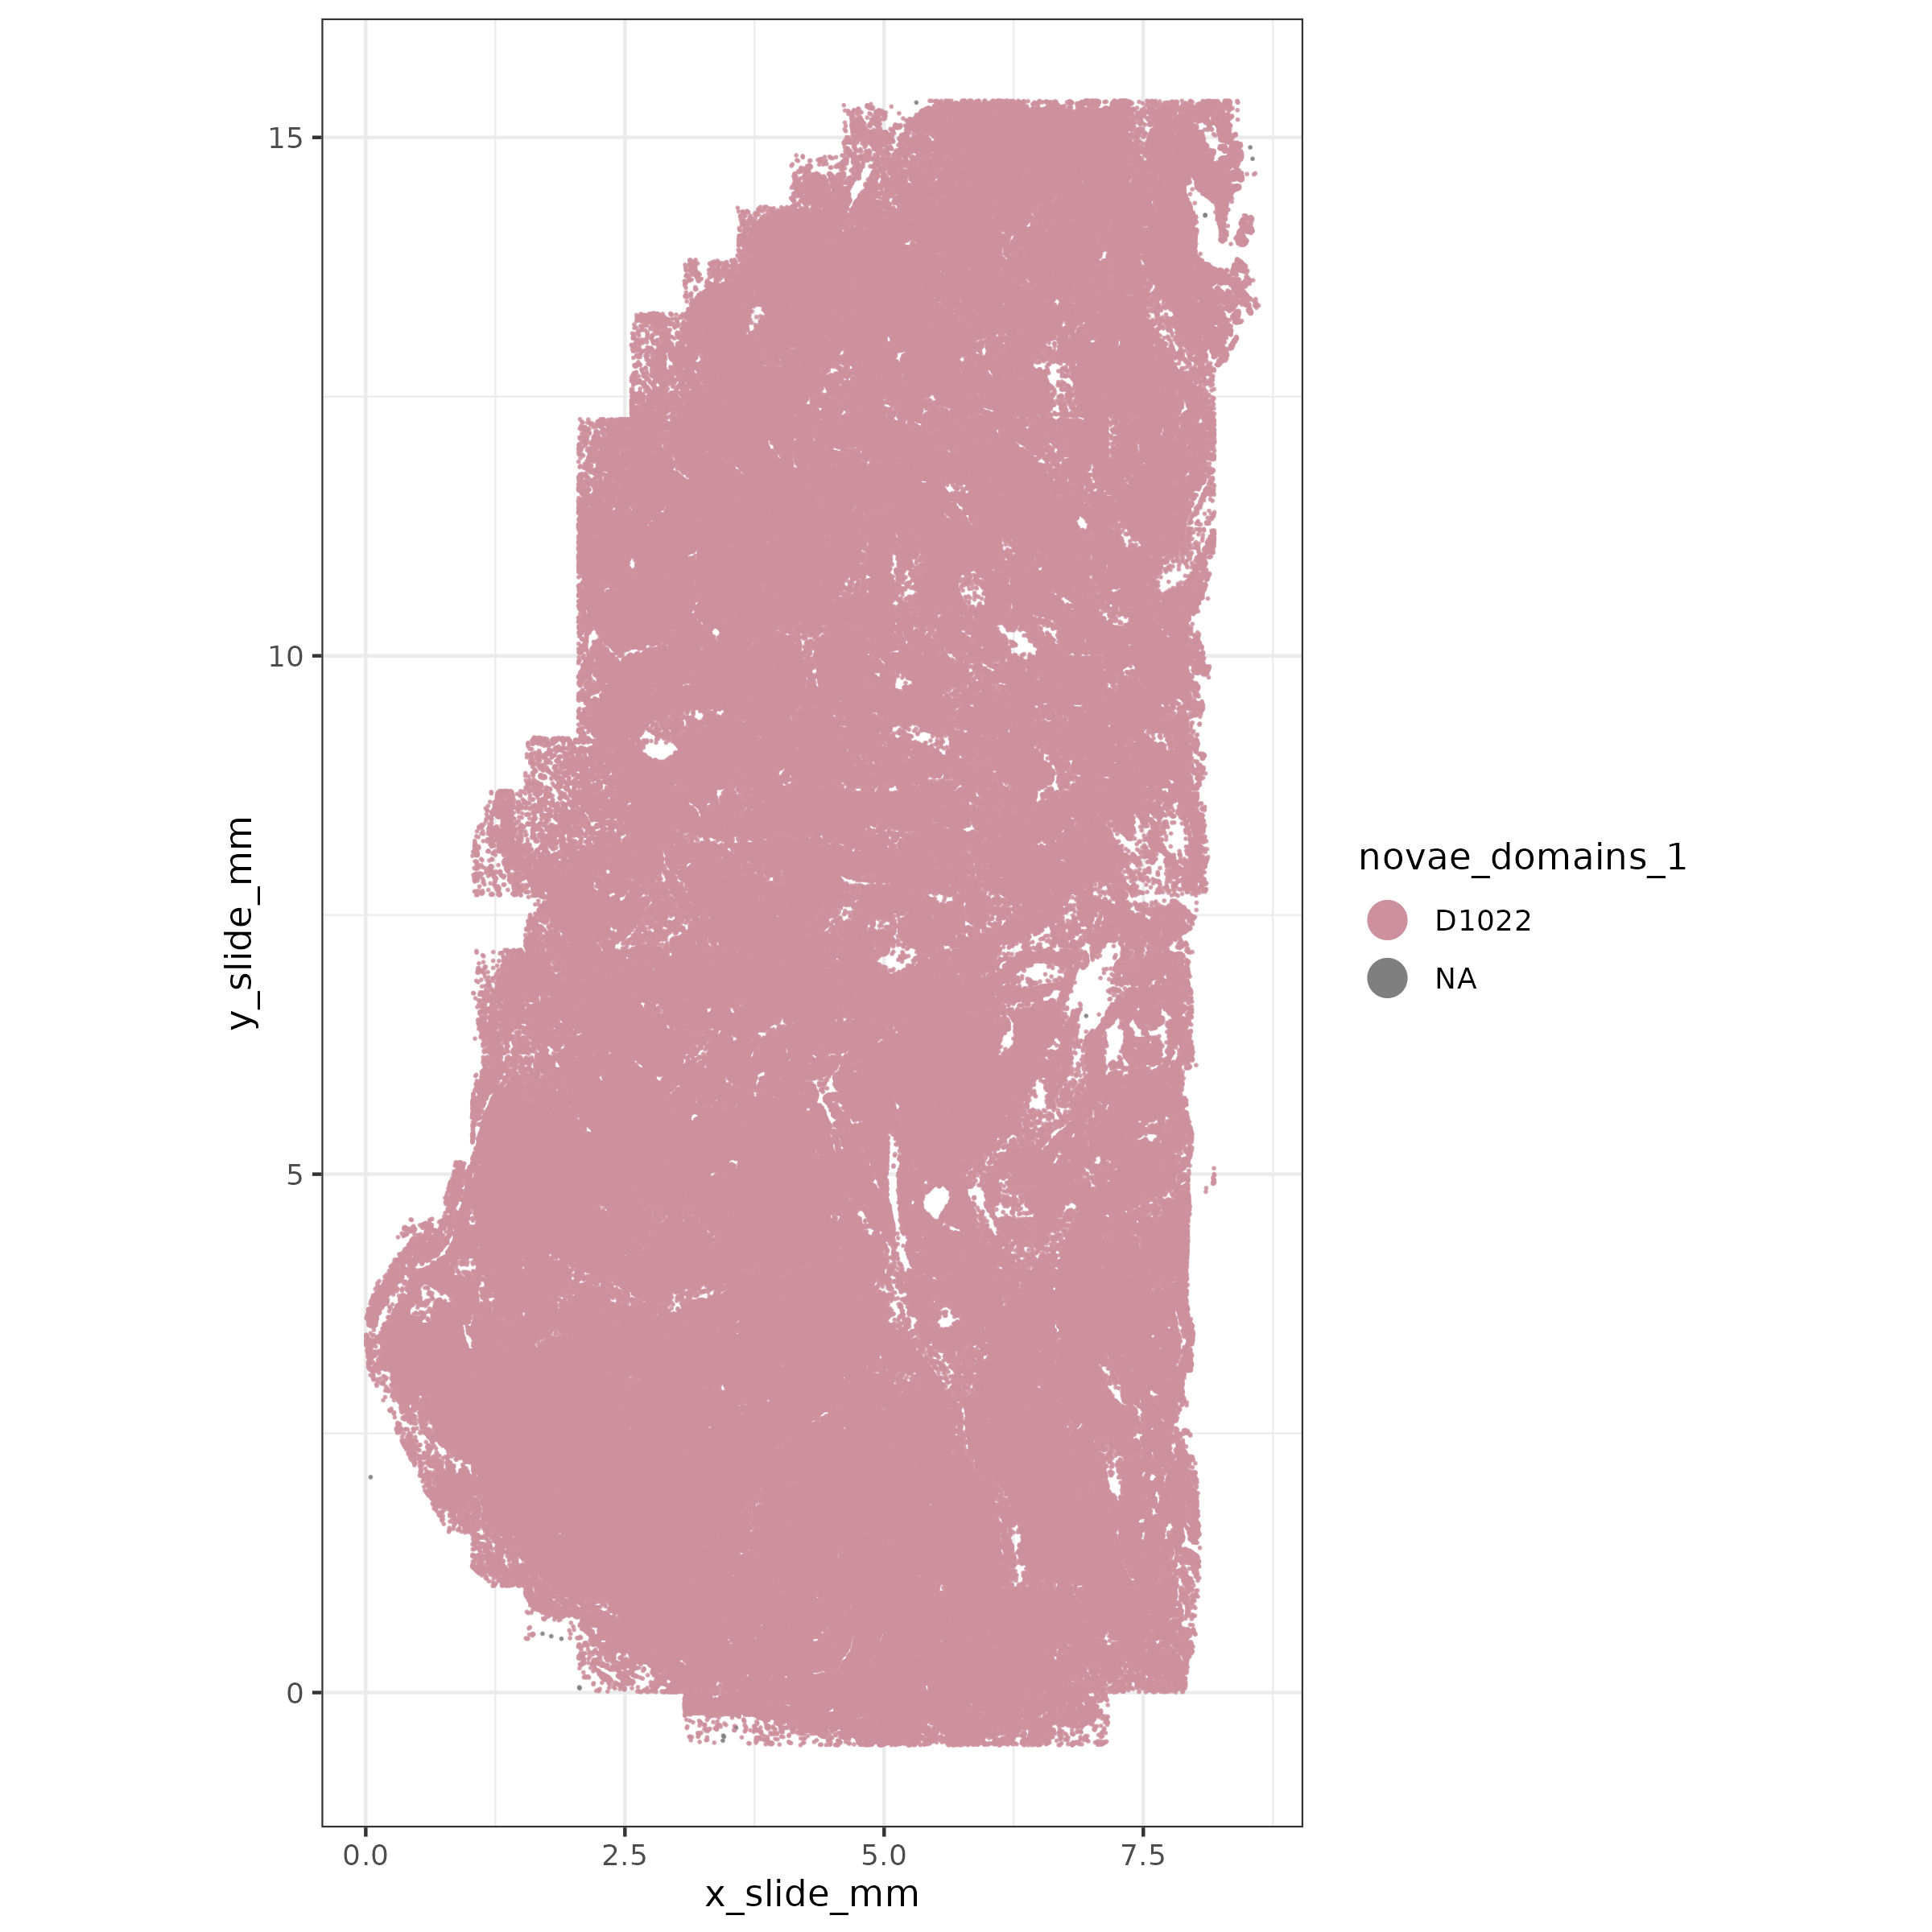
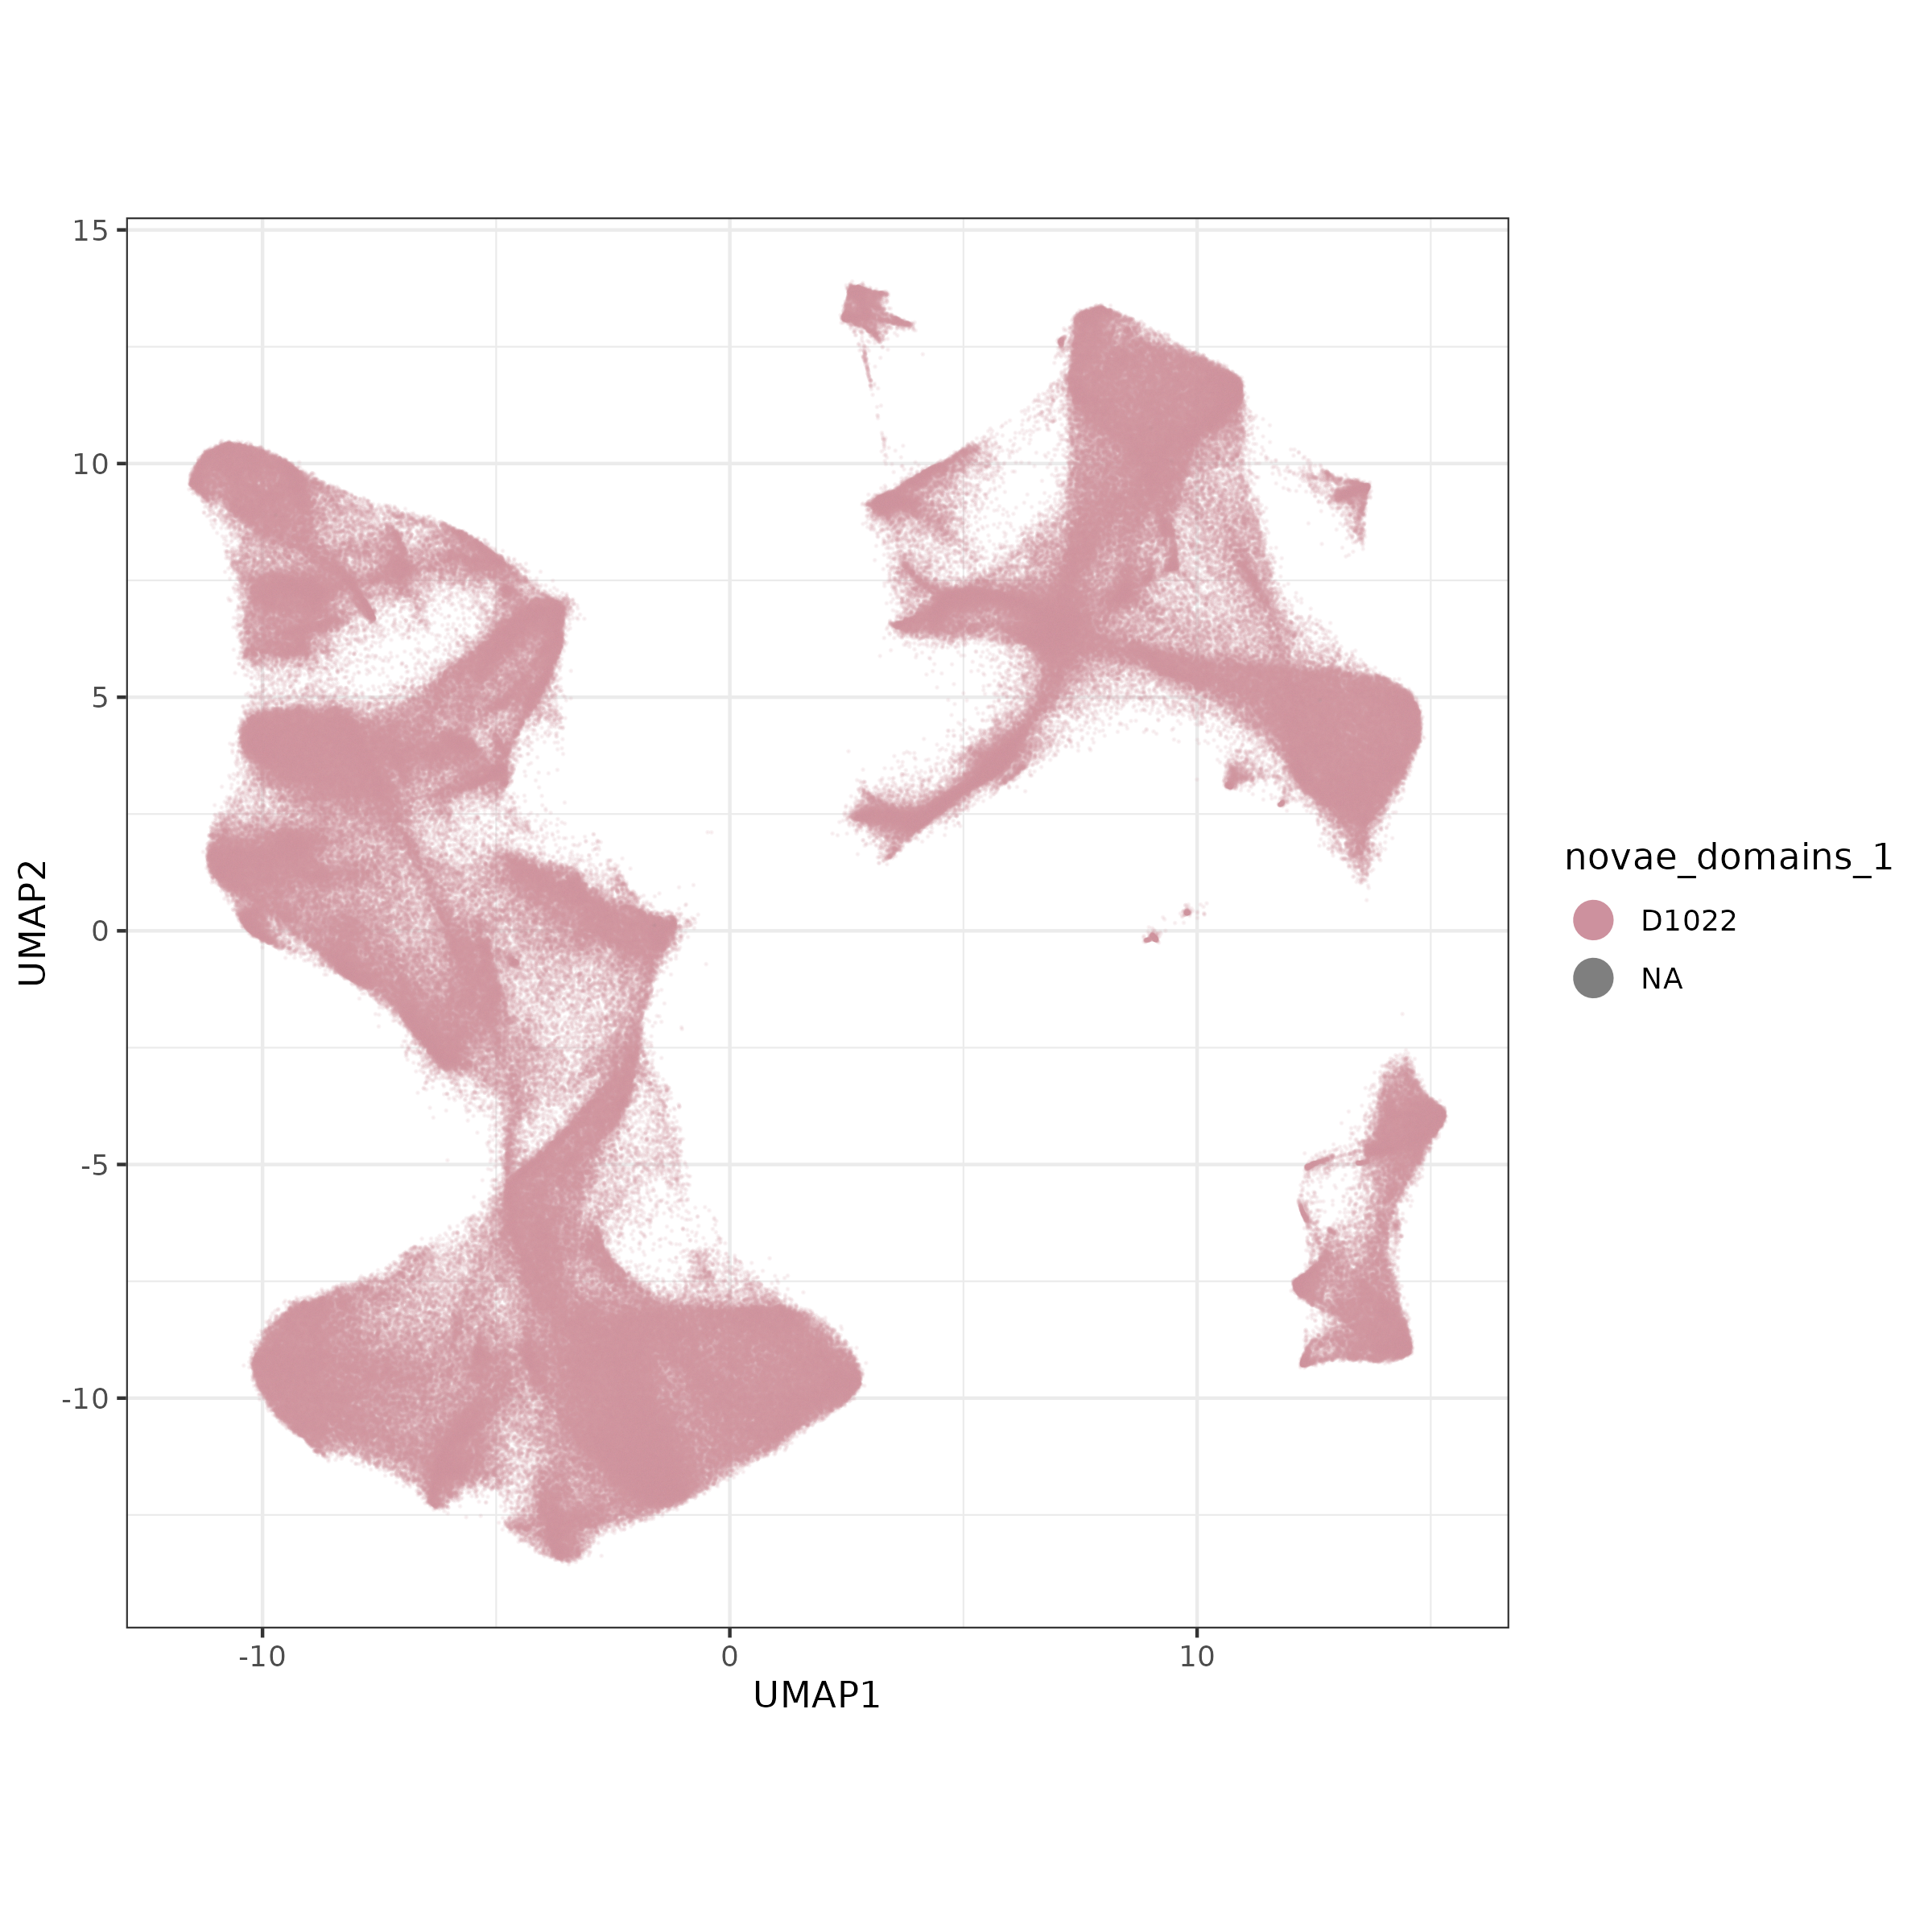
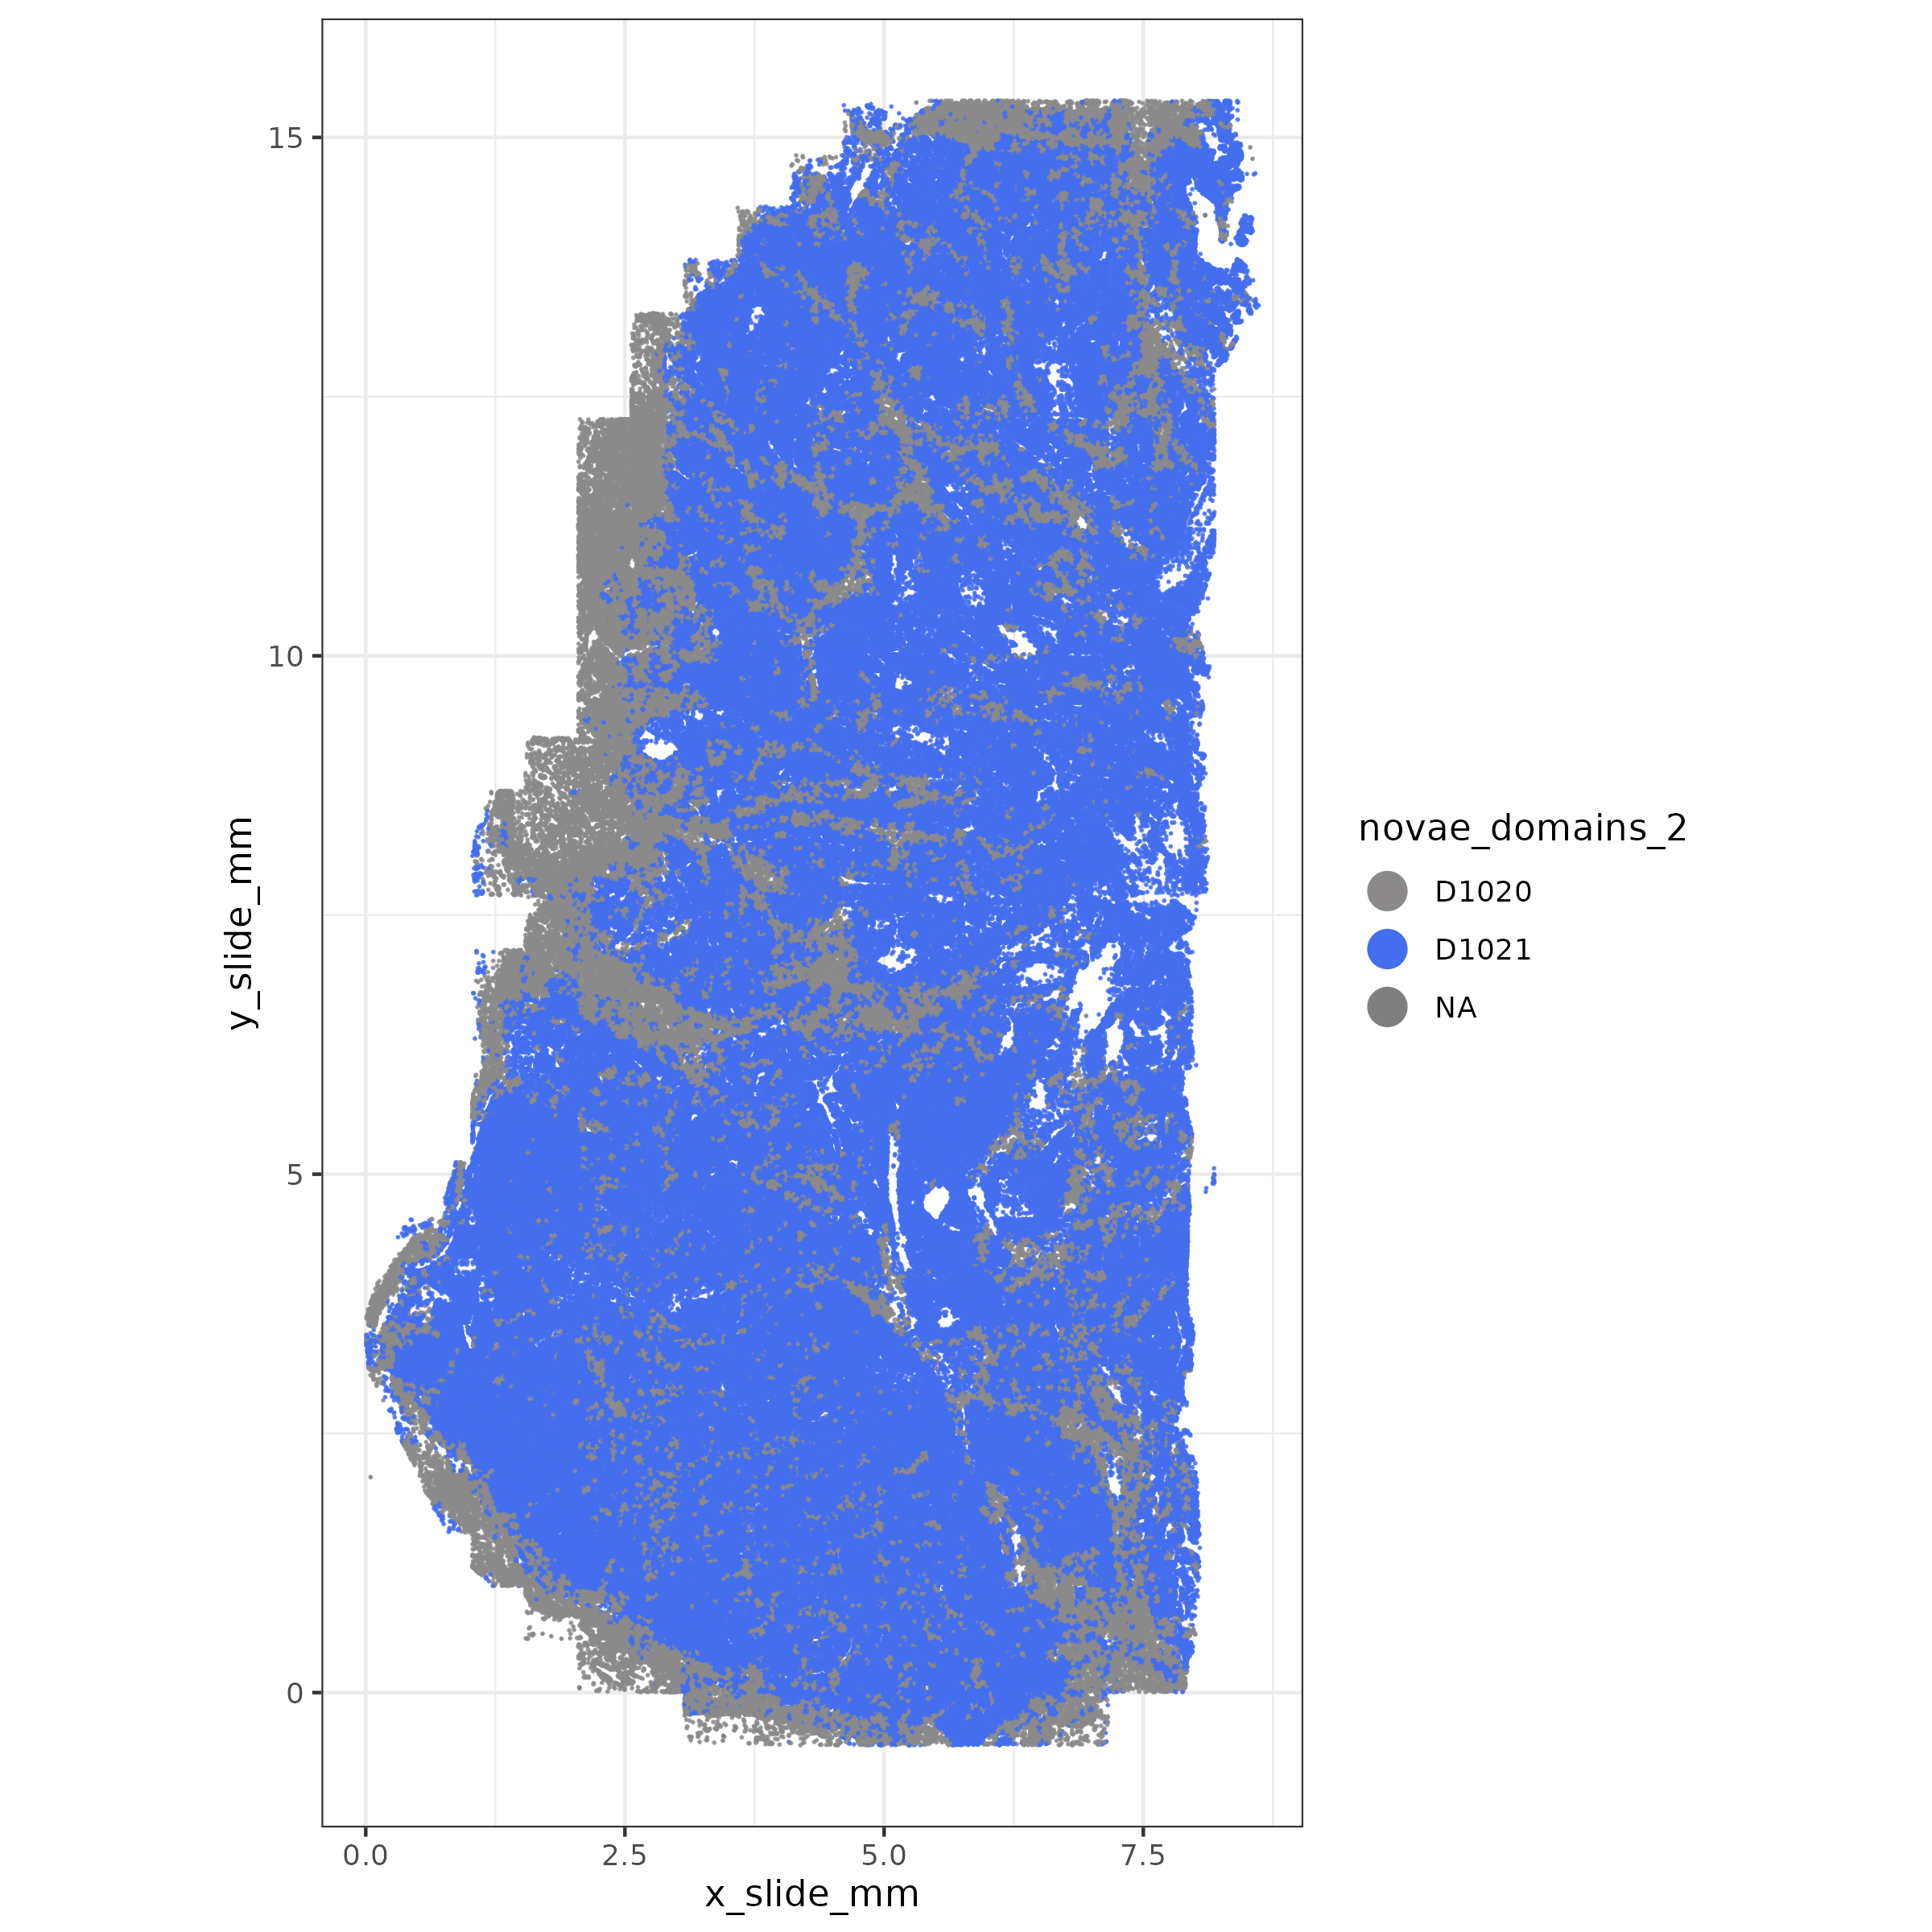
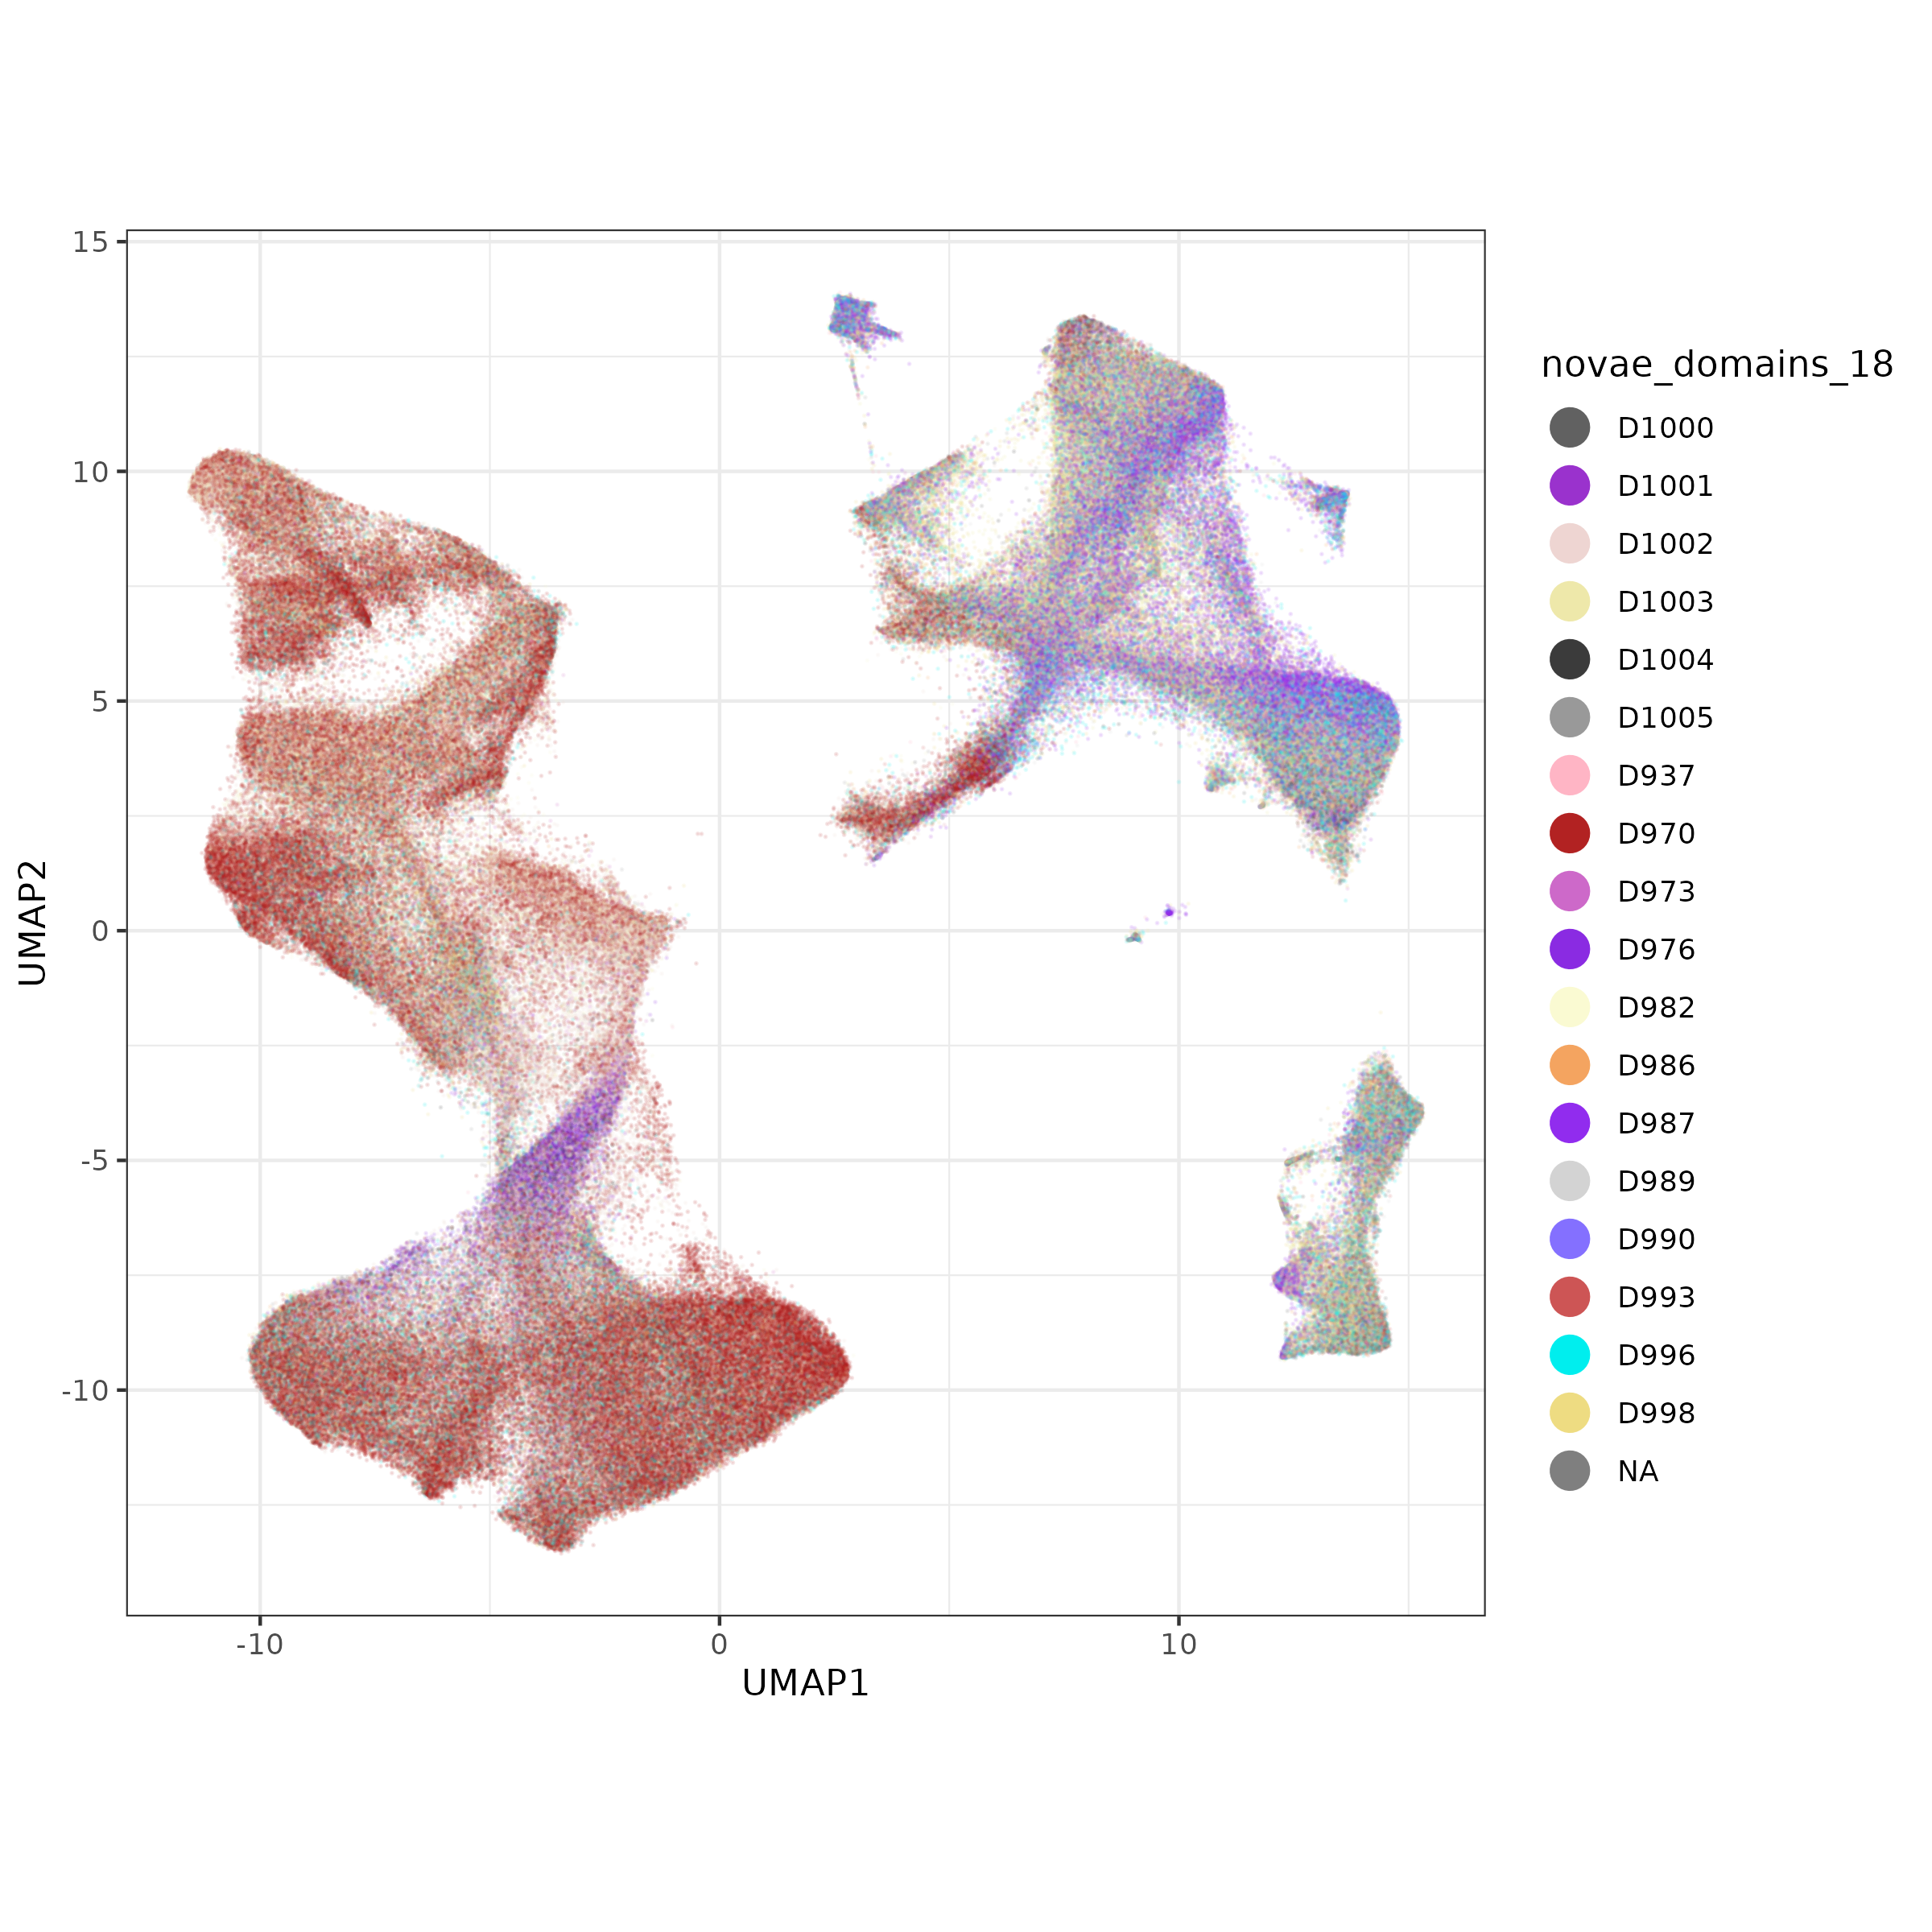
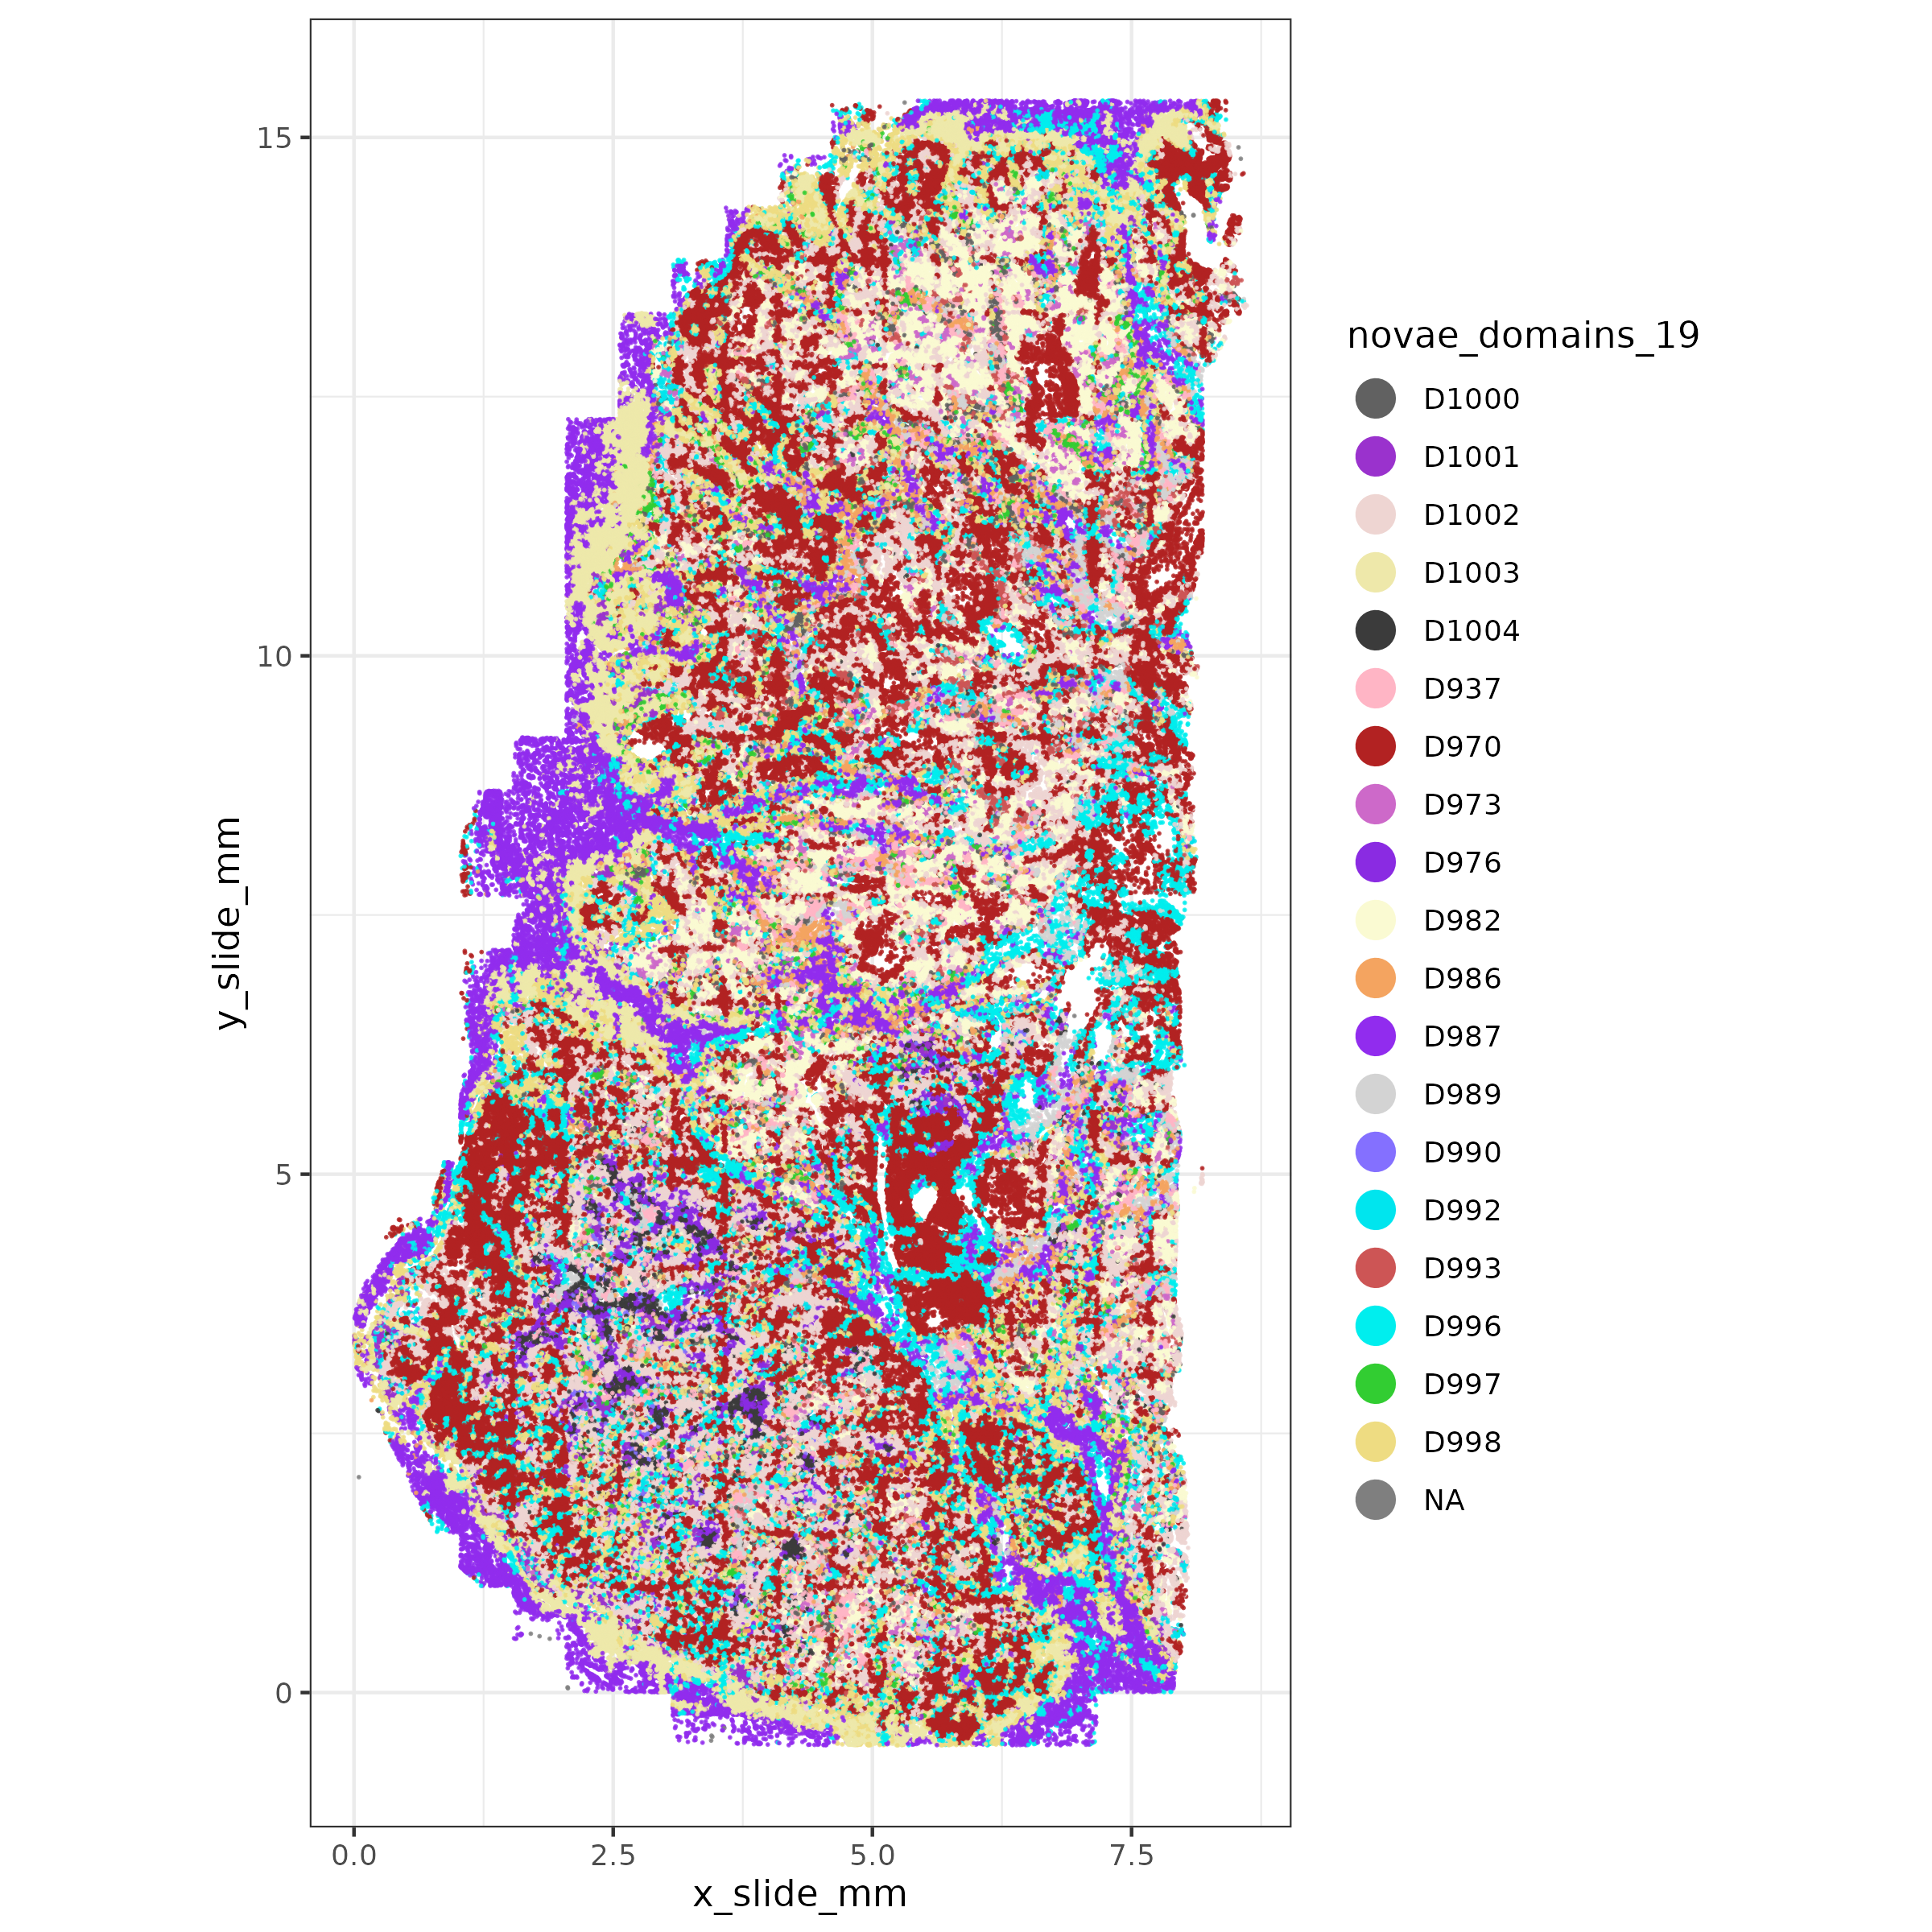
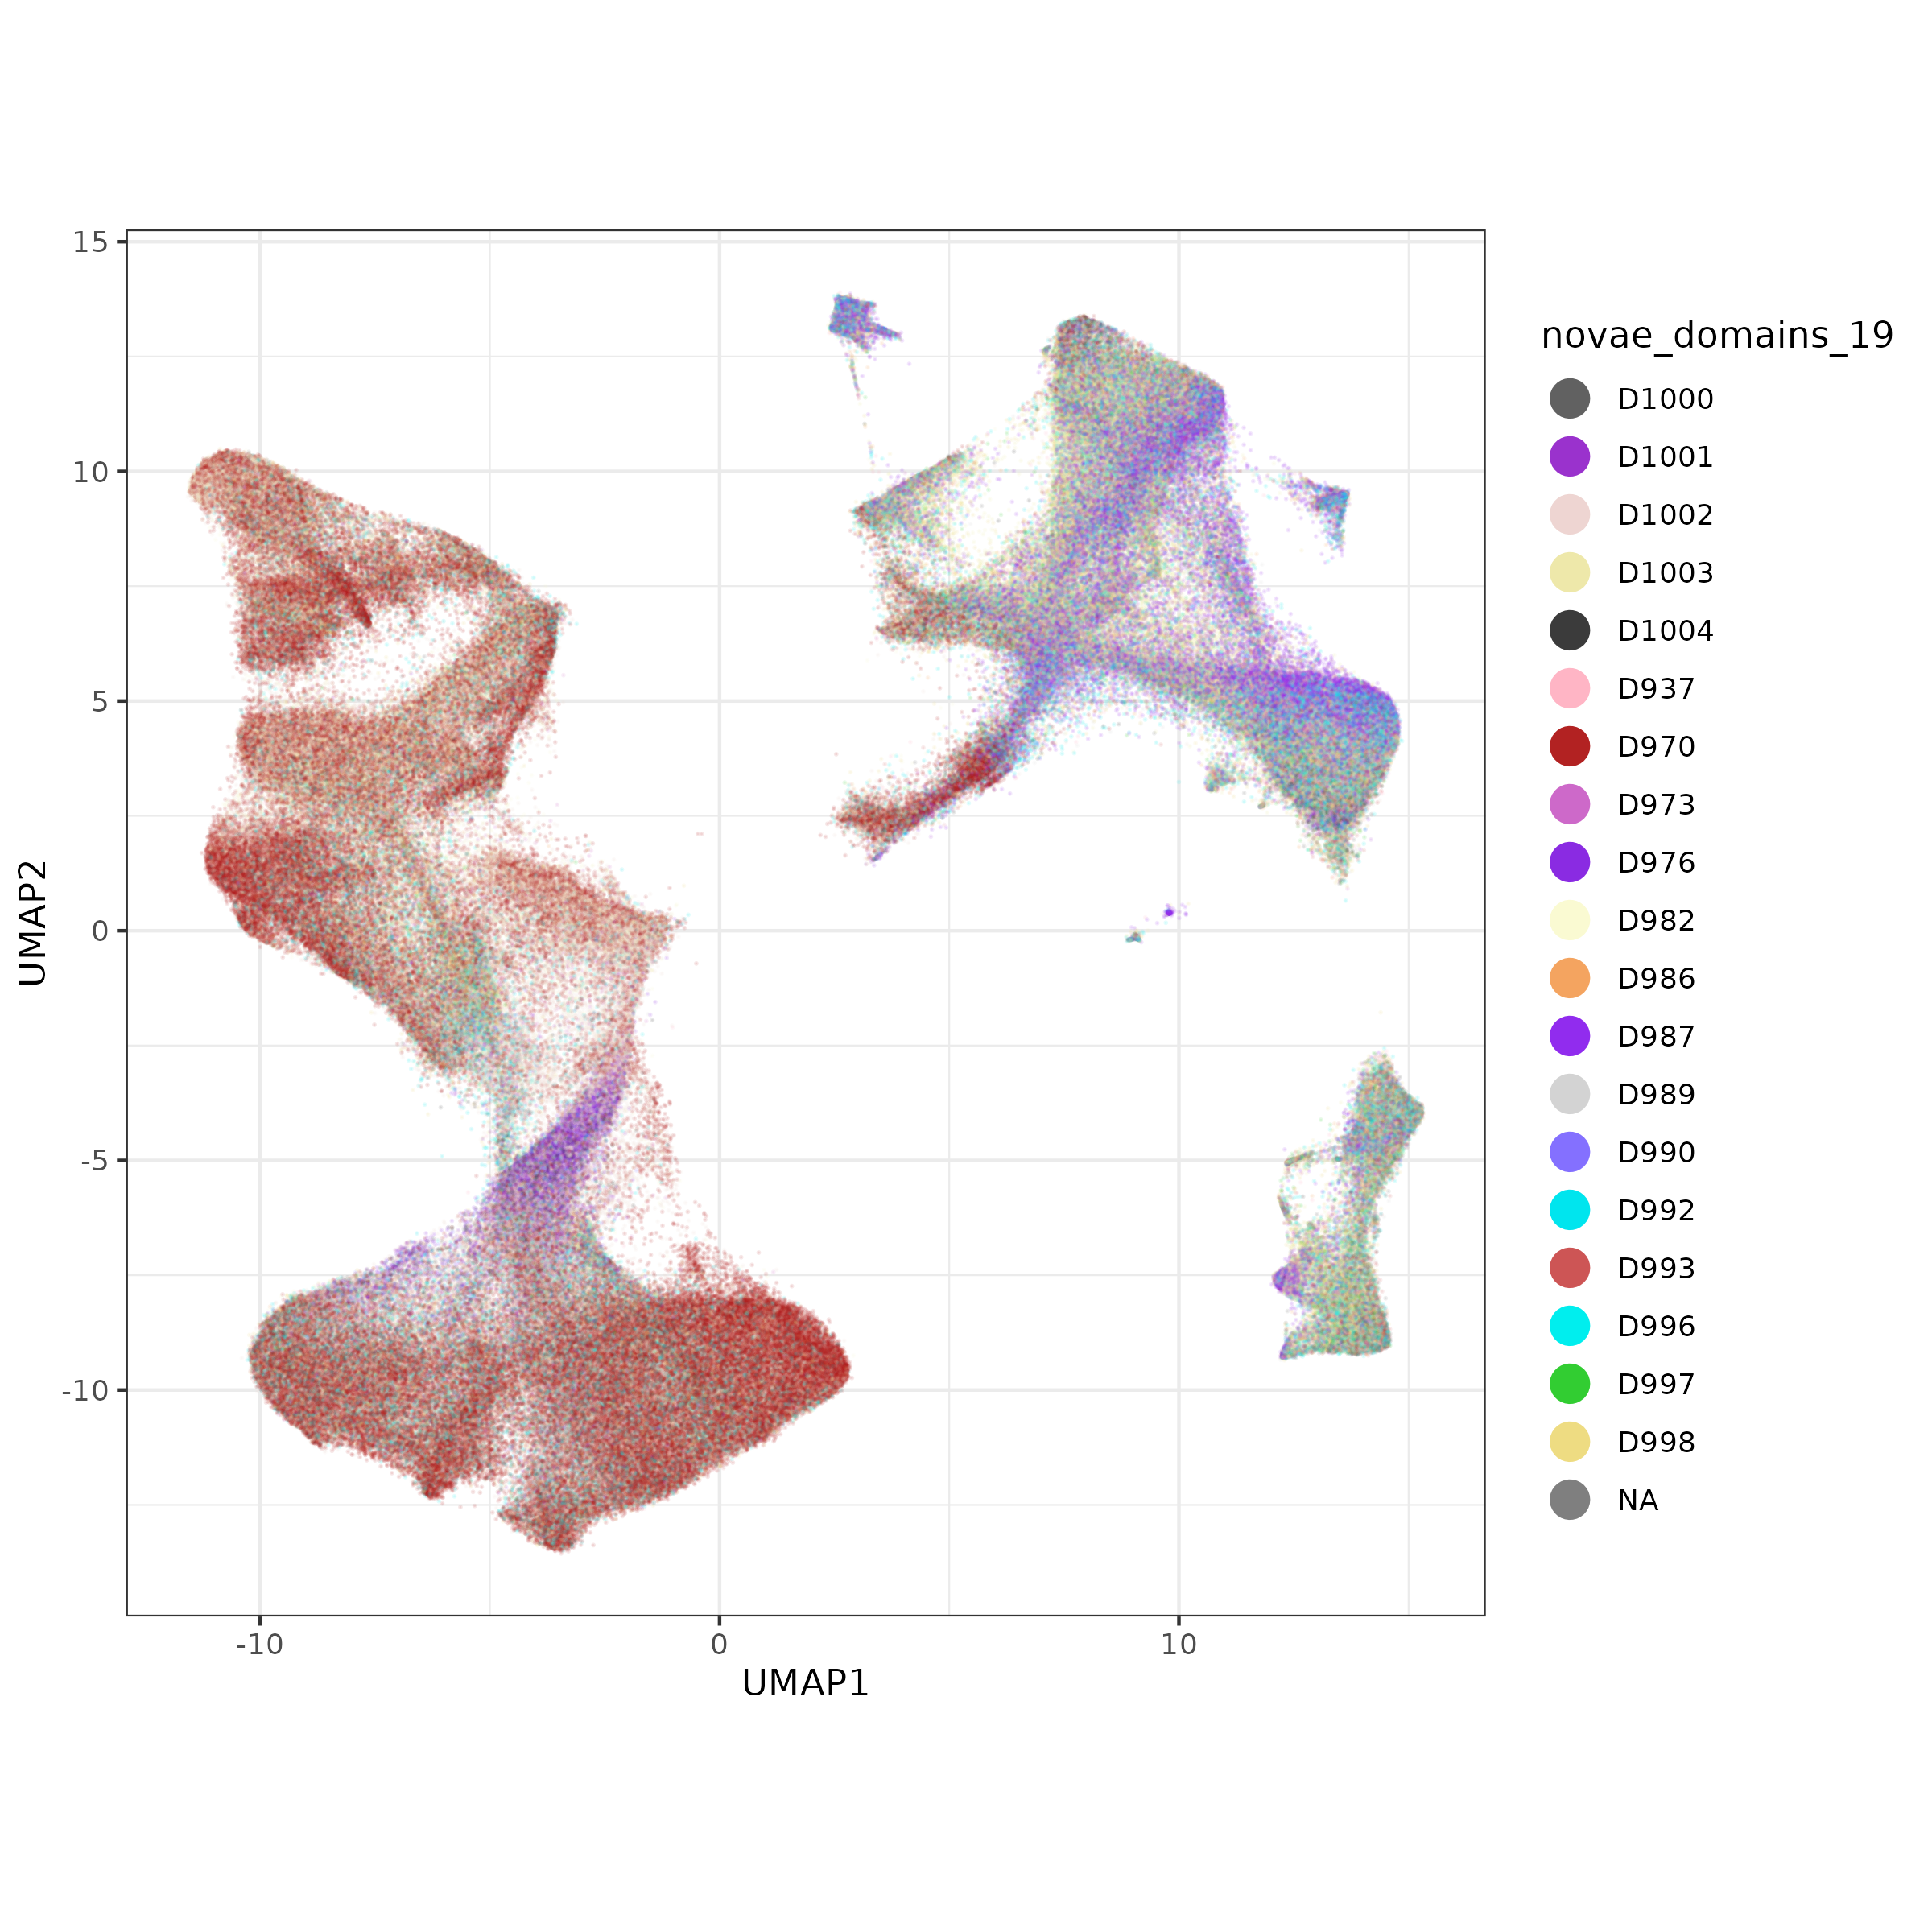
We evaluated domains of various sizes, cutting off the hierarchy at levels leading up to at most 19 distinct domains. For this we visualize the spatial and umap positioning of each hierarchy level.
Based on spatial distribution and minor cell type composition, we assign each domain as a tumor core (TC) domain, interior stroma (IS), or exterior stroma (ES).
if (!("seu.obj"%in%ls())){ seu.obj <-readRDS(results_list$seurat_file_postCellTyping)}# Read in named novae domainsnovae_9 <-readRDS(paste0(niche_dir, "/Data/novae_domains_9_namedAssignments.rds"))# Extract metadata and add novae domainsdf <- seu.obj@meta.datadf$novae_9 <- novae_9[df$cell_ID]# Set minor cell types as an ordered factordf$minor_cell_type <-factor(df$minor_cell_type,levels =names(results_list$minor_cell_type_color_pal_manual))# Set domains as ordered factordf$novae_9 <-factor(df$novae_9,levels =c("ES1","ES2","IS1","IS2","IS3","IS4","TC1","TC2","TC3" ))# Exclude the few cells not assigned a domaindf <- df %>%filter(!is.na(novae_9))# Plot itp <-ggplot(data=df, aes(fill=minor_cell_type, x=novae_9)) +geom_bar(position ="fill") +theme_classic() +scale_fill_manual(values = results_list$minor_cell_type_color_pal_manual, name ="Minor cell type") +xlab("Domain") +ylab("Fraction of cells in domain") +coord_flip() +theme(legend.position ="none")ggsave(filename =file.path(niche_dir, "Plots", paste0("barplot_minorCellTypes_perDomain9_horizontalFormatted.png")), p,width=6, height=3)