Visualize cellular neighborhood in gallery mode
A complete CosMx dataset will contain cell metadata, morphology/protein images and cell label results of cell segmentation. We’ve created a toolkit for visualizing the neighborhood of query cells in terms of protein staining, cell segmentation border, numeric and categorical metadata. (Note: we are not performing cell typing or cell segmetnation here, just drawing boundaries from the existing cell label/segmetnation results.)
You can find the package here. See the corresponding tutorial inside the package for more details.
The inputs required:
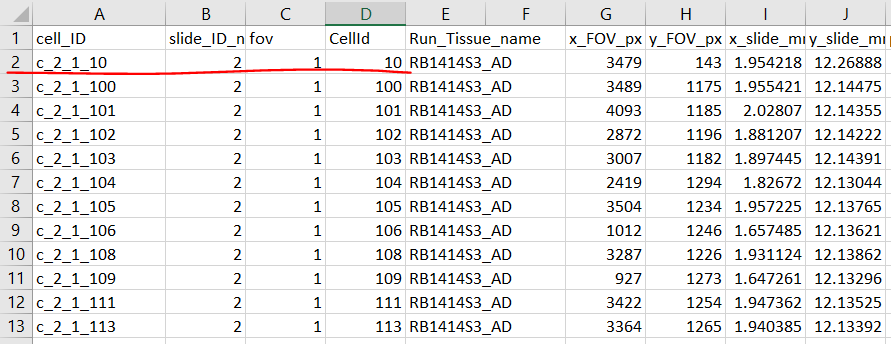
cell metadata with unique cell_ID in format of
c_[slide]_[fov]_[CellId].Either file path to
CellStatsDirthat contains per FOV level of cell label images, morphology C902 images and optionalProteinDirthat contains per FOV level of protein images.Or file path to
napari-cosmxdataset which contains stitched images for cell label, morphology and optional protein images of entire slide.
This code expects the file format output generated by CosMx Single Molecular Imager (SMI) and napari-cosMx plugin. Here are the example data/folder structure of the required input files.
- Example cell metadata:
Example
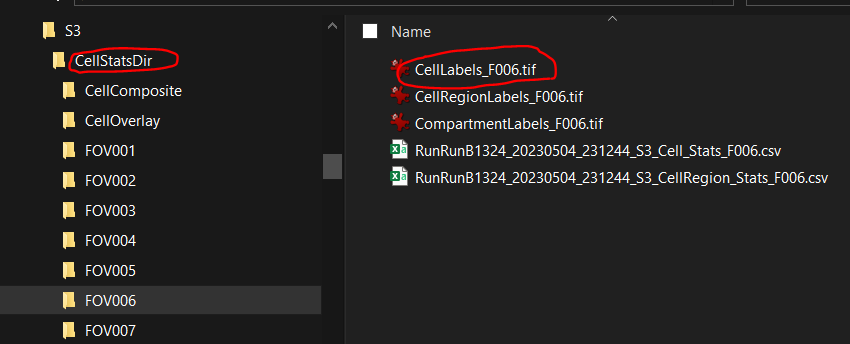
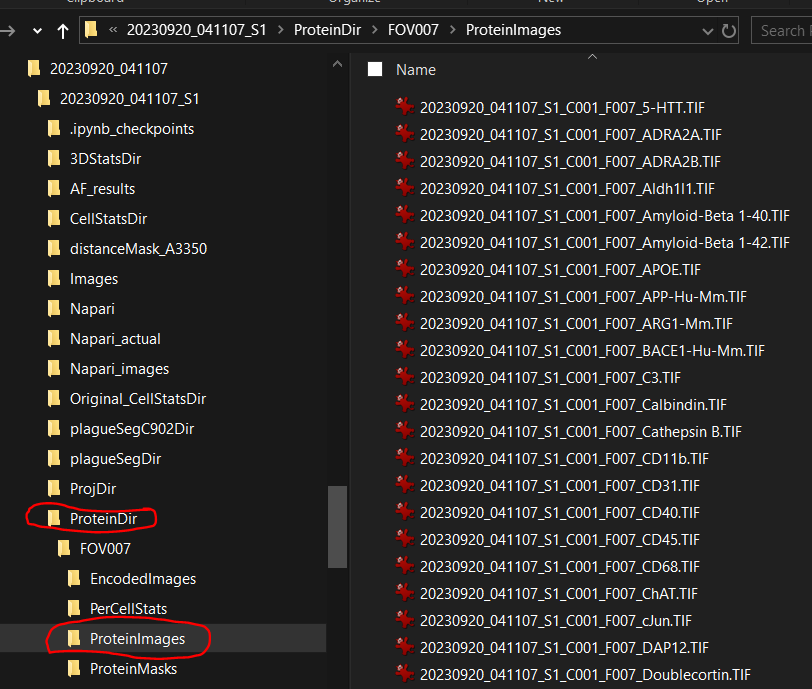
CellStatsDirandProteinDirunder raw data folder of given slide.- Each FOV subfolder under
CellStatsDircontains cell label images of given FOV.
- Each FOV subfolder under
Morphology2Dsubfolder underCellStatsDircontains multi-channel morphology images of each FOV.
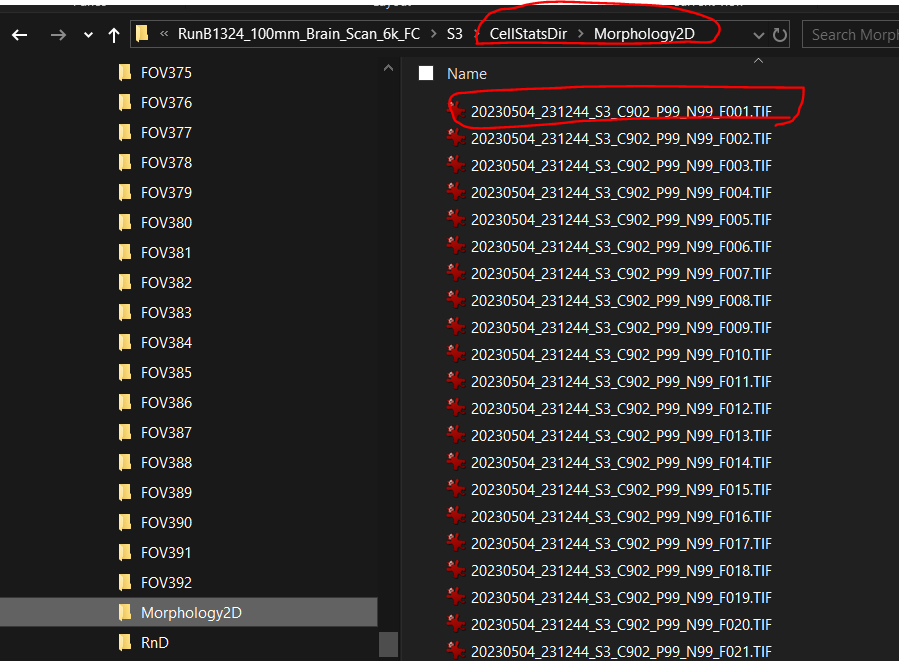
- Each FOV subfolder under
ProteinDircontains a folder calledProteinImages, which has single-channel images for all the protein profiled for the given FOV.
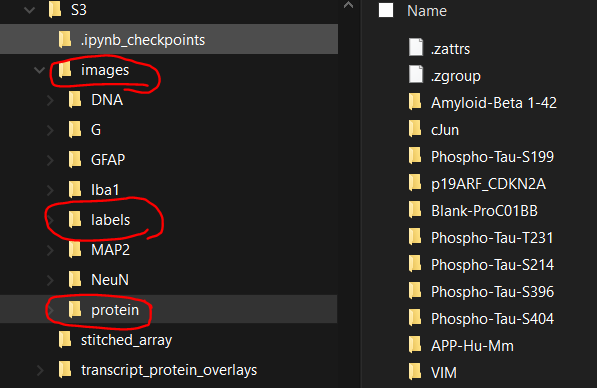
- Example
napari-cosmxdataset with stitched images:labelsfor cell labels,protein/[proteinName]for single-channel protein images, other folders (e.g.DNA) for single-channel morphology images.
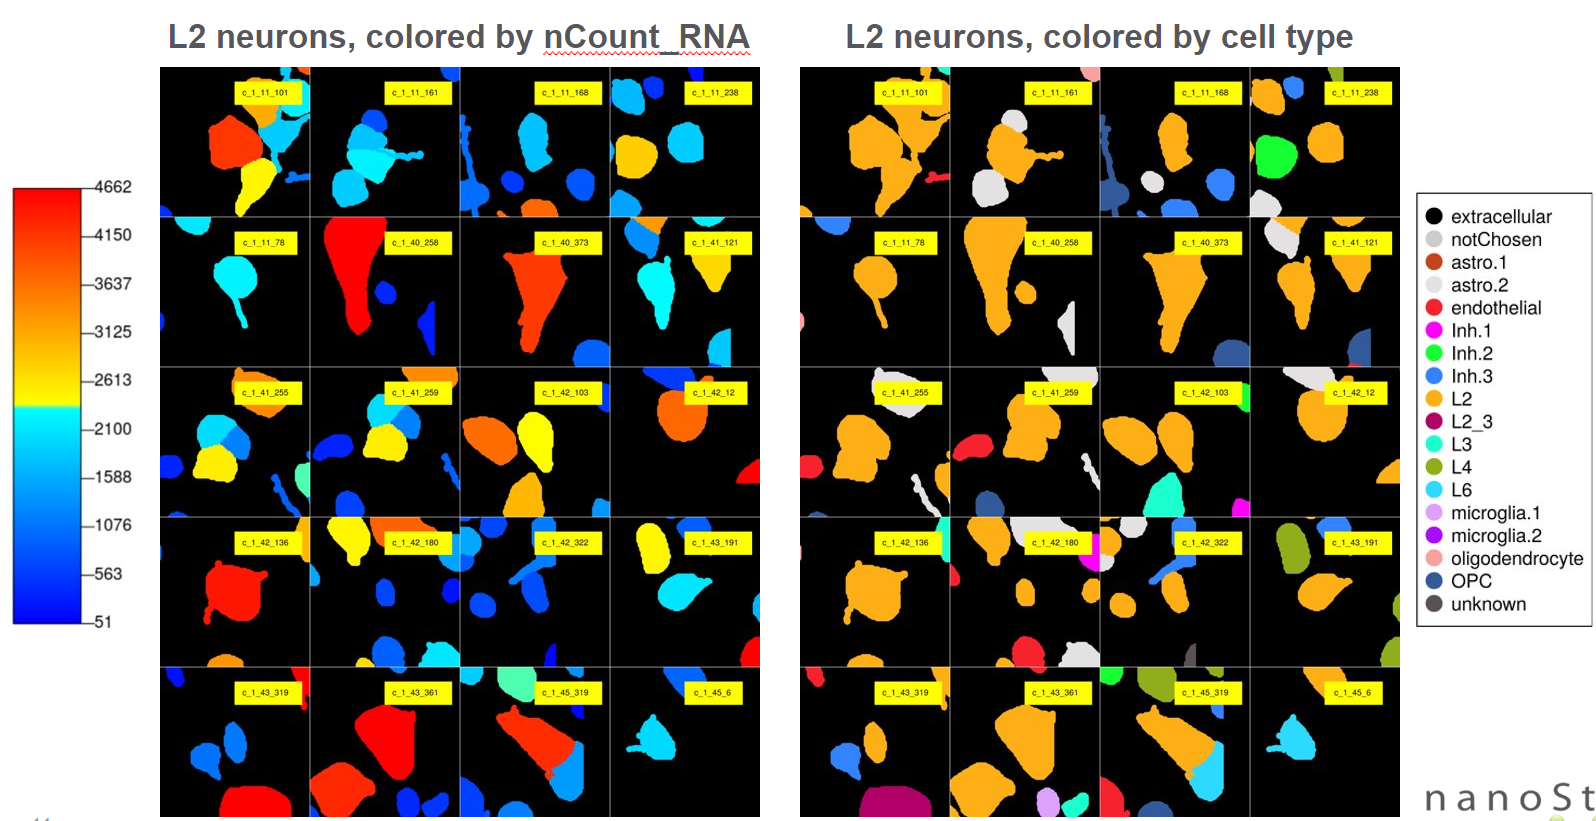
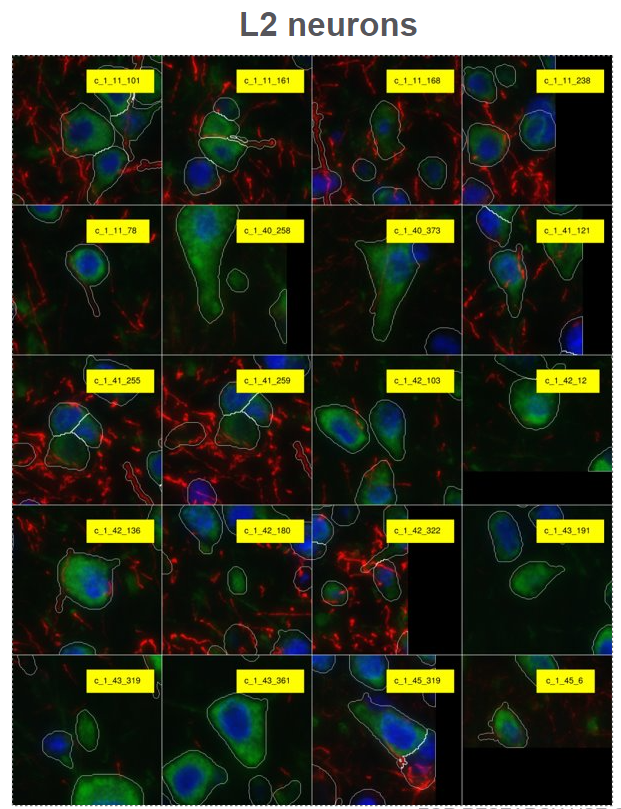
Below are the example outputs of plotting query cells’ neighborhood:
- Plotting morphology images and cell borers of query cells’s neighborhood
- Plotting numeric and categorical metadata of query cells’ neighborhood