
Basic CosMx analysis workflow
As of December 2025, we have an updated RNA analysis vignette available in three parts on our blog, starting here.
Introduction
A complete demo analysis of a CosMx dataset can be found at workflow section in this post and the correspond scripts are stored under _code/vignette folder in this repository. It’s intended to be used as a template for other analyses to follow.
We’ll be analyzing a 1000-plex dataset from melanoma samples. We begin with the files written by the AtoMx flat file export module. The full dataset we’ve used is too big to be saved on Github. To follow along, we recommend using your own data, also as output by the AtoMx flat file export module.
File structure
We’ll organize the data for this analysis as follows:
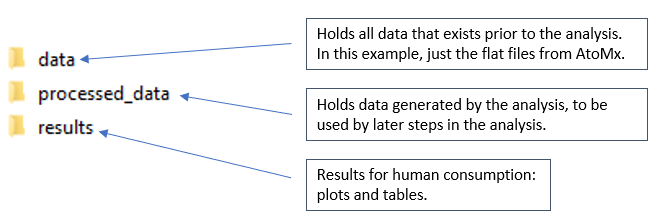
- The “data” folder holds the exports from AtoMx
- “processed_data” holds data objects generated during analysis, meant to be used by later analyses.
- “results” holds results intended for human consumption.
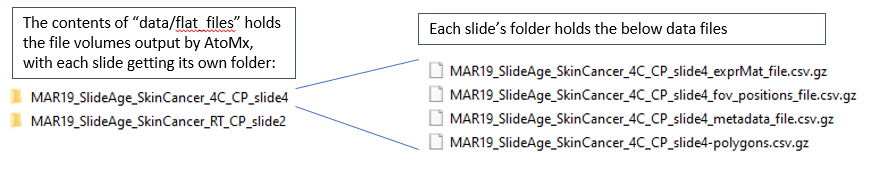
Inside the “data” folder, we’ll place a folder names “flat_files”, containing the AtoMx exports:
And we’ll organize code as follows:
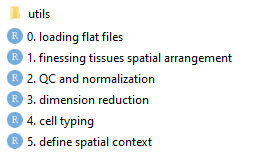
- Analysis scripts are numbered by the order in which they should be run. Each creates data used by the downstream scripts.
- Scripts are meant to be run in the directory where they lie.
- “utils” holds R scripts containing functions used by analyses.
Data structure
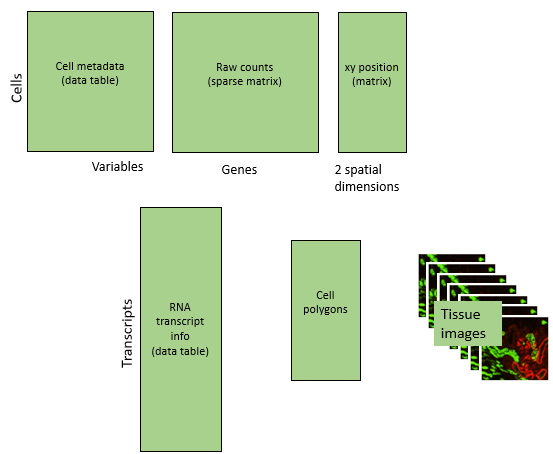
Our flat file exports contain the following data types:
- Raw counts
- Cell metadata: other attributes of cells, e.g. size, immunofluorescence values, tissue and FOV IDs,…
- Spatial locations: xy locations given in mm. Warning: studies containing multiple slides may initially have overlapping xy locations.
- Transcript data: for all RNA transcripts detected, location, gene ID, and cell ID. Most analyses use cell-level data, not this transcript-level data, but it can make compelling plots.
- Tissue images. Not used by most analyses, but useful for Figures.
Our analyses will append lots of new information to this starting point, ending here:
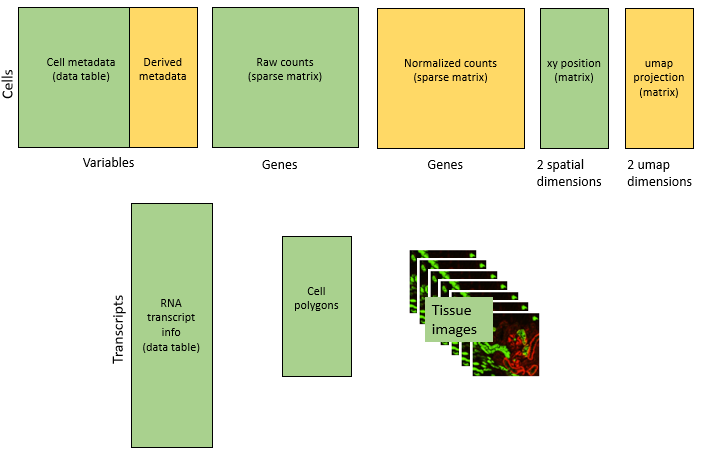
New data types include:
- UMAP coordinates
- Data acting as new metadata columns, e.g. cell type assignment and spatial cluster
- Special results objects from analyses: cell typing, differential expression, InSituCor, …
Workflow
Our workflow performs the below steps:
First, the fundamentals:
- Parse and format data export by AtoMx
- Custom arranging of tissues and FOVs in space
- QC and normalization
- Dimension reduction (PCA and UMAP)
- Cell typing
Then, we go after biology:
- Defining cells’ spatial context
- Hypothesis-driven analyses, i.e. differential expression: how do cells change behavior based on their spatial context? (coming summer 2024)
- Hypothesis-generating analyses: identifying spatially correlated genes with InSituCor
General analysis advice
- For large experiments, more advanced workflows may be needed to avoid overwhelming your compute and/or memory.
- For studies across multiple flow cells, batch correction should be considered.