
Impact of segmentation errors on DE
Cell segmentation is always imperfect, leaving some cells’ expression profiles contaminated with transcripts properly belonging to other cells. For many analyses, this is a largely ignorable source of noise. But for differential expression (DE) analyses, it’s reliably confounding (both statistically and emotionally).
The problem:
For an example, see the below cartoon, where a T-cell’s expression profile is contaminated with transcripts from the tumor cells surrounding it:
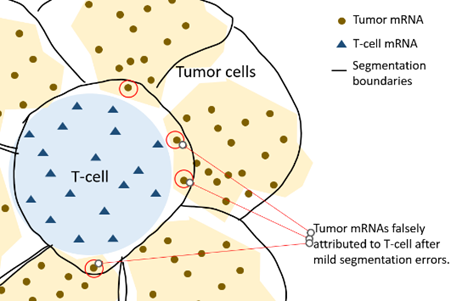
Now say we want to compare T-cells in the tumor bed vs. T-cells in the stroma. We’ll find that T-cells in the tumor bed are enriched in genes expressed by cancer cells (e.g. keratins), and similarly, T-cells in the stroma will be enriched in genes expressed by stroma cells (e.g. collagens). In practice, spurious findings like these are often the most significant genes emerging from a DE analysis.
How to think about segmentation error:
Segmentation error can be considered a missing term in a differential expression model. Say you’re answering the above T-cell question by fitting the below model on T-cells:
E(observed KRT9 expression) = B0 + B1 (in_tumor)*
When you do this, you’re omitting an important term for contamination:
E(observed KRT9 expression) = B0 + B1 (in_tumor) + (N_contaminating_transcripts)*
Your model is underspecified, so its results are biased. As you measure more cells and gain statistical power, you only gain more confidence in your biased results.
Countermeasures
We are preparing a manuscript detailing countermeasures to segmentation. Stay tuned for a link to it, or ask us for code if you can’t wait. For now, two pieces of advice:
- Don’t bother analyzing genes that are dominated by contamination. If you’re analyzing T-cells in tumors, then analyzing KRT9 is hopeless: T-cells barely express it, while the surrounding tumor cells will express it highly. Whatever expression you do see in T-cells will be dominated by contamination. A simple approach: if you’re e.g. analyzing T-cells, then compare each gene’s expression within T-cells to its expression in spatial neighbors of T-cells. The ratio between these numbers tells you how much of that gene’s expression in T-cells is real vs. contamination. Apply a reasonable threshold, and don’t even analyze genes with much higher expression around T-cells than inside T-cells.
- Estimate each cell’s contamination, and adjust for it in your models. Adding e.g. a term holding a gene’s expression in each cell’s neighbors achieves this well; more complex transformations of this term can be more optimal (see our upcoming paper). However, this only ameliorates, not solves, the bias from contamination. Because your estimated contamination term is a noisy approximation to true contamination, your models will estimate an attenuated effect size for the contamination term, and it won’t remove all the bias.