
What is high-plex spatial transcriptomics for?
High-plex single cell spatial transcriptomics data is a little awe-inspiring: even a perfunctory analysis of a single run produces a terabyte of data, gorgeous images, and spatial relationships from the scale of centimeters to micrometers that you could spend weeks exploring.
But ultimately, you don’t need amazing images, you need answers to biological questions. Here I’ll lay out questions typically asked with spatial transcriptomics, and I’ll suggest a more expansive approach that reveals spatial single-cell data to be perhaps the most productive question-posing machine in molecular biology.
Data analysis begins with two fundamental pieces: a matrix of all cells’ gene expression, and their spatial locations: 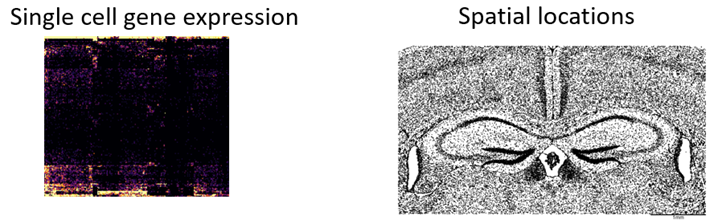
As with any single cell dataset, we begin by using the gene expression matrix to call cell types. Then, simply coloring our spatial map by cell type, we obtain an intricate picture of tissue structure.
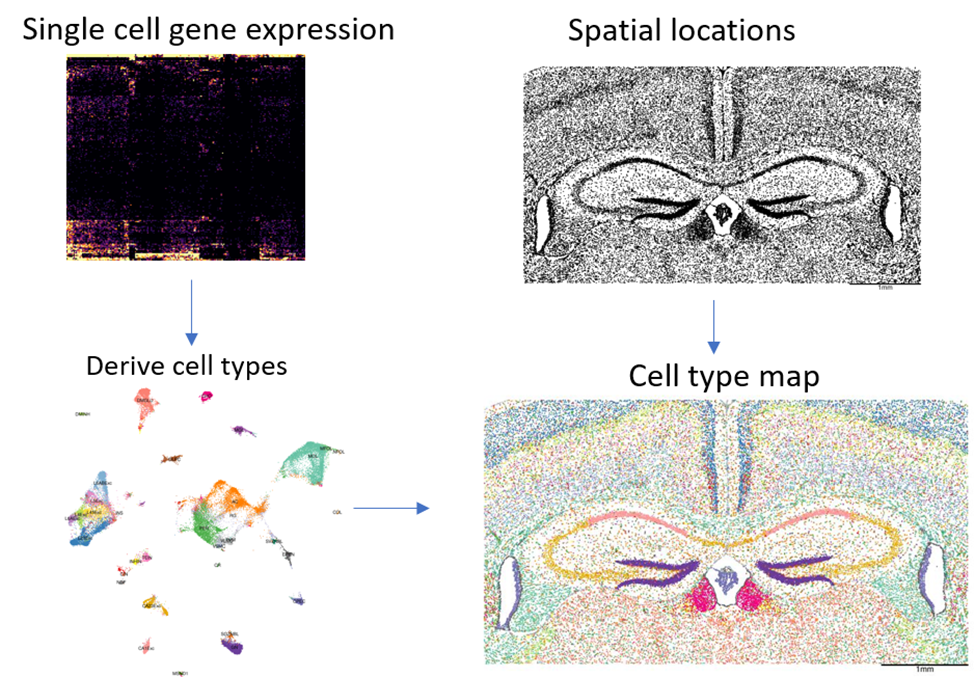
Even this simplistic analysis is valuable: most experts examining these plots come away with new insights and new questions.
Questions answered with cell type + location:
- How is each immune cell type spread through this tumor? Where are the inflammatory vs. the suppressive macrophages trafficking?
- Do we see more memory T-cell invasion in post-treatment samples?
- What immune cell types tend to physically interact with each other?
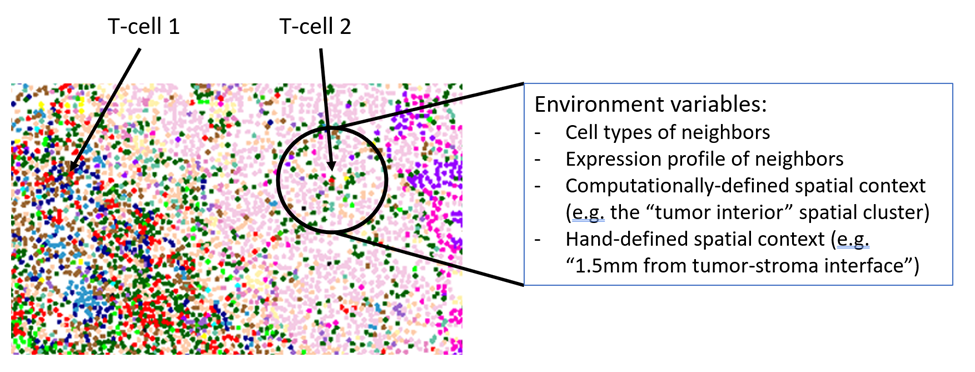
Most early analyses of spatial transcriptomic data stop here. They wrap questions like the above in formal statistics (“spatial clustering” / “niche analysis”, “cell proximity analysis”), and publish what is usually already a compelling story. But if we take this analysis just a little farther, we can begin to ask a staggering number of questions. The power of this data isn’t its ability to get single cell expression profiles, nor its ability to describe spatial variation: it’s the ability to do both of these at the same time. By simultaneously measuring single cells’ phenotypes (gene expression) and environments (the phenotypes of surrounding cells), we can interrogate how phenotype responds to environment. What can we say about a cell’s environment? Consider the below closeup of a PDAC tumor. “T-cell 1” is in a lymphoid structure, surrounded by B-cells and endothelial cells. These cells are expressing certain levels of ligands that bind receptors on T-cells. In contrast, “T-cell 2” has invaded into the tumor bed and is mainly surrounded by tumor cells, plus a few macrophages, and these cells are signaling the T-cell with a different set of genes.
In short, we can trivially derive over 1000 variables describing each cell’s environment. And now, for every cell type, we can measure how every gene responds to every environmental variable. This amounts to roughly 20 * 1000 * 1000 = 20 million questions. Or, in a study across multiple tissues, we might ask these 20 million questions separately for each tissue. (Note that in a lower-plex technology, where a panel of ~300 genes might be devoted almost entirely to cell typing, the number of interesting questions to be asked drops precipitously.)
In short, a standard analysis can lead to millions of hypothesis tests. Single-cell data without spatial information, and spatial data at larger-than-single-cell resolution, can’t come close to this.
Questions on how phenotype responds to environment:
- How do tumor cells modulate gene expression in the face of T-cell attack?
- How do macrophages in the stroma differ from macrophages in the tumor interior?
- What genes do T-cells express when exposed to inflammatory cytokines?