
FOV QC
Introduction
In most CosMx experiments, FOVs perform comparably and data analyses do not require consideration of FOV as a relevant variable. FOVs can, however, experience technical effects, which in some cases require quality control considerations (ex: cells in an FOV clustering as the same cell type). We recommend that FOV QC be performed early in data analysis. Should lower quality FOVs be detected, we recommend they are excluded.
Here we will describe known FOV-level quality considerations and will show use of R code for detecting impacted FOVs.
FOV quality
Lower quality FOVs generally result in reduced overall gene expression or reduced signal from select genes. An example of such a phenomena is shown below where a gene with impacted signal is muted in specific FOVs (top left); other genes behave consistently.
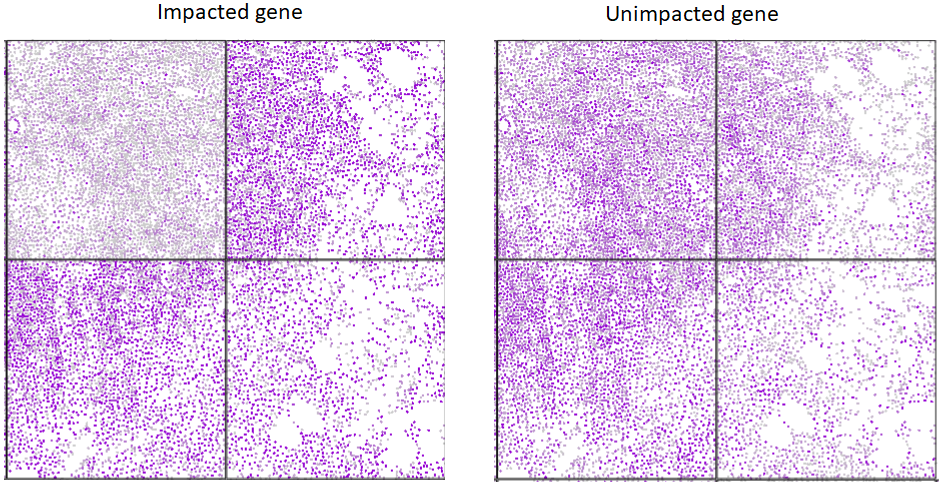
Potential causes for lower FOV quality (e.g. lower relative signal for all/select genes for a given FOV compared to majority of FOVs) include tissue/section quality, high autofluorescence, and inadequate fiducials.
Approach to FOV QC
First, we will apply a permissive look at FOV signal strength, filtering out FOVs with >60% loss of signal across most of their spatial span.
Then we will look for FOVs with potentially biased gene expression profiles. Because FOV quality issues can be linked to fluorescent reporters (multiple reporters encode a gene)
we will look at the level of reporters, not genes.
Specifically, for each reporter, we’ll look for FOVs where genes using the reporter are underexpressed compared to comparable regions elsewhere. And we’ll fail reporter cycles with low quality for multiple reporters.
Technical details:
We place a 7x7 grid across each FOV. For each grid square, we find the 10 most similar squares in other FOVs, with “similar” being based on the square’s expression profile (we also only accept one neighbor per other FOV).
Then we score FOVs for signal loss. For each square, we compare its total counts to its comparator squares. For each reporter bit, this gives us 49 contrasts. If most (75%) of an FOV’s squares have low total counts compared to comparators, we flag the FOV.
To score FOVs for bias, we use a similar approach. For each reporter, we take the genes using the bit, and we contrast their expression in the square vs. in the average of the 10 most similar squares elsewhere. When an FOV’s grid squares consistently underexpress the relevant gene set, we flag the FOV.
Below we demonstrate this approach, looking at a tissue with particularly dramatic FOV effects.
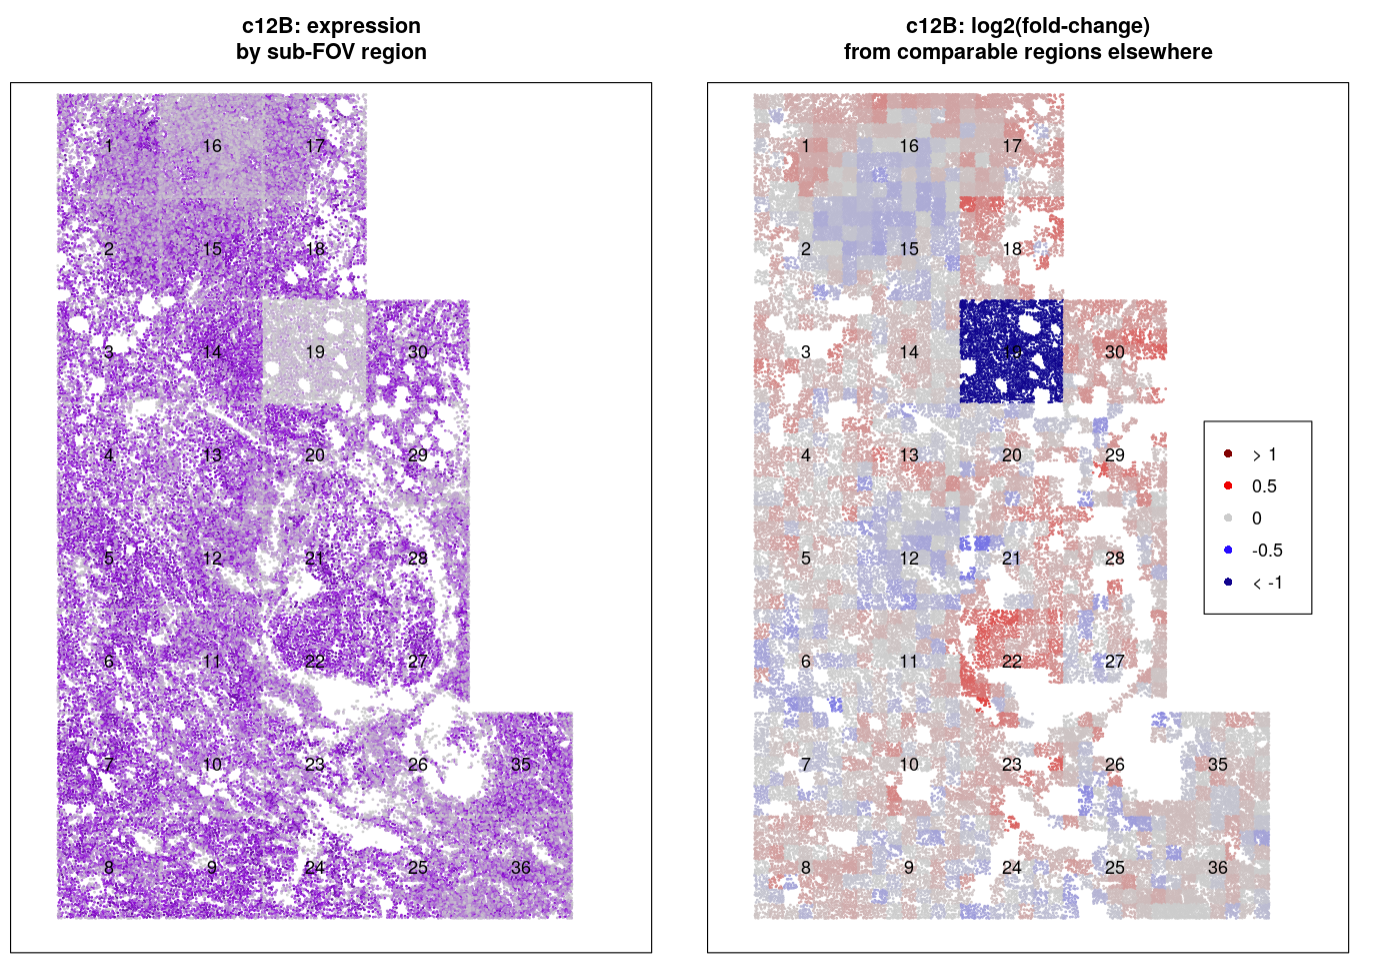
On the left, we plot expression of a single reporter bit (c12B = reporter cycle 12, color Blue) impacted by FOV effects. FOV 19 has almost entirely lost expression of the genes from this reporter, and FOV 16 looks as though it could be losing some expression.
On the right, we show the results of our FOV QC approach: for a 7x7 grid within each FOV, we see estimated change in reporter bit expression compared to similar grid squares in other FOVs. FOV 19 still stands out as an obvious quality control flag. In contrast, the low expression in FOV 16 is shown to be similar - sometimes higher, sometimes lower - than biologically similar regions elsewhere in the tissue. FOV 22 now stands out as having perhaps increased expression of the bit, but the high log2(fold-changes) (red squares) appear to follow spatially smooth biology and not the sharp FOV borders, suggesting we need not worry about technical quality issues in this FOV.
Our tool summarize our output across FOVs x reporter bits with plots like the below:
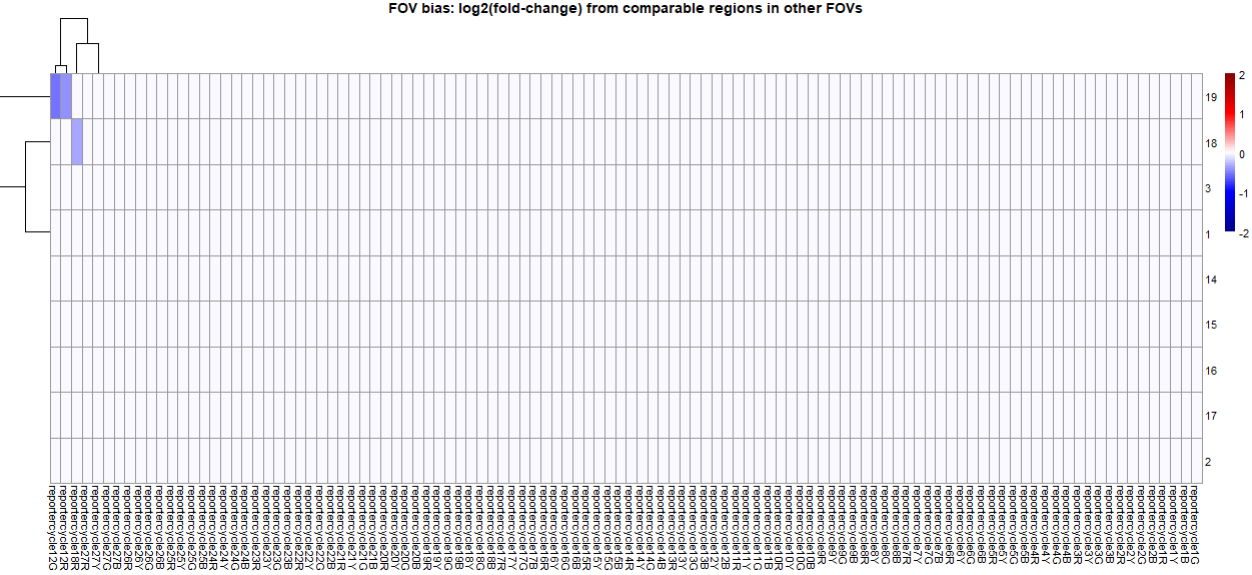
In this example, 2 reporter bits from reporter cycle 12 were flagged, as was one bit from reporter cycle 18. Because low quality impacts reporter cycles, not the individual colors within them, we only flag FOVs in which at least two reporters/colors from a single reporter cycle appear anomalous. This rule helps avoid flagging FOVs due to biological variability. So in this example, FOV 19 would be flagged since it had 2 bits flagged in reporter cycle 12, whereas FOV 18 would not be flagged since it had only one bit flagged in reporter cycle 18.
Code
Vignette for FOV QC can be found here with functions stored under _code/FOV QC folder in the repository. The gene-to-barcode mappings needed by this approach are saved in the same folder.
We advise this approach be applied separately to each slide or tissue in a study.
This experimental approach is new as of April 2024 and is lightly tested. Please use thoughtfully while considering biological context.